Cities with the Lowest Percentage of Births to Unmarried Women over the Age of 35 in California
RELATED REPORTS & OPTIONS
Lowest Illegitimacy | Women 35+
California
Compare Cities
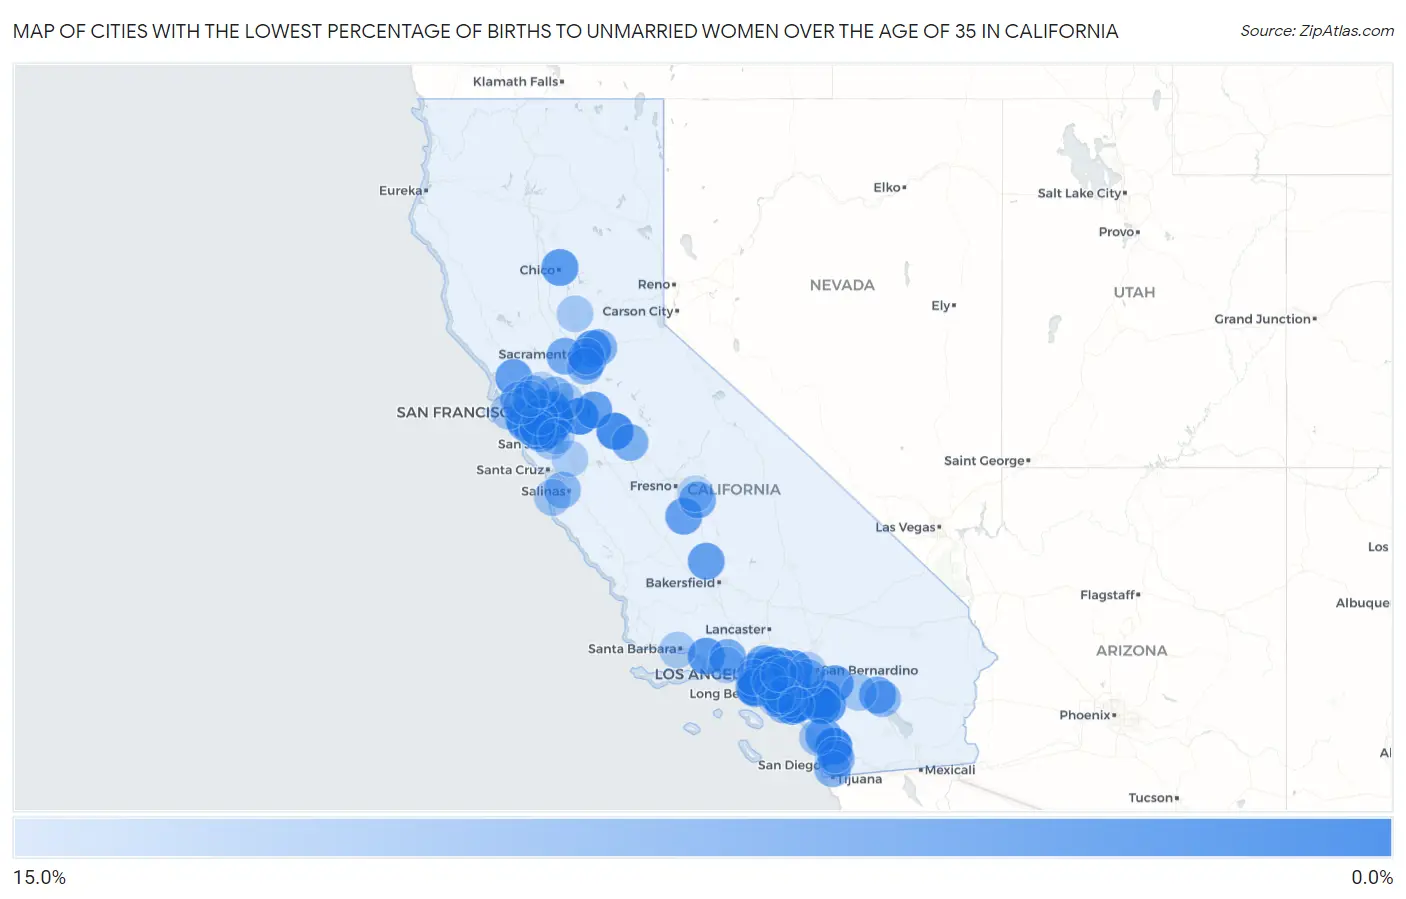
Map of Cities with the Lowest Percentage of Births to Unmarried Women over the Age of 35 in California
15.0%
0.0%
Cities with the Lowest Percentage of Births to Unmarried Women over the Age of 35 in California
| City | % Unmarried | vs State | vs National | |
| 1. | Poway | 1.0% | 19.8%(-18.8)#1 | 20.1%(-19.1)#5 |
| 2. | Costa Mesa | 1.7% | 19.8%(-18.1)#2 | 20.1%(-18.4)#12 |
| 3. | Menifee | 1.7% | 19.8%(-18.1)#3 | 20.1%(-18.4)#13 |
| 4. | San Ramon | 1.8% | 19.8%(-18.0)#4 | 20.1%(-18.3)#18 |
| 5. | Aliso Viejo | 1.8% | 19.8%(-18.0)#5 | 20.1%(-18.3)#19 |
| 6. | Tracy | 2.2% | 19.8%(-17.6)#6 | 20.1%(-17.9)#25 |
| 7. | Yorba Linda | 2.2% | 19.8%(-17.6)#7 | 20.1%(-17.9)#27 |
| 8. | Turlock | 2.6% | 19.8%(-17.2)#8 | 20.1%(-17.5)#42 |
| 9. | Pleasanton | 3.0% | 19.8%(-16.8)#9 | 20.1%(-17.1)#49 |
| 10. | Daly City | 3.2% | 19.8%(-16.6)#10 | 20.1%(-16.9)#52 |
| 11. | Claremont | 3.3% | 19.8%(-16.5)#11 | 20.1%(-16.8)#54 |
| 12. | Rancho Santa Margarita | 3.6% | 19.8%(-16.2)#12 | 20.1%(-16.5)#68 |
| 13. | Danville | 4.0% | 19.8%(-15.8)#13 | 20.1%(-16.1)#79 |
| 14. | Fair Oaks | 4.1% | 19.8%(-15.7)#14 | 20.1%(-16.0)#81 |
| 15. | San Buenaventura Ventura | 4.5% | 19.8%(-15.3)#15 | 20.1%(-15.6)#90 |
| 16. | Fremont | 4.6% | 19.8%(-15.2)#16 | 20.1%(-15.5)#97 |
| 17. | Chino Hills | 4.6% | 19.8%(-15.2)#17 | 20.1%(-15.5)#98 |
| 18. | French Valley | 4.6% | 19.8%(-15.2)#18 | 20.1%(-15.5)#101 |
| 19. | Chico | 4.8% | 19.8%(-15.0)#19 | 20.1%(-15.3)#107 |
| 20. | Orange | 4.9% | 19.8%(-14.9)#20 | 20.1%(-15.2)#113 |
| 21. | Beaumont | 4.9% | 19.8%(-14.9)#21 | 20.1%(-15.2)#114 |
| 22. | Arcadia | 5.0% | 19.8%(-14.8)#22 | 20.1%(-15.1)#118 |
| 23. | Dublin | 5.2% | 19.8%(-14.6)#23 | 20.1%(-14.9)#127 |
| 24. | Laguna Hills | 5.4% | 19.8%(-14.4)#24 | 20.1%(-14.7)#140 |
| 25. | Petaluma | 5.6% | 19.8%(-14.2)#25 | 20.1%(-14.5)#144 |
| 26. | Mcfarland | 5.7% | 19.8%(-14.1)#26 | 20.1%(-14.4)#150 |
| 27. | Hanford | 5.8% | 19.8%(-14.0)#27 | 20.1%(-14.3)#153 |
| 28. | Manteca | 5.9% | 19.8%(-13.9)#28 | 20.1%(-14.2)#157 |
| 29. | Redondo Beach | 5.9% | 19.8%(-13.9)#29 | 20.1%(-14.2)#159 |
| 30. | Duarte | 6.0% | 19.8%(-13.8)#30 | 20.1%(-14.1)#167 |
| 31. | South Pasadena | 6.1% | 19.8%(-13.7)#31 | 20.1%(-14.0)#168 |
| 32. | Eastern Goleta Valley | 6.2% | 19.8%(-13.6)#32 | 20.1%(-13.9)#172 |
| 33. | Vineyard | 6.3% | 19.8%(-13.5)#33 | 20.1%(-13.8)#175 |
| 34. | Wildomar | 6.4% | 19.8%(-13.4)#34 | 20.1%(-13.7)#177 |
| 35. | Indio | 6.7% | 19.8%(-13.1)#35 | 20.1%(-13.4)#191 |
| 36. | Torrance | 7.0% | 19.8%(-12.8)#36 | 20.1%(-13.1)#204 |
| 37. | West Hollywood | 7.0% | 19.8%(-12.8)#37 | 20.1%(-13.1)#207 |
| 38. | San Marcos | 7.1% | 19.8%(-12.7)#38 | 20.1%(-13.0)#211 |
| 39. | Glendale | 7.3% | 19.8%(-12.5)#39 | 20.1%(-12.8)#220 |
| 40. | Murrieta | 7.4% | 19.8%(-12.4)#40 | 20.1%(-12.7)#223 |
| 41. | Davis | 7.5% | 19.8%(-12.3)#41 | 20.1%(-12.6)#226 |
| 42. | Moorpark | 7.5% | 19.8%(-12.3)#42 | 20.1%(-12.6)#230 |
| 43. | Dinuba | 7.5% | 19.8%(-12.3)#43 | 20.1%(-12.6)#231 |
| 44. | Kentfield | 7.5% | 19.8%(-12.3)#44 | 20.1%(-12.6)#232 |
| 45. | Menlo Park | 7.6% | 19.8%(-12.2)#45 | 20.1%(-12.5)#234 |
| 46. | Moraga | 7.6% | 19.8%(-12.2)#46 | 20.1%(-12.5)#235 |
| 47. | El Cajon | 7.8% | 19.8%(-12.0)#47 | 20.1%(-12.3)#243 |
| 48. | San Bruno | 7.8% | 19.8%(-12.0)#48 | 20.1%(-12.3)#245 |
| 49. | Montebello | 7.9% | 19.8%(-11.9)#49 | 20.1%(-12.2)#251 |
| 50. | Del Aire | 7.9% | 19.8%(-11.9)#50 | 20.1%(-12.2)#257 |
| 51. | Redwood City | 8.1% | 19.8%(-11.7)#51 | 20.1%(-12.0)#261 |
| 52. | Atwater | 8.2% | 19.8%(-11.6)#52 | 20.1%(-11.9)#267 |
| 53. | Diamond Bar | 8.4% | 19.8%(-11.4)#53 | 20.1%(-11.7)#275 |
| 54. | Bonita | 8.7% | 19.8%(-11.1)#54 | 20.1%(-11.4)#290 |
| 55. | Jurupa Valley | 8.9% | 19.8%(-10.9)#55 | 20.1%(-11.2)#297 |
| 56. | Folsom | 8.9% | 19.8%(-10.9)#56 | 20.1%(-11.2)#298 |
| 57. | Fullerton | 9.1% | 19.8%(-10.7)#57 | 20.1%(-11.0)#304 |
| 58. | South San Jose Hills | 9.1% | 19.8%(-10.7)#58 | 20.1%(-11.0)#308 |
| 59. | Pittsburg | 9.3% | 19.8%(-10.5)#59 | 20.1%(-10.8)#315 |
| 60. | Rowland Heights | 9.5% | 19.8%(-10.3)#60 | 20.1%(-10.6)#323 |
| 61. | Pasadena | 9.7% | 19.8%(-10.1)#61 | 20.1%(-10.4)#331 |
| 62. | Hercules | 9.7% | 19.8%(-10.1)#62 | 20.1%(-10.4)#335 |
| 63. | Elk Grove | 10.0% | 19.8%(-9.80)#63 | 20.1%(-10.1)#343 |
| 64. | Newport Beach | 10.0% | 19.8%(-9.80)#64 | 20.1%(-10.1)#344 |
| 65. | Marina | 10.0% | 19.8%(-9.80)#65 | 20.1%(-10.1)#348 |
| 66. | Irvine | 10.1% | 19.8%(-9.70)#66 | 20.1%(-10.0)#351 |
| 67. | Hermosa Beach | 10.1% | 19.8%(-9.70)#67 | 20.1%(-10.0)#355 |
| 68. | Fountain Valley | 10.2% | 19.8%(-9.60)#68 | 20.1%(-9.90)#358 |
| 69. | Coachella | 10.2% | 19.8%(-9.60)#69 | 20.1%(-9.90)#360 |
| 70. | Artesia | 10.9% | 19.8%(-8.90)#70 | 20.1%(-9.20)#385 |
| 71. | Rosemont | 11.1% | 19.8%(-8.70)#71 | 20.1%(-9.00)#391 |
| 72. | San Mateo | 11.5% | 19.8%(-8.30)#72 | 20.1%(-8.60)#409 |
| 73. | Westminster | 11.5% | 19.8%(-8.30)#73 | 20.1%(-8.60)#412 |
| 74. | Eastvale | 11.5% | 19.8%(-8.30)#74 | 20.1%(-8.60)#414 |
| 75. | Del Monte Forest | 11.5% | 19.8%(-8.30)#75 | 20.1%(-8.60)#416 |
| 76. | San Francisco | 11.6% | 19.8%(-8.20)#76 | 20.1%(-8.50)#417 |
| 77. | Carlsbad | 11.6% | 19.8%(-8.20)#77 | 20.1%(-8.50)#419 |
| 78. | Santa Clara | 12.1% | 19.8%(-7.70)#78 | 20.1%(-8.00)#437 |
| 79. | Palm Springs | 12.2% | 19.8%(-7.60)#79 | 20.1%(-7.90)#442 |
| 80. | Huntington Beach | 12.3% | 19.8%(-7.50)#80 | 20.1%(-7.80)#447 |
| 81. | Thousand Oaks | 12.3% | 19.8%(-7.50)#81 | 20.1%(-7.80)#449 |
| 82. | Santa Barbara | 12.3% | 19.8%(-7.50)#82 | 20.1%(-7.80)#450 |
| 83. | Linda | 12.3% | 19.8%(-7.50)#83 | 20.1%(-7.80)#454 |
| 84. | Culver City | 12.5% | 19.8%(-7.30)#84 | 20.1%(-7.60)#458 |
| 85. | Walnut | 12.5% | 19.8%(-7.30)#85 | 20.1%(-7.60)#460 |
| 86. | Fontana | 12.7% | 19.8%(-7.10)#86 | 20.1%(-7.40)#472 |
| 87. | Santa Ana | 13.0% | 19.8%(-6.80)#87 | 20.1%(-7.10)#487 |
| 88. | Downey | 13.0% | 19.8%(-6.80)#88 | 20.1%(-7.10)#489 |
| 89. | Brentwood | 13.0% | 19.8%(-6.80)#89 | 20.1%(-7.10)#491 |
| 90. | Foster City | 13.0% | 19.8%(-6.80)#90 | 20.1%(-7.10)#492 |
| 91. | San Leandro | 13.1% | 19.8%(-6.70)#91 | 20.1%(-7.00)#496 |
| 92. | Morgan Hill | 13.1% | 19.8%(-6.70)#92 | 20.1%(-7.00)#498 |
| 93. | Sausalito | 13.3% | 19.8%(-6.50)#93 | 20.1%(-6.80)#509 |
| 94. | West Puente Valley | 13.4% | 19.8%(-6.40)#94 | 20.1%(-6.70)#512 |
| 95. | Milpitas | 13.5% | 19.8%(-6.30)#95 | 20.1%(-6.60)#515 |
| 96. | Santee | 13.6% | 19.8%(-6.20)#96 | 20.1%(-6.50)#523 |
| 97. | Benicia | 13.6% | 19.8%(-6.20)#97 | 20.1%(-6.50)#528 |
| 98. | Reedley | 13.8% | 19.8%(-6.00)#98 | 20.1%(-6.30)#538 |
| 99. | Richmond | 13.9% | 19.8%(-5.90)#99 | 20.1%(-6.20)#543 |
| 100. | Mission Viejo | 14.1% | 19.8%(-5.70)#100 | 20.1%(-6.00)#556 |
Common Questions
What are the Top 10 Cities with the Lowest Percentage of Births to Unmarried Women over the Age of 35 in California?
Top 10 Cities with the Lowest Percentage of Births to Unmarried Women over the Age of 35 in California are:
#1
1.0%
#2
1.7%
#3
1.7%
#4
1.8%
#5
1.8%
#6
2.2%
#7
2.2%
#8
2.6%
#9
3.0%
#10
3.2%
What city has the Lowest Percentage of Births to Unmarried Women over the Age of 35 in California?
Poway has the Lowest Percentage of Births to Unmarried Women over the Age of 35 in California with 1.0%.
What is the Percentage of Births to Unmarried Women over the Age of 35 in the State of California?
Percentage of Births to Unmarried Women over the Age of 35 in California is 19.8%.
What is the Percentage of Births to Unmarried Women over the Age of 35 in the United States?
Percentage of Births to Unmarried Women over the Age of 35 in the United States is 20.1%.