Cities with the Fewest Births per 1,000 Women Below Poverty Level in California
RELATED REPORTS & OPTIONS
Lowest Birth Rate | Below Poverty
California
Compare Cities
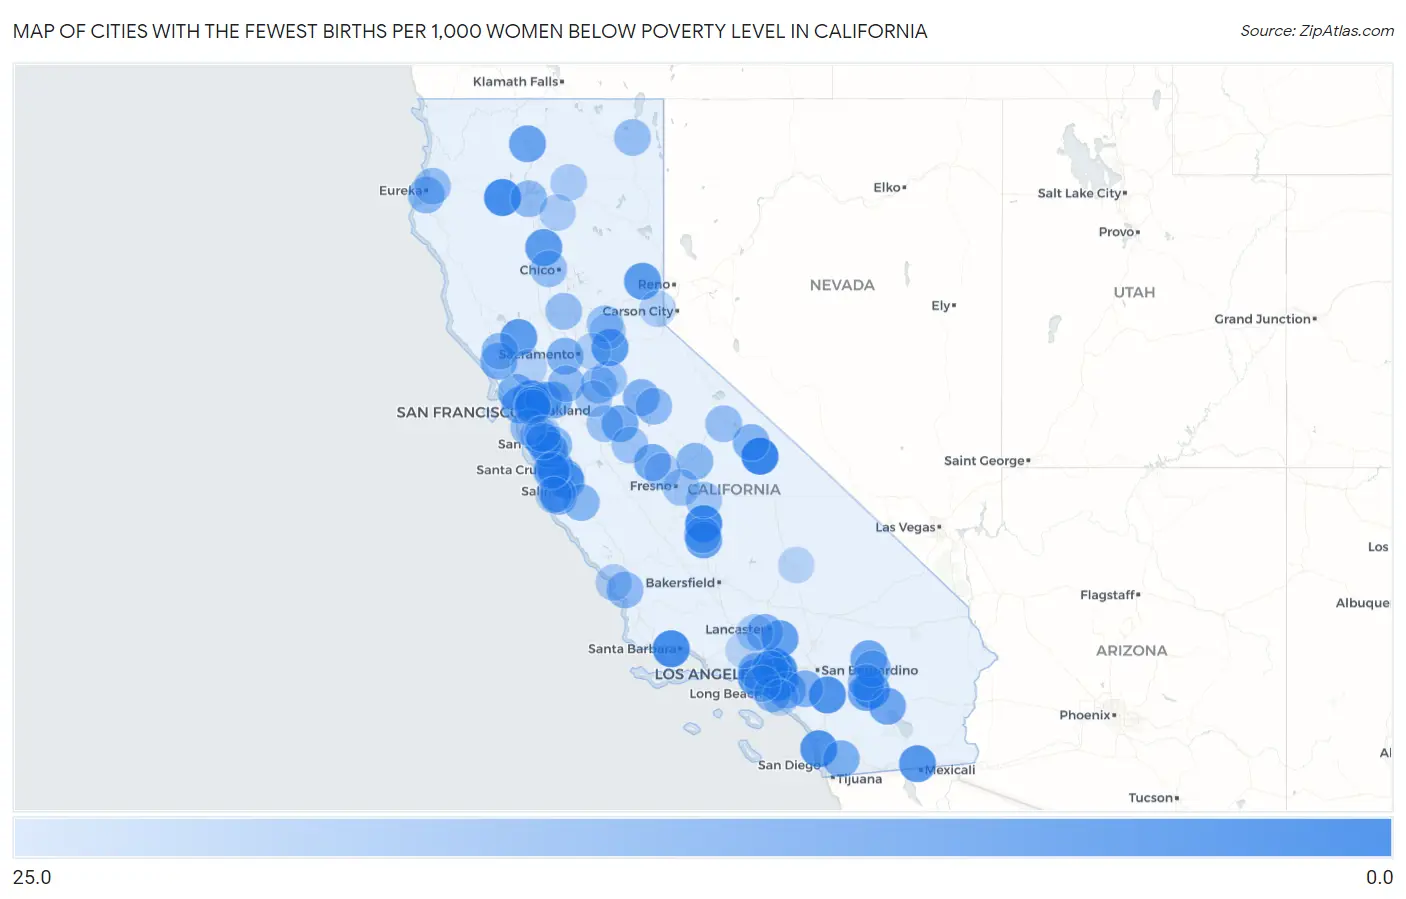
Map of Cities with the Fewest Births per 1,000 Women Below Poverty Level in California
25.0
0.0
Cities with the Fewest Births per 1,000 Women Below Poverty Level in California
| City | Births / 1,000 Women | vs State | vs National | |
| 1. | Big Pine | 3.0 | 49.0(-46.0)#1 | 53.0(-50.0)#31 |
| 2. | Isla Vista | 5.0 | 49.0(-44.0)#2 | 53.0(-48.0)#60 |
| 3. | Sierra Madre | 5.0 | 49.0(-44.0)#3 | 53.0(-48.0)#62 |
| 4. | Lewiston | 5.0 | 49.0(-44.0)#4 | 53.0(-48.0)#86 |
| 5. | East Tulare Villa | 5.0 | 49.0(-44.0)#5 | 53.0(-48.0)#97 |
| 6. | East Whittier | 6.0 | 49.0(-43.0)#6 | 53.0(-47.0)#111 |
| 7. | Homeland | 7.0 | 49.0(-42.0)#7 | 53.0(-46.0)#166 |
| 8. | Del Mar | 7.0 | 49.0(-42.0)#8 | 53.0(-46.0)#174 |
| 9. | Rollingwood | 7.0 | 49.0(-42.0)#9 | 53.0(-46.0)#177 |
| 10. | Thousand Palms | 8.0 | 49.0(-41.0)#10 | 53.0(-45.0)#251 |
| 11. | Heber | 8.0 | 49.0(-41.0)#11 | 53.0(-45.0)#252 |
| 12. | Ladera Heights | 8.0 | 49.0(-41.0)#12 | 53.0(-45.0)#258 |
| 13. | La Habra Heights | 8.0 | 49.0(-41.0)#13 | 53.0(-45.0)#263 |
| 14. | Irwindale | 8.0 | 49.0(-41.0)#14 | 53.0(-45.0)#306 |
| 15. | Hidden Valley Lake | 9.0 | 49.0(-40.0)#15 | 53.0(-44.0)#343 |
| 16. | Shingle Springs | 9.0 | 49.0(-40.0)#16 | 53.0(-44.0)#362 |
| 17. | Rose Hills | 9.0 | 49.0(-40.0)#17 | 53.0(-44.0)#370 |
| 18. | Los Molinos | 9.0 | 49.0(-40.0)#18 | 53.0(-44.0)#387 |
| 19. | Sierraville | 9.0 | 49.0(-40.0)#19 | 53.0(-44.0)#429 |
| 20. | Sun Village | 10.0 | 49.0(-39.0)#20 | 53.0(-43.0)#434 |
| 21. | Rio Del Mar | 10.0 | 49.0(-39.0)#21 | 53.0(-43.0)#440 |
| 22. | Pixley | 11.0 | 49.0(-38.0)#22 | 53.0(-42.0)#583 |
| 23. | Weed | 11.0 | 49.0(-38.0)#23 | 53.0(-42.0)#592 |
| 24. | Rancho Mirage | 12.0 | 49.0(-37.0)#24 | 53.0(-41.0)#657 |
| 25. | Mecca | 12.0 | 49.0(-37.0)#25 | 53.0(-41.0)#670 |
| 26. | Marin City | 12.0 | 49.0(-37.0)#26 | 53.0(-41.0)#693 |
| 27. | Homestead Valley | 12.0 | 49.0(-37.0)#27 | 53.0(-41.0)#703 |
| 28. | Del Rey Oaks | 13.0 | 49.0(-36.0)#28 | 53.0(-40.0)#847 |
| 29. | Fairmead | 13.0 | 49.0(-36.0)#29 | 53.0(-40.0)#858 |
| 30. | Hickman | 13.0 | 49.0(-36.0)#30 | 53.0(-40.0)#880 |
| 31. | Clayton | 14.0 | 49.0(-35.0)#31 | 53.0(-39.0)#929 |
| 32. | Lucas Valley Marinwood | 14.0 | 49.0(-35.0)#32 | 53.0(-39.0)#940 |
| 33. | Kensington | 14.0 | 49.0(-35.0)#33 | 53.0(-39.0)#943 |
| 34. | Forestville | 14.0 | 49.0(-35.0)#34 | 53.0(-39.0)#956 |
| 35. | Crest | 14.0 | 49.0(-35.0)#35 | 53.0(-39.0)#965 |
| 36. | Las Lomas | 14.0 | 49.0(-35.0)#36 | 53.0(-39.0)#967 |
| 37. | Elkhorn | 14.0 | 49.0(-35.0)#37 | 53.0(-39.0)#1,001 |
| 38. | Davis | 15.0 | 49.0(-34.0)#38 | 53.0(-38.0)#1,066 |
| 39. | West Hollywood | 15.0 | 49.0(-34.0)#39 | 53.0(-38.0)#1,067 |
| 40. | Quartz Hill | 15.0 | 49.0(-34.0)#40 | 53.0(-38.0)#1,081 |
| 41. | Villa Park | 15.0 | 49.0(-34.0)#41 | 53.0(-38.0)#1,102 |
| 42. | El Cerrito | 15.0 | 49.0(-34.0)#42 | 53.0(-38.0)#1,105 |
| 43. | Sonora | 15.0 | 49.0(-34.0)#43 | 53.0(-38.0)#1,112 |
| 44. | Loyola | 15.0 | 49.0(-34.0)#44 | 53.0(-38.0)#1,129 |
| 45. | Reliez Valley | 15.0 | 49.0(-34.0)#45 | 53.0(-38.0)#1,135 |
| 46. | Tipton | 15.0 | 49.0(-34.0)#46 | 53.0(-38.0)#1,136 |
| 47. | West Bishop | 15.0 | 49.0(-34.0)#47 | 53.0(-38.0)#1,146 |
| 48. | Saratoga | 16.0 | 49.0(-33.0)#48 | 53.0(-37.0)#1,225 |
| 49. | Seal Beach | 16.0 | 49.0(-33.0)#49 | 53.0(-37.0)#1,226 |
| 50. | San Marino | 16.0 | 49.0(-33.0)#50 | 53.0(-37.0)#1,232 |
| 51. | Gonzales | 16.0 | 49.0(-33.0)#51 | 53.0(-37.0)#1,244 |
| 52. | Atherton | 16.0 | 49.0(-33.0)#52 | 53.0(-37.0)#1,251 |
| 53. | Joshua Tree | 16.0 | 49.0(-33.0)#53 | 53.0(-37.0)#1,252 |
| 54. | Aptos | 16.0 | 49.0(-33.0)#54 | 53.0(-37.0)#1,253 |
| 55. | Pine Hills | 16.0 | 49.0(-33.0)#55 | 53.0(-37.0)#1,279 |
| 56. | Auberry | 16.0 | 49.0(-33.0)#56 | 53.0(-37.0)#1,287 |
| 57. | Bayview Cdp Contra Costa County | 16.0 | 49.0(-33.0)#57 | 53.0(-37.0)#1,296 |
| 58. | Fruitdale | 16.0 | 49.0(-33.0)#58 | 53.0(-37.0)#1,324 |
| 59. | San Luis Obispo | 17.0 | 49.0(-32.0)#59 | 53.0(-36.0)#1,402 |
| 60. | Healdsburg | 17.0 | 49.0(-32.0)#60 | 53.0(-36.0)#1,412 |
| 61. | Shasta Lake | 17.0 | 49.0(-32.0)#61 | 53.0(-36.0)#1,413 |
| 62. | Rio Vista | 17.0 | 49.0(-32.0)#62 | 53.0(-36.0)#1,414 |
| 63. | Lockeford | 17.0 | 49.0(-32.0)#63 | 53.0(-36.0)#1,445 |
| 64. | Desert Edge | 17.0 | 49.0(-32.0)#64 | 53.0(-36.0)#1,448 |
| 65. | Monte Sereno | 17.0 | 49.0(-32.0)#65 | 53.0(-36.0)#1,455 |
| 66. | Pine Mountain Lake | 17.0 | 49.0(-32.0)#66 | 53.0(-36.0)#1,461 |
| 67. | Sand City | 17.0 | 49.0(-32.0)#67 | 53.0(-36.0)#1,546 |
| 68. | Arcata | 18.0 | 49.0(-31.0)#68 | 53.0(-35.0)#1,566 |
| 69. | Hillsborough | 18.0 | 49.0(-31.0)#69 | 53.0(-35.0)#1,573 |
| 70. | Capitola | 18.0 | 49.0(-31.0)#70 | 53.0(-35.0)#1,576 |
| 71. | Mammoth Lakes | 18.0 | 49.0(-31.0)#71 | 53.0(-35.0)#1,592 |
| 72. | Sutter | 18.0 | 49.0(-31.0)#72 | 53.0(-35.0)#1,618 |
| 73. | Alturas | 18.0 | 49.0(-31.0)#73 | 53.0(-35.0)#1,626 |
| 74. | Hamilton City | 18.0 | 49.0(-31.0)#74 | 53.0(-35.0)#1,639 |
| 75. | Berkeley | 19.0 | 49.0(-30.0)#75 | 53.0(-34.0)#1,740 |
| 76. | Emeryville | 19.0 | 49.0(-30.0)#76 | 53.0(-34.0)#1,749 |
| 77. | Pleasure Point | 19.0 | 49.0(-30.0)#77 | 53.0(-34.0)#1,780 |
| 78. | West Modesto | 19.0 | 49.0(-30.0)#78 | 53.0(-34.0)#1,783 |
| 79. | Mcswain | 19.0 | 49.0(-30.0)#79 | 53.0(-34.0)#1,784 |
| 80. | Sunnyside | 19.0 | 49.0(-30.0)#80 | 53.0(-34.0)#1,786 |
| 81. | Meadow Vista | 19.0 | 49.0(-30.0)#81 | 53.0(-34.0)#1,798 |
| 82. | Camanche North Shore | 19.0 | 49.0(-30.0)#82 | 53.0(-34.0)#1,837 |
| 83. | Garden Acres | 20.0 | 49.0(-29.0)#83 | 53.0(-33.0)#1,927 |
| 84. | Orosi | 20.0 | 49.0(-29.0)#84 | 53.0(-33.0)#1,931 |
| 85. | Pacific Grove | 21.0 | 49.0(-28.0)#85 | 53.0(-32.0)#2,085 |
| 86. | Morro Bay | 21.0 | 49.0(-28.0)#86 | 53.0(-32.0)#2,097 |
| 87. | Auburn Lake Trails | 21.0 | 49.0(-28.0)#87 | 53.0(-32.0)#2,119 |
| 88. | Burney | 21.0 | 49.0(-28.0)#88 | 53.0(-32.0)#2,126 |
| 89. | Parksdale | 21.0 | 49.0(-28.0)#89 | 53.0(-32.0)#2,138 |
| 90. | Shingletown | 21.0 | 49.0(-28.0)#90 | 53.0(-32.0)#2,145 |
| 91. | Elizabeth Lake | 21.0 | 49.0(-28.0)#91 | 53.0(-32.0)#2,159 |
| 92. | Los Altos | 22.0 | 49.0(-27.0)#92 | 53.0(-31.0)#2,253 |
| 93. | East Palo Alto | 22.0 | 49.0(-27.0)#93 | 53.0(-31.0)#2,256 |
| 94. | Gold River | 22.0 | 49.0(-27.0)#94 | 53.0(-31.0)#2,275 |
| 95. | Yountville | 22.0 | 49.0(-27.0)#95 | 53.0(-31.0)#2,312 |
| 96. | Dollar Point | 22.0 | 49.0(-27.0)#96 | 53.0(-31.0)#2,371 |
| 97. | Fountain Valley | 23.0 | 49.0(-26.0)#97 | 53.0(-30.0)#2,449 |
| 98. | Ridgecrest | 23.0 | 49.0(-26.0)#98 | 53.0(-30.0)#2,453 |
| 99. | West Rancho Dominguez | 23.0 | 49.0(-26.0)#99 | 53.0(-30.0)#2,462 |
| 100. | Stevenson Ranch | 23.0 | 49.0(-26.0)#100 | 53.0(-30.0)#2,466 |
Common Questions
What are the Top 10 Cities with the Fewest Births per 1,000 Women Below Poverty Level in California?
Top 10 Cities with the Fewest Births per 1,000 Women Below Poverty Level in California are:
#1
3.0
#2
5.0
#3
5.0
#4
5.0
#5
5.0
#6
6.0
#7
7.0
#8
7.0
#9
7.0
#10
8.0
What city has the Fewest Births per 1,000 Women Below Poverty Level in California?
Big Pine has the Fewest Births per 1,000 Women Below Poverty Level in California with 3.0.
What is the Number of Births per 1,000 Women Below Poverty Level in the State of California?
Number of Births per 1,000 Women Below Poverty Level in California is 49.0.
What is the Number of Births per 1,000 Women Below Poverty Level in the United States?
Number of Births per 1,000 Women Below Poverty Level in the United States is 53.0.