Cities with the Highest Percentage of Population Employed in Installation, Maintenance & Repair in New Mexico
RELATED REPORTS & OPTIONS
Installation, Maintenance & Repair
New Mexico
Compare Cities
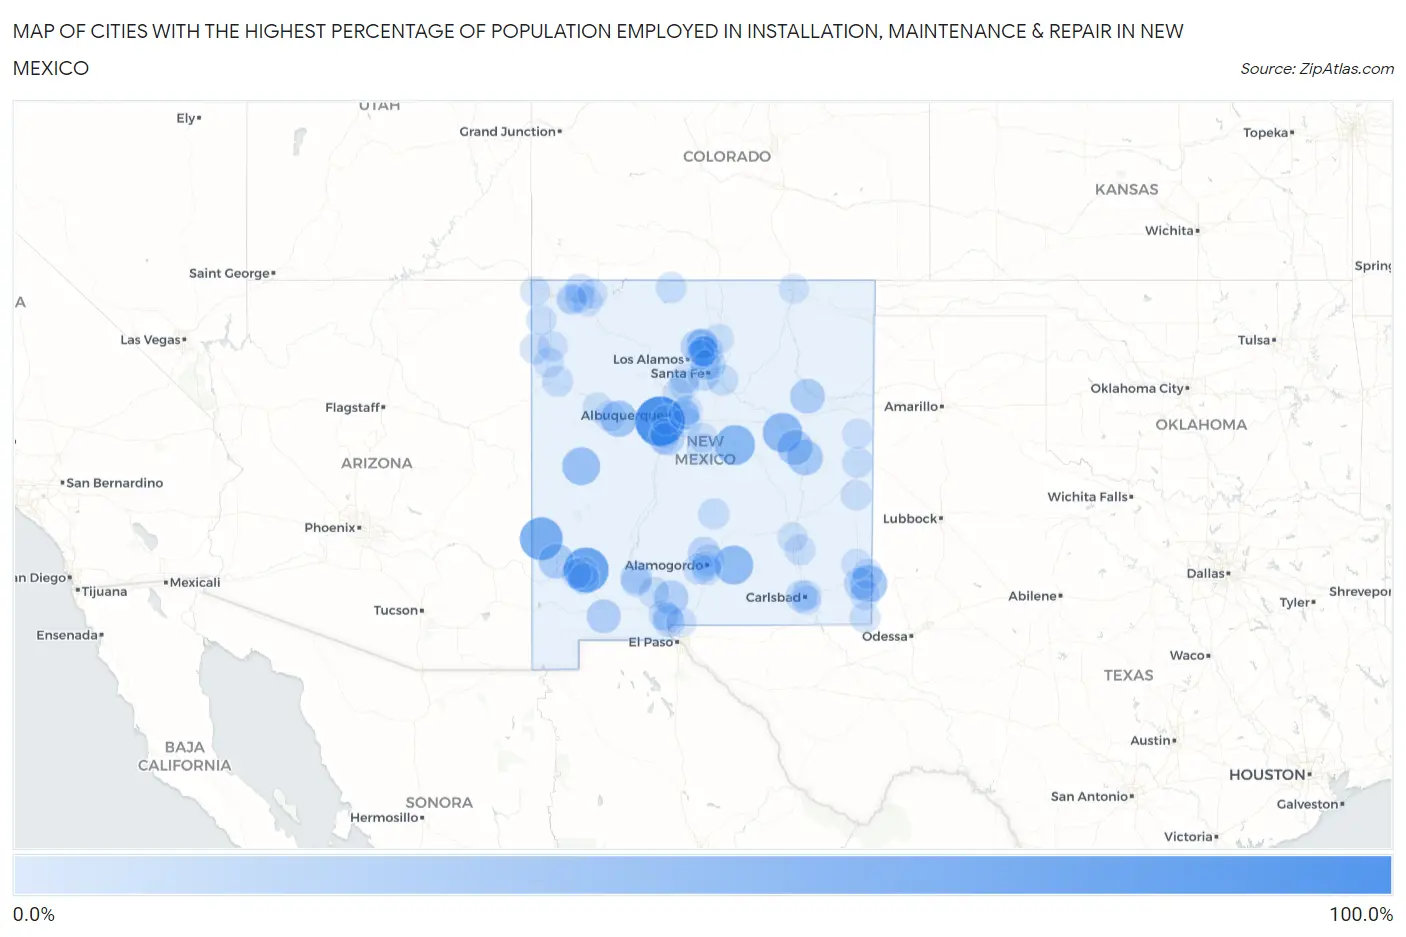
Map of Cities with the Highest Percentage of Population Employed in Installation, Maintenance & Repair in New Mexico
0.0%
100.0%
Cities with the Highest Percentage of Population Employed in Installation, Maintenance & Repair in New Mexico
| City | % Employed | vs State | vs National | |
| 1. | Jamestown | 100.0% | 3.7%(+96.3)#1 | 3.1%(+96.9)#2 |
| 2. | Pajarito Mesa | 100.0% | 3.7%(+96.3)#2 | 3.1%(+96.9)#3 |
| 3. | San Jose Cdp San Miguel County | 100.0% | 3.7%(+96.3)#3 | 3.1%(+96.9)#7 |
| 4. | Hanover | 76.5% | 3.7%(+72.8)#4 | 3.1%(+73.4)#25 |
| 5. | Pleasanton | 66.7% | 3.7%(+63.0)#5 | 3.1%(+63.6)#32 |
| 6. | Encino | 52.0% | 3.7%(+48.3)#6 | 3.1%(+48.9)#65 |
| 7. | Puerto De Luna | 50.0% | 3.7%(+46.3)#7 | 3.1%(+46.9)#72 |
| 8. | Mayhill | 47.8% | 3.7%(+44.1)#8 | 3.1%(+44.8)#90 |
| 9. | Pie Town | 42.1% | 3.7%(+38.4)#9 | 3.1%(+39.0)#129 |
| 10. | Nadine | 38.7% | 3.7%(+35.0)#10 | 3.1%(+35.6)#156 |
| 11. | Seama | 34.6% | 3.7%(+30.9)#11 | 3.1%(+31.5)#206 |
| 12. | Bluewater | 31.5% | 3.7%(+27.9)#12 | 3.1%(+28.5)#255 |
| 13. | Fort Sumner | 31.4% | 3.7%(+27.7)#13 | 3.1%(+28.3)#260 |
| 14. | Lake Sumner | 30.8% | 3.7%(+27.1)#14 | 3.1%(+27.7)#269 |
| 15. | Cliff | 28.8% | 3.7%(+25.2)#15 | 3.1%(+25.8)#310 |
| 16. | Conchas Dam | 27.6% | 3.7%(+23.9)#16 | 3.1%(+24.5)#343 |
| 17. | Organ | 25.0% | 3.7%(+21.3)#17 | 3.1%(+21.9)#416 |
| 18. | Sunshine | 23.8% | 3.7%(+20.2)#18 | 3.1%(+20.8)#465 |
| 19. | Monterey Park | 21.6% | 3.7%(+17.9)#19 | 3.1%(+18.5)#565 |
| 20. | El Duende | 21.1% | 3.7%(+17.4)#20 | 3.1%(+18.0)#596 |
| 21. | Prewitt | 20.8% | 3.7%(+17.1)#21 | 3.1%(+17.8)#613 |
| 22. | Turley | 18.1% | 3.7%(+14.4)#22 | 3.1%(+15.0)#811 |
| 23. | Monument | 16.1% | 3.7%(+12.4)#23 | 3.1%(+13.1)#1,009 |
| 24. | Center Point | 16.1% | 3.7%(+12.4)#24 | 3.1%(+13.0)#1,014 |
| 25. | Salem | 14.9% | 3.7%(+11.3)#25 | 3.1%(+11.9)#1,171 |
| 26. | Chimayo | 14.7% | 3.7%(+11.0)#26 | 3.1%(+11.6)#1,205 |
| 27. | La Puebla | 14.6% | 3.7%(+10.9)#27 | 3.1%(+11.6)#1,208 |
| 28. | Tularosa | 14.6% | 3.7%(+10.9)#28 | 3.1%(+11.5)#1,223 |
| 29. | Manuelito | 14.3% | 3.7%(+10.6)#29 | 3.1%(+11.2)#1,281 |
| 30. | Agua Fria | 14.0% | 3.7%(+10.3)#30 | 3.1%(+10.9)#1,335 |
| 31. | La Luz | 13.5% | 3.7%(+9.84)#31 | 3.1%(+10.5)#1,432 |
| 32. | Happy Valley | 13.4% | 3.7%(+9.71)#32 | 3.1%(+10.3)#1,463 |
| 33. | Alcalde | 13.3% | 3.7%(+9.64)#33 | 3.1%(+10.3)#1,481 |
| 34. | Santa Clara | 13.3% | 3.7%(+9.60)#34 | 3.1%(+10.2)#1,495 |
| 35. | Kirtland Afb | 12.7% | 3.7%(+8.99)#35 | 3.1%(+9.62)#1,650 |
| 36. | Berino | 12.6% | 3.7%(+8.93)#36 | 3.1%(+9.55)#1,661 |
| 37. | Holloman Afb | 12.4% | 3.7%(+8.68)#37 | 3.1%(+9.30)#1,733 |
| 38. | Willard | 12.0% | 3.7%(+8.31)#38 | 3.1%(+8.93)#1,829 |
| 39. | Rio En Medio | 11.9% | 3.7%(+8.25)#39 | 3.1%(+8.87)#1,847 |
| 40. | Isleta | 11.9% | 3.7%(+8.20)#40 | 3.1%(+8.82)#1,863 |
| 41. | Hurley | 11.3% | 3.7%(+7.65)#41 | 3.1%(+8.27)#2,041 |
| 42. | Pecos | 10.9% | 3.7%(+7.21)#42 | 3.1%(+7.83)#2,175 |
| 43. | Carrizozo | 10.3% | 3.7%(+6.59)#43 | 3.1%(+7.21)#2,432 |
| 44. | Radium Springs | 10.1% | 3.7%(+6.36)#44 | 3.1%(+6.99)#2,525 |
| 45. | Church Rock | 10.0% | 3.7%(+6.26)#45 | 3.1%(+6.89)#2,583 |
| 46. | Cedar Crest | 10.0% | 3.7%(+6.26)#46 | 3.1%(+6.89)#2,585 |
| 47. | Chama | 9.9% | 3.7%(+6.24)#47 | 3.1%(+6.86)#2,593 |
| 48. | Ponderosa Pine | 9.8% | 3.7%(+6.13)#48 | 3.1%(+6.75)#2,661 |
| 49. | Cannon Afb | 9.4% | 3.7%(+5.68)#49 | 3.1%(+6.31)#2,908 |
| 50. | Hatch | 9.0% | 3.7%(+5.35)#50 | 3.1%(+5.97)#3,098 |
| 51. | Hyde Park | 9.0% | 3.7%(+5.32)#51 | 3.1%(+5.95)#3,115 |
| 52. | Crystal | 9.0% | 3.7%(+5.31)#52 | 3.1%(+5.93)#3,122 |
| 53. | San Miguel | 8.8% | 3.7%(+5.11)#53 | 3.1%(+5.74)#3,253 |
| 54. | Santa Cruz | 8.8% | 3.7%(+5.10)#54 | 3.1%(+5.72)#3,261 |
| 55. | Hagerman | 8.8% | 3.7%(+5.10)#55 | 3.1%(+5.72)#3,267 |
| 56. | Dora | 8.6% | 3.7%(+4.88)#56 | 3.1%(+5.50)#3,453 |
| 57. | Mccartys Village | 8.5% | 3.7%(+4.76)#57 | 3.1%(+5.38)#3,544 |
| 58. | Algodones | 8.2% | 3.7%(+4.51)#58 | 3.1%(+5.13)#3,762 |
| 59. | La Villita | 8.2% | 3.7%(+4.51)#59 | 3.1%(+5.13)#3,763 |
| 60. | Jal | 8.1% | 3.7%(+4.41)#60 | 3.1%(+5.03)#3,854 |
| 61. | Tome | 8.1% | 3.7%(+4.36)#61 | 3.1%(+4.98)#3,892 |
| 62. | Santo Domingo Pueblo | 7.8% | 3.7%(+4.08)#62 | 3.1%(+4.70)#4,132 |
| 63. | Vado | 7.6% | 3.7%(+3.93)#63 | 3.1%(+4.56)#4,294 |
| 64. | Rio Rancho Estates | 7.4% | 3.7%(+3.66)#64 | 3.1%(+4.29)#4,569 |
| 65. | Boles Acres | 7.3% | 3.7%(+3.65)#65 | 3.1%(+4.28)#4,588 |
| 66. | Tijeras | 7.2% | 3.7%(+3.55)#66 | 3.1%(+4.17)#4,725 |
| 67. | Tohatchi | 7.2% | 3.7%(+3.48)#67 | 3.1%(+4.11)#4,794 |
| 68. | Grady | 7.1% | 3.7%(+3.45)#68 | 3.1%(+4.08)#4,830 |
| 69. | Lee Acres | 7.1% | 3.7%(+3.41)#69 | 3.1%(+4.04)#4,884 |
| 70. | La Huerta | 7.1% | 3.7%(+3.40)#70 | 3.1%(+4.03)#4,898 |
| 71. | Naschitti | 7.0% | 3.7%(+3.33)#71 | 3.1%(+3.95)#4,985 |
| 72. | Milan | 6.9% | 3.7%(+3.21)#72 | 3.1%(+3.84)#5,095 |
| 73. | Sanostee | 6.8% | 3.7%(+3.09)#73 | 3.1%(+3.71)#5,292 |
| 74. | Lovington | 6.7% | 3.7%(+3.04)#74 | 3.1%(+3.66)#5,351 |
| 75. | Silver City | 6.7% | 3.7%(+3.03)#75 | 3.1%(+3.66)#5,356 |
| 76. | North Hobbs | 6.7% | 3.7%(+3.02)#76 | 3.1%(+3.64)#5,373 |
| 77. | Farmington | 6.7% | 3.7%(+2.99)#77 | 3.1%(+3.61)#5,412 |
| 78. | Eunice | 6.6% | 3.7%(+2.90)#78 | 3.1%(+3.53)#5,547 |
| 79. | Tesuque Pueblo | 6.6% | 3.7%(+2.90)#79 | 3.1%(+3.52)#5,563 |
| 80. | Midway | 6.5% | 3.7%(+2.83)#80 | 3.1%(+3.45)#5,653 |
| 81. | Beclabito | 6.5% | 3.7%(+2.83)#81 | 3.1%(+3.45)#5,658 |
| 82. | La Plata | 6.4% | 3.7%(+2.68)#82 | 3.1%(+3.30)#5,862 |
| 83. | Chamisal | 6.4% | 3.7%(+2.68)#83 | 3.1%(+3.30)#5,865 |
| 84. | Chaparral | 6.3% | 3.7%(+2.64)#84 | 3.1%(+3.26)#5,936 |
| 85. | Little Walnut | 6.2% | 3.7%(+2.49)#85 | 3.1%(+3.11)#6,172 |
| 86. | Upper Fruitland | 6.1% | 3.7%(+2.44)#86 | 3.1%(+3.07)#6,242 |
| 87. | South Valley | 5.9% | 3.7%(+2.19)#87 | 3.1%(+2.81)#6,687 |
| 88. | San Jose Cdp Rio Arriba County | 5.8% | 3.7%(+2.12)#88 | 3.1%(+2.74)#6,793 |
| 89. | Dona Ana | 5.8% | 3.7%(+2.09)#89 | 3.1%(+2.72)#6,836 |
| 90. | La Mesilla | 5.7% | 3.7%(+1.96)#90 | 3.1%(+2.59)#7,094 |
| 91. | Estancia | 5.7% | 3.7%(+1.96)#91 | 3.1%(+2.58)#7,095 |
| 92. | Alamogordo | 5.6% | 3.7%(+1.93)#92 | 3.1%(+2.56)#7,149 |
| 93. | Cochiti | 5.6% | 3.7%(+1.91)#93 | 3.1%(+2.54)#7,189 |
| 94. | Cuartelez | 5.6% | 3.7%(+1.90)#94 | 3.1%(+2.52)#7,220 |
| 95. | Kirtland | 5.5% | 3.7%(+1.84)#95 | 3.1%(+2.46)#7,340 |
| 96. | Raton | 5.5% | 3.7%(+1.81)#96 | 3.1%(+2.44)#7,385 |
| 97. | Aztec | 5.5% | 3.7%(+1.78)#97 | 3.1%(+2.40)#7,461 |
| 98. | Valencia | 5.4% | 3.7%(+1.69)#98 | 3.1%(+2.31)#7,645 |
| 99. | Sandia Knolls | 5.4% | 3.7%(+1.68)#99 | 3.1%(+2.30)#7,677 |
| 100. | Carlsbad | 5.3% | 3.7%(+1.66)#100 | 3.1%(+2.28)#7,710 |
Common Questions
What are the Top 10 Cities with the Highest Percentage of Population Employed in Installation, Maintenance & Repair in New Mexico?
Top 10 Cities with the Highest Percentage of Population Employed in Installation, Maintenance & Repair in New Mexico are:
#1
100.0%
#2
76.5%
#3
66.7%
#4
52.0%
#5
50.0%
#6
47.8%
#7
42.1%
#8
38.7%
#9
34.6%
#10
31.4%
What city has the Highest Percentage of Population Employed in Installation, Maintenance & Repair in New Mexico?
Pajarito Mesa has the Highest Percentage of Population Employed in Installation, Maintenance & Repair in New Mexico with 100.0%.
What is the Percentage of Population Employed in Installation, Maintenance & Repair in the State of New Mexico?
Percentage of Population Employed in Installation, Maintenance & Repair in New Mexico is 3.7%.
What is the Percentage of Population Employed in Installation, Maintenance & Repair in the United States?
Percentage of Population Employed in Installation, Maintenance & Repair in the United States is 3.1%.