Cities with the Highest Percentage of Population Employed in Manufacturing in California
RELATED REPORTS & OPTIONS
Manufacturing
California
Compare Cities
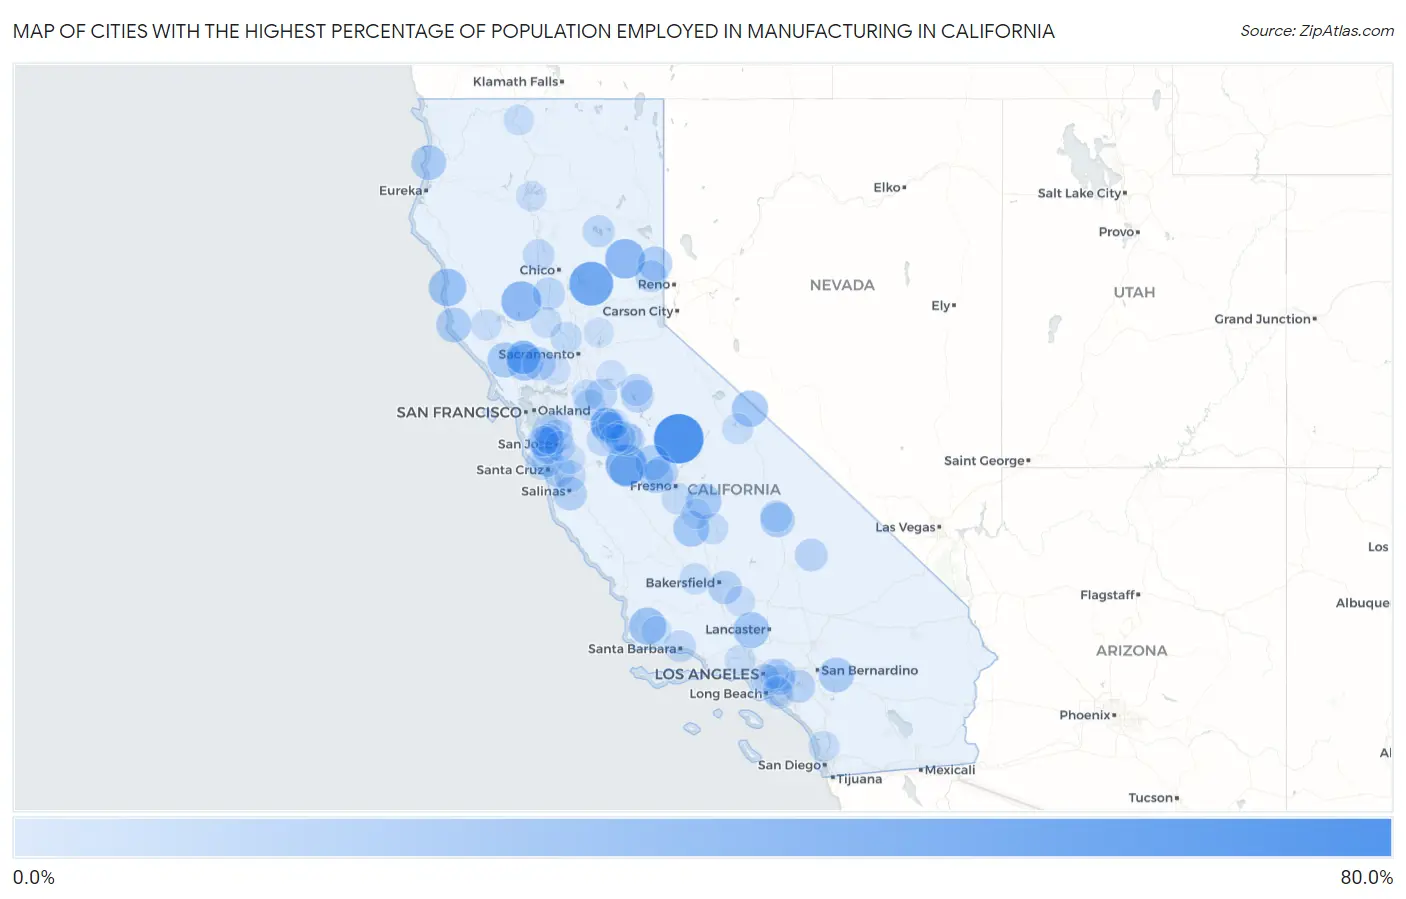
Map of Cities with the Highest Percentage of Population Employed in Manufacturing in California
0.0%
80.0%
Cities with the Highest Percentage of Population Employed in Manufacturing in California
| City | % Employed | vs State | vs National | |
| 1. | Nipinnawasee | 64.8% | 8.9%(+55.9)#1 | 10.0%(+54.8)#157 |
| 2. | Williams Canyon | 55.6% | 8.9%(+46.6)#2 | 10.0%(+45.6)#267 |
| 3. | Forbestown | 50.0% | 8.9%(+41.1)#3 | 10.0%(+40.0)#370 |
| 4. | Dos Palos Y | 42.9% | 8.9%(+34.0)#4 | 10.0%(+32.9)#659 |
| 5. | Lodoga | 39.8% | 8.9%(+30.9)#5 | 10.0%(+29.8)#855 |
| 6. | Cromberg | 39.3% | 8.9%(+30.4)#6 | 10.0%(+29.3)#878 |
| 7. | Cleone | 33.9% | 8.9%(+25.0)#7 | 10.0%(+23.9)#1,433 |
| 8. | Los Alamos | 33.1% | 8.9%(+24.2)#8 | 10.0%(+23.1)#1,549 |
| 9. | Rutherford | 31.2% | 8.9%(+22.3)#9 | 10.0%(+21.3)#1,833 |
| 10. | Benton | 30.8% | 8.9%(+21.9)#10 | 10.0%(+20.8)#1,910 |
| 11. | Waukena | 29.6% | 8.9%(+20.7)#11 | 10.0%(+19.6)#2,146 |
| 12. | Lake Hughes | 29.6% | 8.9%(+20.7)#12 | 10.0%(+19.6)#2,154 |
| 13. | Bear Valley Cdp Alpine County | 28.3% | 8.9%(+19.4)#13 | 10.0%(+18.3)#2,481 |
| 14. | Cutler | 28.2% | 8.9%(+19.3)#14 | 10.0%(+18.3)#2,486 |
| 15. | Fulton | 28.0% | 8.9%(+19.1)#15 | 10.0%(+18.0)#2,548 |
| 16. | Oak Glen | 27.3% | 8.9%(+18.4)#16 | 10.0%(+17.3)#2,767 |
| 17. | Big Lagoon | 27.3% | 8.9%(+18.4)#17 | 10.0%(+17.3)#2,775 |
| 18. | Manchester | 27.1% | 8.9%(+18.2)#18 | 10.0%(+17.1)#2,822 |
| 19. | Fairmead | 27.0% | 8.9%(+18.1)#19 | 10.0%(+17.0)#2,845 |
| 20. | Petaluma Center | 26.9% | 8.9%(+18.0)#20 | 10.0%(+16.9)#2,873 |
| 21. | Olancha | 26.7% | 8.9%(+17.8)#21 | 10.0%(+16.8)#2,928 |
| 22. | Chilcoot Vinton | 26.3% | 8.9%(+17.4)#22 | 10.0%(+16.3)#3,038 |
| 23. | La Vina | 25.1% | 8.9%(+16.2)#23 | 10.0%(+15.1)#3,420 |
| 24. | South Dos Palos | 25.1% | 8.9%(+16.2)#24 | 10.0%(+15.1)#3,431 |
| 25. | Ono | 25.0% | 8.9%(+16.1)#25 | 10.0%(+15.0)#3,505 |
| 26. | Deer Park | 24.6% | 8.9%(+15.7)#26 | 10.0%(+14.6)#3,639 |
| 27. | Spreckels | 23.8% | 8.9%(+14.9)#27 | 10.0%(+13.8)#3,924 |
| 28. | Fuller Acres | 23.7% | 8.9%(+14.8)#28 | 10.0%(+13.7)#3,970 |
| 29. | Milpitas | 23.6% | 8.9%(+14.7)#29 | 10.0%(+13.6)#4,011 |
| 30. | St Helena | 23.5% | 8.9%(+14.6)#30 | 10.0%(+13.5)#4,040 |
| 31. | Cupertino | 23.5% | 8.9%(+14.6)#31 | 10.0%(+13.5)#4,048 |
| 32. | Moskowite Corner | 23.4% | 8.9%(+14.5)#32 | 10.0%(+13.4)#4,084 |
| 33. | Parkwood | 22.6% | 8.9%(+13.7)#33 | 10.0%(+12.6)#4,395 |
| 34. | Coronita | 22.5% | 8.9%(+13.6)#34 | 10.0%(+12.5)#4,428 |
| 35. | Tuttletown | 22.3% | 8.9%(+13.4)#35 | 10.0%(+12.3)#4,544 |
| 36. | Green Valley Cdp Los Angeles County | 22.2% | 8.9%(+13.3)#36 | 10.0%(+12.2)#4,606 |
| 37. | Searles Valley | 22.1% | 8.9%(+13.2)#37 | 10.0%(+12.1)#4,615 |
| 38. | Princeton | 21.4% | 8.9%(+12.5)#38 | 10.0%(+11.4)#4,999 |
| 39. | Bret Harte | 21.2% | 8.9%(+12.3)#39 | 10.0%(+11.2)#5,085 |
| 40. | Industry | 21.2% | 8.9%(+12.3)#40 | 10.0%(+11.2)#5,099 |
| 41. | Vallecito | 20.8% | 8.9%(+11.9)#41 | 10.0%(+10.8)#5,265 |
| 42. | Bystrom | 20.7% | 8.9%(+11.8)#42 | 10.0%(+10.7)#5,349 |
| 43. | Rouse | 20.6% | 8.9%(+11.7)#43 | 10.0%(+10.6)#5,399 |
| 44. | Winton | 20.6% | 8.9%(+11.7)#44 | 10.0%(+10.6)#5,415 |
| 45. | Cowan | 20.5% | 8.9%(+11.6)#45 | 10.0%(+10.6)#5,422 |
| 46. | Lake Almanor Country Club | 20.5% | 8.9%(+11.6)#46 | 10.0%(+10.5)#5,440 |
| 47. | Linden | 20.5% | 8.9%(+11.6)#47 | 10.0%(+10.5)#5,466 |
| 48. | Sierra Brooks | 20.5% | 8.9%(+11.6)#48 | 10.0%(+10.5)#5,474 |
| 49. | Crows Landing | 20.2% | 8.9%(+11.3)#49 | 10.0%(+10.2)#5,636 |
| 50. | Cressey | 20.2% | 8.9%(+11.3)#50 | 10.0%(+10.2)#5,649 |
| 51. | Mission Canyon | 20.1% | 8.9%(+11.2)#51 | 10.0%(+10.1)#5,682 |
| 52. | Cartago | 20.0% | 8.9%(+11.1)#52 | 10.0%(+10.0)#5,768 |
| 53. | Corning | 19.9% | 8.9%(+11.0)#53 | 10.0%(+9.93)#5,801 |
| 54. | Bonny Doon | 19.8% | 8.9%(+10.9)#54 | 10.0%(+9.80)#5,883 |
| 55. | Aptos Hills Larkin Valley | 19.5% | 8.9%(+10.6)#55 | 10.0%(+9.53)#6,033 |
| 56. | Aromas | 19.4% | 8.9%(+10.5)#56 | 10.0%(+9.40)#6,120 |
| 57. | Monmouth | 19.4% | 8.9%(+10.4)#57 | 10.0%(+9.36)#6,146 |
| 58. | Orange Blossom | 19.3% | 8.9%(+10.4)#58 | 10.0%(+9.30)#6,200 |
| 59. | French Camp | 19.2% | 8.9%(+10.3)#59 | 10.0%(+9.22)#6,272 |
| 60. | Zayante | 19.2% | 8.9%(+10.3)#60 | 10.0%(+9.17)#6,313 |
| 61. | Plainview | 19.1% | 8.9%(+10.2)#61 | 10.0%(+9.14)#6,331 |
| 62. | Knights Landing | 19.1% | 8.9%(+10.2)#62 | 10.0%(+9.07)#6,384 |
| 63. | Los Altos Hills | 18.7% | 8.9%(+9.79)#63 | 10.0%(+8.71)#6,625 |
| 64. | Buttonwillow | 18.5% | 8.9%(+9.61)#64 | 10.0%(+8.53)#6,745 |
| 65. | Keyes | 18.2% | 8.9%(+9.33)#65 | 10.0%(+8.25)#6,926 |
| 66. | Lincoln Village | 18.1% | 8.9%(+9.20)#66 | 10.0%(+8.11)#7,036 |
| 67. | Aspen Springs | 17.9% | 8.9%(+9.03)#67 | 10.0%(+7.94)#7,155 |
| 68. | Arbuckle | 17.8% | 8.9%(+8.93)#68 | 10.0%(+7.85)#7,227 |
| 69. | Livingston | 17.6% | 8.9%(+8.68)#69 | 10.0%(+7.59)#7,394 |
| 70. | Hopland | 17.6% | 8.9%(+8.67)#70 | 10.0%(+7.58)#7,400 |
| 71. | Saratoga | 17.5% | 8.9%(+8.64)#71 | 10.0%(+7.56)#7,420 |
| 72. | Fairbanks Ranch | 17.5% | 8.9%(+8.64)#72 | 10.0%(+7.56)#7,422 |
| 73. | El Centro Naval Air Facility | 17.5% | 8.9%(+8.64)#73 | 10.0%(+7.55)#7,424 |
| 74. | Sunol | 17.4% | 8.9%(+8.52)#74 | 10.0%(+7.44)#7,491 |
| 75. | Santa Susana | 17.3% | 8.9%(+8.43)#75 | 10.0%(+7.34)#7,569 |
| 76. | Silverado | 17.3% | 8.9%(+8.38)#76 | 10.0%(+7.30)#7,611 |
| 77. | Garden Grove | 17.3% | 8.9%(+8.35)#77 | 10.0%(+7.26)#7,629 |
| 78. | Newark | 17.2% | 8.9%(+8.34)#78 | 10.0%(+7.25)#7,632 |
| 79. | Delhi | 17.1% | 8.9%(+8.21)#79 | 10.0%(+7.12)#7,744 |
| 80. | Montague | 17.1% | 8.9%(+8.16)#80 | 10.0%(+7.07)#7,773 |
| 81. | Elmira | 17.0% | 8.9%(+8.12)#81 | 10.0%(+7.03)#7,801 |
| 82. | Morgan Hill | 16.9% | 8.9%(+7.95)#82 | 10.0%(+6.86)#7,902 |
| 83. | Santa Clara | 16.8% | 8.9%(+7.91)#83 | 10.0%(+6.82)#7,927 |
| 84. | Mountain Gate | 16.7% | 8.9%(+7.76)#84 | 10.0%(+6.68)#8,017 |
| 85. | San Jose | 16.6% | 8.9%(+7.66)#85 | 10.0%(+6.57)#8,153 |
| 86. | La Habra Heights | 16.5% | 8.9%(+7.62)#86 | 10.0%(+6.54)#8,181 |
| 87. | Los Altos | 16.5% | 8.9%(+7.61)#87 | 10.0%(+6.52)#8,195 |
| 88. | Stallion Springs | 16.5% | 8.9%(+7.56)#88 | 10.0%(+6.47)#8,234 |
| 89. | Goshen | 16.5% | 8.9%(+7.55)#89 | 10.0%(+6.47)#8,236 |
| 90. | Los Olivos | 16.4% | 8.9%(+7.53)#90 | 10.0%(+6.44)#8,253 |
| 91. | Newcastle | 16.2% | 8.9%(+7.30)#91 | 10.0%(+6.22)#8,438 |
| 92. | Hughson | 16.2% | 8.9%(+7.26)#92 | 10.0%(+6.18)#8,467 |
| 93. | Cold Springs Cdp El Dorado County | 16.2% | 8.9%(+7.25)#93 | 10.0%(+6.17)#8,481 |
| 94. | Buena Vista | 16.1% | 8.9%(+7.23)#94 | 10.0%(+6.15)#8,496 |
| 95. | Hilmar Irwin | 16.0% | 8.9%(+7.12)#95 | 10.0%(+6.03)#8,581 |
| 96. | Bell Gardens | 16.0% | 8.9%(+7.09)#96 | 10.0%(+6.00)#8,616 |
| 97. | South El Monte | 16.0% | 8.9%(+7.07)#97 | 10.0%(+5.99)#8,631 |
| 98. | Huntington Park | 15.9% | 8.9%(+7.02)#98 | 10.0%(+5.93)#8,675 |
| 99. | Stanton | 15.9% | 8.9%(+6.97)#99 | 10.0%(+5.88)#8,722 |
| 100. | Sunnyvale | 15.8% | 8.9%(+6.91)#100 | 10.0%(+5.82)#8,778 |
Common Questions
What are the Top 10 Cities with the Highest Percentage of Population Employed in Manufacturing in California?
Top 10 Cities with the Highest Percentage of Population Employed in Manufacturing in California are:
#1
64.8%
#2
50.0%
#3
42.9%
#4
39.8%
#5
39.3%
#6
33.9%
#7
33.1%
#8
31.2%
#9
30.8%
#10
29.6%
What city has the Highest Percentage of Population Employed in Manufacturing in California?
Nipinnawasee has the Highest Percentage of Population Employed in Manufacturing in California with 64.8%.
What is the Percentage of Population Employed in Manufacturing in the State of California?
Percentage of Population Employed in Manufacturing in California is 8.9%.
What is the Percentage of Population Employed in Manufacturing in the United States?
Percentage of Population Employed in Manufacturing in the United States is 10.0%.