Cities with the Highest Percentage of Population Employed in Transportation & Warehousing in California
RELATED REPORTS & OPTIONS
Transportation & Warehousing
California
Compare Cities
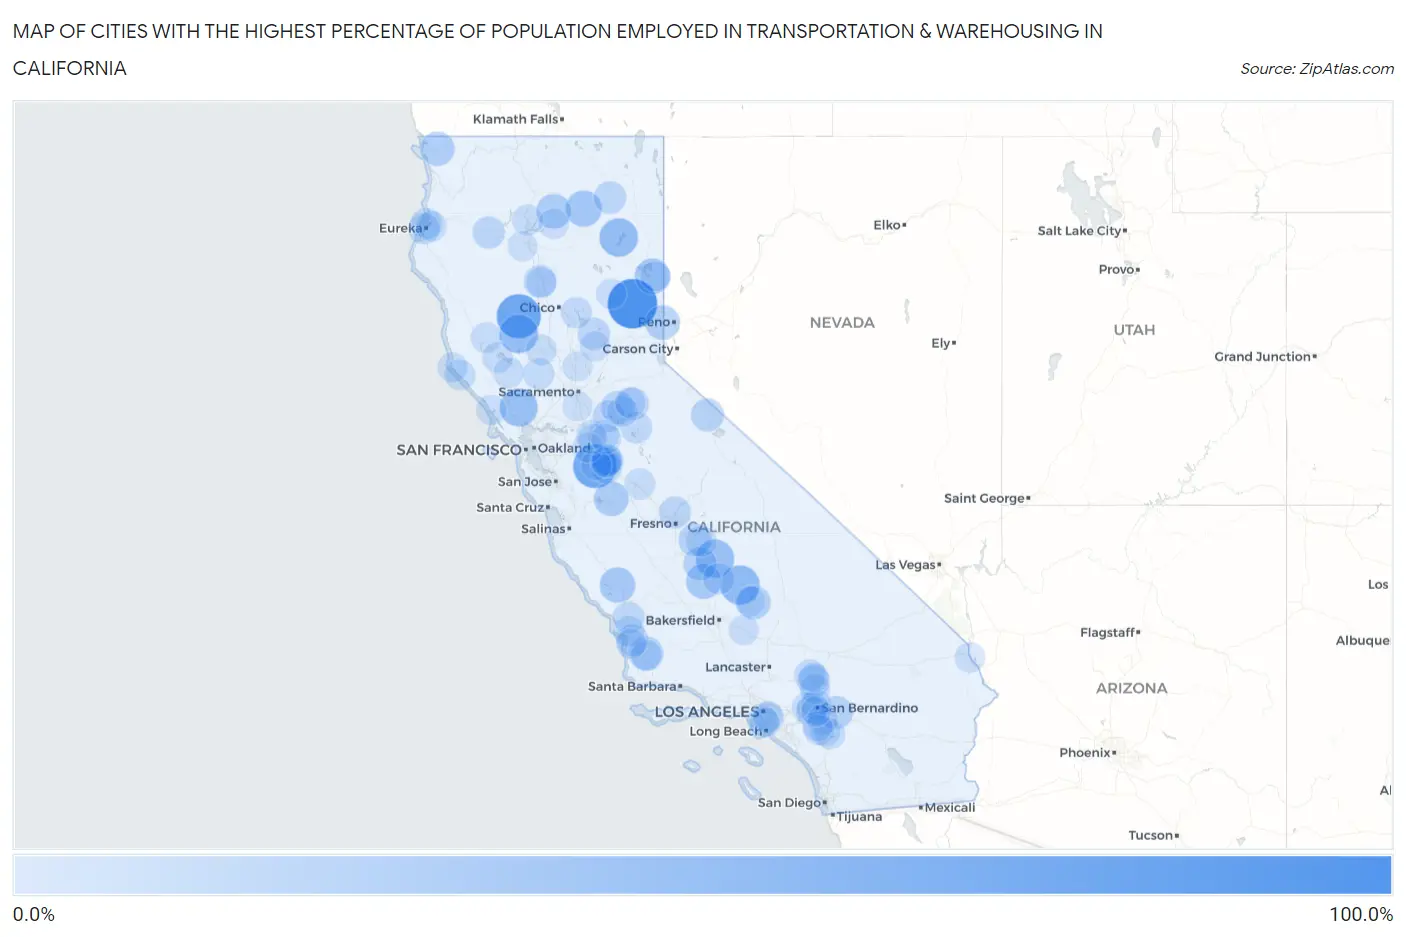
Map of Cities with the Highest Percentage of Population Employed in Transportation & Warehousing in California
0.0%
100.0%
Cities with the Highest Percentage of Population Employed in Transportation & Warehousing in California
| City | % Employed | vs State | vs National | |
| 1. | Mabie | 100.0% | 5.1%(+94.9)#1 | 4.9%(+95.1)#3 |
| 2. | Franklin Cdp Sacramento County | 100.0% | 5.1%(+94.9)#2 | 4.9%(+95.1)#22 |
| 3. | Elk Creek | 75.0% | 5.1%(+69.9)#3 | 4.9%(+70.1)#41 |
| 4. | Westley | 72.8% | 5.1%(+67.7)#4 | 4.9%(+67.9)#45 |
| 5. | Pine Flat | 52.5% | 5.1%(+47.4)#5 | 4.9%(+47.6)#104 |
| 6. | Stonyford | 50.0% | 5.1%(+44.9)#6 | 4.9%(+45.1)#116 |
| 7. | Spaulding | 49.1% | 5.1%(+44.0)#7 | 4.9%(+44.1)#131 |
| 8. | Tonyville | 47.8% | 5.1%(+42.6)#8 | 4.9%(+42.8)#140 |
| 9. | Glen Ellen | 46.1% | 5.1%(+41.0)#9 | 4.9%(+41.2)#157 |
| 10. | Bear Valley Cdp Mariposa County | 44.3% | 5.1%(+39.1)#10 | 4.9%(+39.3)#165 |
| 11. | Mcarthur | 38.7% | 5.1%(+33.5)#11 | 4.9%(+33.7)#202 |
| 12. | Patton Village | 36.1% | 5.1%(+30.9)#12 | 4.9%(+31.1)#241 |
| 13. | Bradley | 35.7% | 5.1%(+30.6)#13 | 4.9%(+30.8)#250 |
| 14. | Teviston | 34.6% | 5.1%(+29.4)#14 | 4.9%(+29.6)#269 |
| 15. | Volta | 32.4% | 5.1%(+27.3)#15 | 4.9%(+27.5)#325 |
| 16. | Big Bend | 31.8% | 5.1%(+26.7)#16 | 4.9%(+26.9)#334 |
| 17. | Verdi | 31.5% | 5.1%(+26.4)#17 | 4.9%(+26.5)#338 |
| 18. | Garey | 30.4% | 5.1%(+25.3)#18 | 4.9%(+25.5)#354 |
| 19. | Gasquet | 29.6% | 5.1%(+24.5)#19 | 4.9%(+24.7)#376 |
| 20. | Squirrel Mountain Valley | 28.4% | 5.1%(+23.3)#20 | 4.9%(+23.5)#412 |
| 21. | Matheny | 25.9% | 5.1%(+20.7)#21 | 4.9%(+20.9)#502 |
| 22. | Oak Glen | 25.5% | 5.1%(+20.3)#22 | 4.9%(+20.5)#518 |
| 23. | Delft Colony | 24.3% | 5.1%(+19.2)#23 | 4.9%(+19.4)#569 |
| 24. | Bridgeport | 24.3% | 5.1%(+19.2)#24 | 4.9%(+19.4)#571 |
| 25. | Martell | 24.1% | 5.1%(+19.0)#25 | 4.9%(+19.2)#581 |
| 26. | West Point | 23.2% | 5.1%(+18.0)#26 | 4.9%(+18.2)#621 |
| 27. | Proberta | 22.8% | 5.1%(+17.7)#27 | 4.9%(+17.8)#645 |
| 28. | Adin | 22.0% | 5.1%(+16.9)#28 | 4.9%(+17.1)#687 |
| 29. | Mountain View Acres | 21.4% | 5.1%(+16.3)#29 | 4.9%(+16.5)#730 |
| 30. | Junction City | 21.4% | 5.1%(+16.3)#30 | 4.9%(+16.5)#731 |
| 31. | Dobbins | 21.1% | 5.1%(+16.0)#31 | 4.9%(+16.2)#748 |
| 32. | Parklawn | 21.0% | 5.1%(+15.9)#32 | 4.9%(+16.1)#758 |
| 33. | Camanche North Shore | 20.3% | 5.1%(+15.2)#33 | 4.9%(+15.4)#811 |
| 34. | Rolling Hills | 19.9% | 5.1%(+14.8)#34 | 4.9%(+15.0)#841 |
| 35. | Garden Farms | 19.4% | 5.1%(+14.3)#35 | 4.9%(+14.5)#874 |
| 36. | Los Berros | 19.0% | 5.1%(+13.9)#36 | 4.9%(+14.1)#902 |
| 37. | Monterey Park Tract | 19.0% | 5.1%(+13.9)#37 | 4.9%(+14.1)#903 |
| 38. | Di Giorgio | 18.8% | 5.1%(+13.6)#38 | 4.9%(+13.8)#931 |
| 39. | Vallecito | 18.8% | 5.1%(+13.6)#39 | 4.9%(+13.8)#932 |
| 40. | Terra Bella | 17.9% | 5.1%(+12.8)#40 | 4.9%(+13.0)#1,035 |
| 41. | Fairhaven | 17.6% | 5.1%(+12.5)#41 | 4.9%(+12.7)#1,074 |
| 42. | Manila | 17.6% | 5.1%(+12.4)#42 | 4.9%(+12.6)#1,079 |
| 43. | Adelanto | 17.1% | 5.1%(+11.9)#43 | 4.9%(+12.1)#1,151 |
| 44. | Cherokee | 16.9% | 5.1%(+11.8)#44 | 4.9%(+12.0)#1,167 |
| 45. | Edna | 16.9% | 5.1%(+11.7)#45 | 4.9%(+11.9)#1,191 |
| 46. | Weitchpec | 16.7% | 5.1%(+11.5)#46 | 4.9%(+11.7)#1,229 |
| 47. | Guinda | 16.0% | 5.1%(+10.9)#47 | 4.9%(+11.1)#1,334 |
| 48. | Monson | 15.9% | 5.1%(+10.7)#48 | 4.9%(+10.9)#1,353 |
| 49. | Anchor Bay | 15.8% | 5.1%(+10.7)#49 | 4.9%(+10.9)#1,360 |
| 50. | Fontana | 15.7% | 5.1%(+10.6)#50 | 4.9%(+10.7)#1,390 |
| 51. | Rouse | 15.4% | 5.1%(+10.3)#51 | 4.9%(+10.5)#1,440 |
| 52. | Yermo | 15.4% | 5.1%(+10.3)#52 | 4.9%(+10.4)#1,446 |
| 53. | Potter Valley | 15.4% | 5.1%(+10.3)#53 | 4.9%(+10.4)#1,448 |
| 54. | Bear Creek | 15.3% | 5.1%(+10.1)#54 | 4.9%(+10.3)#1,481 |
| 55. | Lakehead | 15.1% | 5.1%(+10.0)#55 | 4.9%(+10.2)#1,512 |
| 56. | Rialto | 15.0% | 5.1%(+9.83)#56 | 4.9%(+10.0)#1,546 |
| 57. | Indianola | 14.9% | 5.1%(+9.78)#57 | 4.9%(+9.96)#1,557 |
| 58. | Lakeport | 14.8% | 5.1%(+9.69)#58 | 4.9%(+9.87)#1,577 |
| 59. | Peters | 14.8% | 5.1%(+9.62)#59 | 4.9%(+9.81)#1,597 |
| 60. | West Rancho Dominguez | 14.7% | 5.1%(+9.62)#60 | 4.9%(+9.80)#1,600 |
| 61. | Mokelumne Hill | 14.7% | 5.1%(+9.56)#61 | 4.9%(+9.74)#1,610 |
| 62. | Williams | 14.6% | 5.1%(+9.44)#62 | 4.9%(+9.62)#1,645 |
| 63. | Bloomington | 14.6% | 5.1%(+9.43)#63 | 4.9%(+9.62)#1,646 |
| 64. | San Bernardino | 14.5% | 5.1%(+9.37)#64 | 4.9%(+9.55)#1,656 |
| 65. | Airport | 14.5% | 5.1%(+9.32)#65 | 4.9%(+9.51)#1,669 |
| 66. | Winchester | 14.3% | 5.1%(+9.17)#66 | 4.9%(+9.35)#1,698 |
| 67. | Cobb | 14.2% | 5.1%(+9.11)#67 | 4.9%(+9.29)#1,745 |
| 68. | Romoland | 14.0% | 5.1%(+8.83)#68 | 4.9%(+9.01)#1,803 |
| 69. | Gerber | 13.9% | 5.1%(+8.73)#69 | 4.9%(+8.92)#1,829 |
| 70. | Pioneer | 13.8% | 5.1%(+8.64)#70 | 4.9%(+8.82)#1,858 |
| 71. | East Quincy | 13.7% | 5.1%(+8.57)#71 | 4.9%(+8.76)#1,872 |
| 72. | Montgomery Creek | 13.6% | 5.1%(+8.51)#72 | 4.9%(+8.69)#1,893 |
| 73. | Hesperia | 13.6% | 5.1%(+8.48)#73 | 4.9%(+8.67)#1,904 |
| 74. | August | 13.4% | 5.1%(+8.23)#74 | 4.9%(+8.42)#1,958 |
| 75. | Needles | 13.2% | 5.1%(+8.06)#75 | 4.9%(+8.24)#2,020 |
| 76. | Moreno Valley | 13.0% | 5.1%(+7.91)#76 | 4.9%(+8.09)#2,075 |
| 77. | Bell Gardens | 13.0% | 5.1%(+7.83)#77 | 4.9%(+8.02)#2,100 |
| 78. | Bret Harte | 13.0% | 5.1%(+7.83)#78 | 4.9%(+8.01)#2,101 |
| 79. | Penn Valley | 12.9% | 5.1%(+7.82)#79 | 4.9%(+8.00)#2,104 |
| 80. | Bell | 12.9% | 5.1%(+7.80)#80 | 4.9%(+7.98)#2,108 |
| 81. | Bodega Bay | 12.9% | 5.1%(+7.76)#81 | 4.9%(+7.95)#2,124 |
| 82. | Point Arena | 12.8% | 5.1%(+7.69)#82 | 4.9%(+7.87)#2,137 |
| 83. | Lake Isabella | 12.8% | 5.1%(+7.67)#83 | 4.9%(+7.85)#2,154 |
| 84. | Sisquoc | 12.7% | 5.1%(+7.60)#84 | 4.9%(+7.78)#2,176 |
| 85. | Grayson | 12.6% | 5.1%(+7.50)#85 | 4.9%(+7.68)#2,207 |
| 86. | Good Hope | 12.6% | 5.1%(+7.50)#86 | 4.9%(+7.68)#2,208 |
| 87. | Herlong | 12.6% | 5.1%(+7.49)#87 | 4.9%(+7.68)#2,211 |
| 88. | Keene | 12.6% | 5.1%(+7.43)#88 | 4.9%(+7.62)#2,230 |
| 89. | Trowbridge | 12.5% | 5.1%(+7.37)#89 | 4.9%(+7.55)#2,253 |
| 90. | Kennedy | 12.4% | 5.1%(+7.32)#90 | 4.9%(+7.50)#2,291 |
| 91. | Edison | 12.4% | 5.1%(+7.31)#91 | 4.9%(+7.50)#2,294 |
| 92. | Mead Valley | 12.4% | 5.1%(+7.24)#92 | 4.9%(+7.42)#2,316 |
| 93. | Hood | 12.2% | 5.1%(+7.08)#93 | 4.9%(+7.27)#2,387 |
| 94. | Compton | 12.2% | 5.1%(+7.06)#94 | 4.9%(+7.24)#2,397 |
| 95. | Lathrop | 11.9% | 5.1%(+6.82)#95 | 4.9%(+7.00)#2,487 |
| 96. | Centerville | 11.9% | 5.1%(+6.81)#96 | 4.9%(+6.99)#2,492 |
| 97. | Victorville | 11.9% | 5.1%(+6.77)#97 | 4.9%(+6.95)#2,505 |
| 98. | Farmington | 11.8% | 5.1%(+6.71)#98 | 4.9%(+6.90)#2,521 |
| 99. | Woodlands | 11.8% | 5.1%(+6.67)#99 | 4.9%(+6.85)#2,544 |
| 100. | Colton | 11.8% | 5.1%(+6.63)#100 | 4.9%(+6.82)#2,550 |
Common Questions
What are the Top 10 Cities with the Highest Percentage of Population Employed in Transportation & Warehousing in California?
Top 10 Cities with the Highest Percentage of Population Employed in Transportation & Warehousing in California are:
#1
100.0%
#2
75.0%
#3
72.8%
#4
52.5%
#5
50.0%
#6
49.1%
#7
47.8%
#8
46.1%
#9
38.7%
#10
36.1%
What city has the Highest Percentage of Population Employed in Transportation & Warehousing in California?
Mabie has the Highest Percentage of Population Employed in Transportation & Warehousing in California with 100.0%.
What is the Percentage of Population Employed in Transportation & Warehousing in the State of California?
Percentage of Population Employed in Transportation & Warehousing in California is 5.1%.
What is the Percentage of Population Employed in Transportation & Warehousing in the United States?
Percentage of Population Employed in Transportation & Warehousing in the United States is 4.9%.