Cities with the Largest Korean Community in California
RELATED REPORTS & OPTIONS
Korean
California
Compare Cities
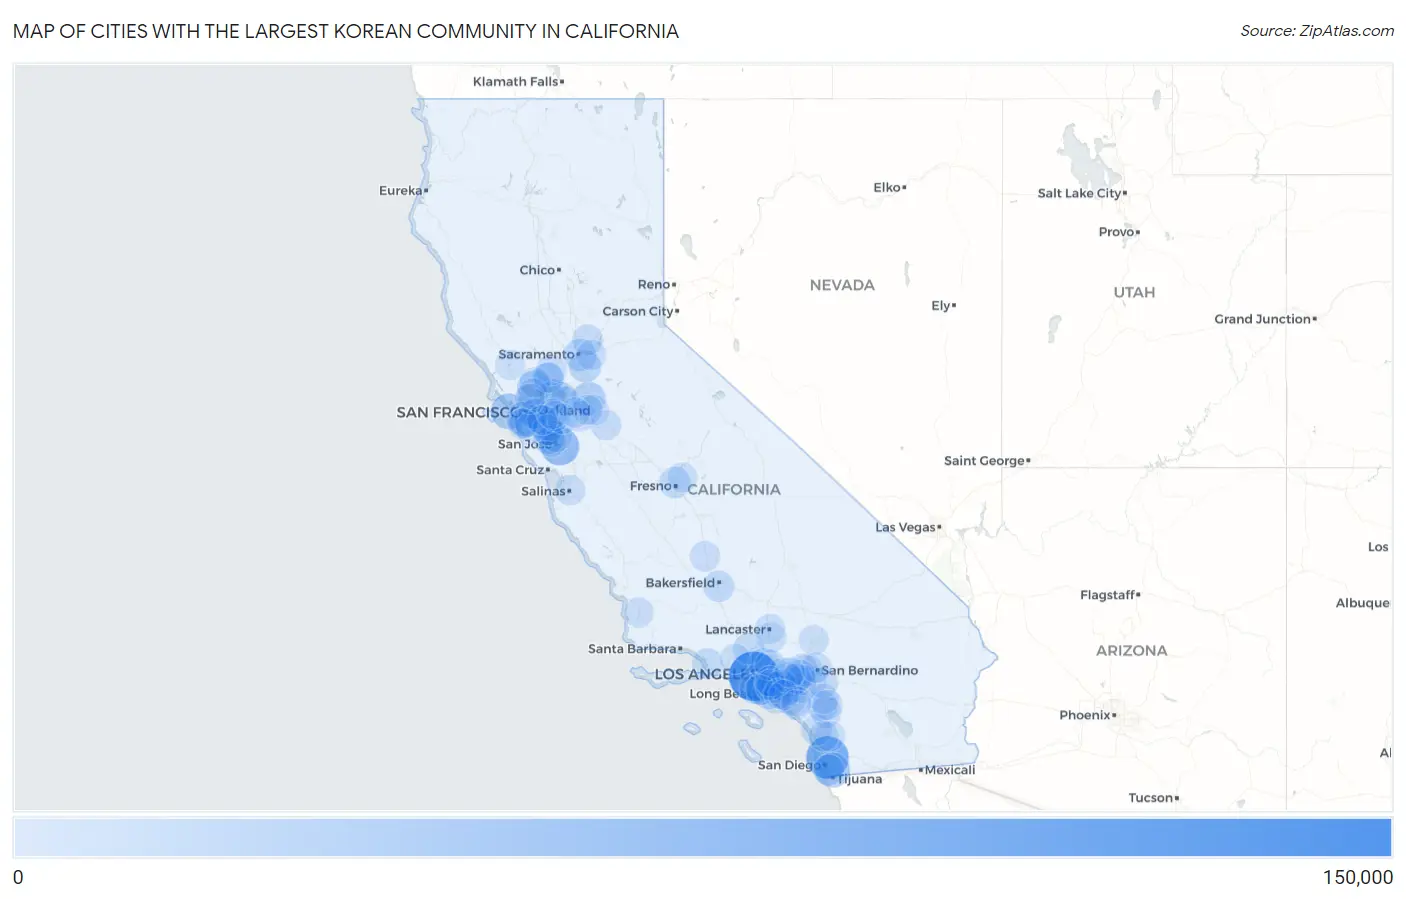
Map of Cities with the Largest Korean Community in California
0
150,000
Cities with the Largest Korean Community in California
| City | Korean | vs State | vs National | |
| 1. | Los Angeles | 148,245 | 1,688,500(8.78%)#1 | 4,337,256(3.42%)#1 |
| 2. | San Diego | 94,136 | 1,688,500(5.58%)#2 | 4,337,256(2.17%)#3 |
| 3. | San Jose | 63,825 | 1,688,500(3.78%)#3 | 4,337,256(1.47%)#5 |
| 4. | San Francisco | 43,531 | 1,688,500(2.58%)#4 | 4,337,256(1.00%)#6 |
| 5. | Chula Vista | 38,739 | 1,688,500(2.29%)#5 | 4,337,256(0.89%)#8 |
| 6. | Daly City | 33,845 | 1,688,500(2.00%)#6 | 4,337,256(0.78%)#10 |
| 7. | Stockton | 30,265 | 1,688,500(1.79%)#7 | 4,337,256(0.70%)#12 |
| 8. | Vallejo | 27,240 | 1,688,500(1.61%)#8 | 4,337,256(0.63%)#13 |
| 9. | Long Beach | 26,313 | 1,688,500(1.56%)#9 | 4,337,256(0.61%)#15 |
| 10. | Hayward | 21,703 | 1,688,500(1.29%)#10 | 4,337,256(0.50%)#19 |
| 11. | Carson | 21,654 | 1,688,500(1.28%)#11 | 4,337,256(0.50%)#20 |
| 12. | Sacramento | 20,715 | 1,688,500(1.23%)#12 | 4,337,256(0.48%)#21 |
| 13. | Elk Grove | 19,597 | 1,688,500(1.16%)#13 | 4,337,256(0.45%)#23 |
| 14. | Anaheim | 17,611 | 1,688,500(1.04%)#14 | 4,337,256(0.41%)#27 |
| 15. | Fremont | 16,620 | 1,688,500(0.98%)#15 | 4,337,256(0.38%)#30 |
| 16. | Fairfield | 16,599 | 1,688,500(0.98%)#16 | 4,337,256(0.38%)#31 |
| 17. | South San Francisco | 15,104 | 1,688,500(0.89%)#17 | 4,337,256(0.35%)#34 |
| 18. | Union City | 13,656 | 1,688,500(0.81%)#18 | 4,337,256(0.31%)#37 |
| 19. | Santa Clarita | 13,466 | 1,688,500(0.80%)#19 | 4,337,256(0.31%)#38 |
| 20. | Fresno | 12,595 | 1,688,500(0.75%)#20 | 4,337,256(0.29%)#41 |
| 21. | Bakersfield | 12,544 | 1,688,500(0.74%)#21 | 4,337,256(0.29%)#42 |
| 22. | Irvine | 12,193 | 1,688,500(0.72%)#22 | 4,337,256(0.28%)#43 |
| 23. | Glendale | 12,033 | 1,688,500(0.71%)#23 | 4,337,256(0.28%)#44 |
| 24. | Milpitas | 11,460 | 1,688,500(0.68%)#24 | 4,337,256(0.26%)#45 |
| 25. | Oakland | 10,909 | 1,688,500(0.65%)#25 | 4,337,256(0.25%)#47 |
| 26. | Oxnard | 10,896 | 1,688,500(0.65%)#26 | 4,337,256(0.25%)#48 |
| 27. | Pittsburg | 10,816 | 1,688,500(0.64%)#27 | 4,337,256(0.25%)#49 |
| 28. | San Leandro | 10,347 | 1,688,500(0.61%)#28 | 4,337,256(0.24%)#52 |
| 29. | Concord | 10,037 | 1,688,500(0.59%)#29 | 4,337,256(0.23%)#53 |
| 30. | West Covina | 9,884 | 1,688,500(0.59%)#30 | 4,337,256(0.23%)#54 |
| 31. | National City | 9,708 | 1,688,500(0.57%)#31 | 4,337,256(0.22%)#55 |
| 32. | Roseville | 9,523 | 1,688,500(0.56%)#32 | 4,337,256(0.22%)#56 |
| 33. | Antioch | 9,424 | 1,688,500(0.56%)#33 | 4,337,256(0.22%)#57 |
| 34. | Oceanside | 8,985 | 1,688,500(0.53%)#34 | 4,337,256(0.21%)#60 |
| 35. | Temecula | 8,969 | 1,688,500(0.53%)#35 | 4,337,256(0.21%)#61 |
| 36. | Lakewood | 8,856 | 1,688,500(0.52%)#36 | 4,337,256(0.20%)#63 |
| 37. | Cerritos | 8,537 | 1,688,500(0.51%)#37 | 4,337,256(0.20%)#65 |
| 38. | Sunnyvale | 8,518 | 1,688,500(0.50%)#38 | 4,337,256(0.20%)#66 |
| 39. | Torrance | 8,515 | 1,688,500(0.50%)#39 | 4,337,256(0.20%)#67 |
| 40. | Buena Park | 8,354 | 1,688,500(0.49%)#40 | 4,337,256(0.19%)#68 |
| 41. | Riverside | 8,232 | 1,688,500(0.49%)#41 | 4,337,256(0.19%)#71 |
| 42. | Santa Clara | 8,141 | 1,688,500(0.48%)#42 | 4,337,256(0.19%)#72 |
| 43. | Fontana | 7,603 | 1,688,500(0.45%)#43 | 4,337,256(0.18%)#74 |
| 44. | Tracy | 7,595 | 1,688,500(0.45%)#44 | 4,337,256(0.18%)#75 |
| 45. | Norwalk | 7,319 | 1,688,500(0.43%)#45 | 4,337,256(0.17%)#78 |
| 46. | Vacaville | 7,194 | 1,688,500(0.43%)#46 | 4,337,256(0.17%)#81 |
| 47. | Salinas | 6,935 | 1,688,500(0.41%)#47 | 4,337,256(0.16%)#82 |
| 48. | Chino Hills | 6,909 | 1,688,500(0.41%)#48 | 4,337,256(0.16%)#83 |
| 49. | American Canyon | 6,869 | 1,688,500(0.41%)#49 | 4,337,256(0.16%)#84 |
| 50. | Rancho Cucamonga | 6,602 | 1,688,500(0.39%)#50 | 4,337,256(0.15%)#89 |
| 51. | Murrieta | 6,560 | 1,688,500(0.39%)#51 | 4,337,256(0.15%)#90 |
| 52. | Alameda | 6,479 | 1,688,500(0.38%)#52 | 4,337,256(0.15%)#91 |
| 53. | Pasadena | 6,431 | 1,688,500(0.38%)#53 | 4,337,256(0.15%)#92 |
| 54. | Delano | 6,384 | 1,688,500(0.38%)#54 | 4,337,256(0.15%)#93 |
| 55. | Corona | 6,280 | 1,688,500(0.37%)#55 | 4,337,256(0.14%)#94 |
| 56. | San Mateo | 6,208 | 1,688,500(0.37%)#56 | 4,337,256(0.14%)#95 |
| 57. | Orange | 6,207 | 1,688,500(0.37%)#57 | 4,337,256(0.14%)#96 |
| 58. | Moreno Valley | 6,169 | 1,688,500(0.37%)#58 | 4,337,256(0.14%)#97 |
| 59. | Eastvale | 6,115 | 1,688,500(0.36%)#59 | 4,337,256(0.14%)#98 |
| 60. | Ontario | 5,836 | 1,688,500(0.35%)#60 | 4,337,256(0.13%)#103 |
| 61. | Fullerton | 5,743 | 1,688,500(0.34%)#61 | 4,337,256(0.13%)#105 |
| 62. | Manteca | 5,710 | 1,688,500(0.34%)#62 | 4,337,256(0.13%)#107 |
| 63. | Modesto | 5,621 | 1,688,500(0.33%)#63 | 4,337,256(0.13%)#108 |
| 64. | San Bruno | 5,619 | 1,688,500(0.33%)#64 | 4,337,256(0.13%)#109 |
| 65. | Huntington Beach | 5,462 | 1,688,500(0.32%)#65 | 4,337,256(0.13%)#113 |
| 66. | Hercules | 5,389 | 1,688,500(0.32%)#66 | 4,337,256(0.12%)#114 |
| 67. | Escondido | 5,385 | 1,688,500(0.32%)#67 | 4,337,256(0.12%)#115 |
| 68. | Newark | 5,358 | 1,688,500(0.32%)#68 | 4,337,256(0.12%)#116 |
| 69. | Richmond | 5,312 | 1,688,500(0.31%)#69 | 4,337,256(0.12%)#120 |
| 70. | Bellflower | 5,072 | 1,688,500(0.30%)#70 | 4,337,256(0.12%)#125 |
| 71. | Brentwood | 5,017 | 1,688,500(0.30%)#71 | 4,337,256(0.12%)#126 |
| 72. | Chino | 4,937 | 1,688,500(0.29%)#72 | 4,337,256(0.11%)#129 |
| 73. | San Marcos | 4,889 | 1,688,500(0.29%)#73 | 4,337,256(0.11%)#131 |
| 74. | Rancho Cordova | 4,873 | 1,688,500(0.29%)#74 | 4,337,256(0.11%)#132 |
| 75. | Victorville | 4,841 | 1,688,500(0.29%)#75 | 4,337,256(0.11%)#133 |
| 76. | Suisun City | 4,801 | 1,688,500(0.28%)#76 | 4,337,256(0.11%)#134 |
| 77. | Dublin | 4,774 | 1,688,500(0.28%)#77 | 4,337,256(0.11%)#135 |
| 78. | Livermore | 4,756 | 1,688,500(0.28%)#78 | 4,337,256(0.11%)#137 |
| 79. | Palmdale | 4,674 | 1,688,500(0.28%)#79 | 4,337,256(0.11%)#139 |
| 80. | San Bernardino | 4,649 | 1,688,500(0.28%)#80 | 4,337,256(0.11%)#141 |
| 81. | Santa Maria | 4,590 | 1,688,500(0.27%)#81 | 4,337,256(0.11%)#142 |
| 82. | San Ramon | 4,556 | 1,688,500(0.27%)#82 | 4,337,256(0.11%)#143 |
| 83. | West Carson | 4,468 | 1,688,500(0.26%)#83 | 4,337,256(0.10%)#144 |
| 84. | Lancaster | 4,466 | 1,688,500(0.26%)#84 | 4,337,256(0.10%)#145 |
| 85. | Menifee | 4,455 | 1,688,500(0.26%)#85 | 4,337,256(0.10%)#147 |
| 86. | French Valley | 4,405 | 1,688,500(0.26%)#86 | 4,337,256(0.10%)#148 |
| 87. | Diamond Bar | 4,394 | 1,688,500(0.26%)#87 | 4,337,256(0.10%)#149 |
| 88. | Simi Valley | 4,280 | 1,688,500(0.25%)#88 | 4,337,256(0.10%)#155 |
| 89. | Downey | 4,208 | 1,688,500(0.25%)#89 | 4,337,256(0.10%)#158 |
| 90. | Lake Forest | 4,206 | 1,688,500(0.25%)#90 | 4,337,256(0.10%)#159 |
| 91. | Garden Grove | 4,174 | 1,688,500(0.25%)#91 | 4,337,256(0.10%)#160 |
| 92. | Santa Rosa | 4,041 | 1,688,500(0.24%)#92 | 4,337,256(0.09%)#162 |
| 93. | San Lorenzo | 4,025 | 1,688,500(0.24%)#93 | 4,337,256(0.09%)#164 |
| 94. | Pacifica | 3,965 | 1,688,500(0.23%)#94 | 4,337,256(0.09%)#167 |
| 95. | Lathrop | 3,956 | 1,688,500(0.23%)#95 | 4,337,256(0.09%)#169 |
| 96. | Pomona | 3,911 | 1,688,500(0.23%)#96 | 4,337,256(0.09%)#170 |
| 97. | Mountain House | 3,806 | 1,688,500(0.23%)#97 | 4,337,256(0.09%)#172 |
| 98. | Santa Ana | 3,786 | 1,688,500(0.22%)#98 | 4,337,256(0.09%)#173 |
| 99. | Clovis | 3,706 | 1,688,500(0.22%)#99 | 4,337,256(0.09%)#175 |
| 100. | Mission Viejo | 3,673 | 1,688,500(0.22%)#100 | 4,337,256(0.08%)#177 |
Common Questions
What are the Top 10 Cities with the Largest Korean Community in California?
Top 10 Cities with the Largest Korean Community in California are:
#1
148,245
#2
94,136
#3
63,825
#4
43,531
#5
38,739
#6
33,845
#7
30,265
#8
27,240
#9
26,313
#10
21,703
What city has the Largest Korean Community in California?
Los Angeles has the Largest Korean Community in California with 148,245.
What is the Total Korean Population in the State of California?
Total Korean Population in California is 1,688,500.
What is the Total Korean Population in the United States?
Total Korean Population in the United States is 4,337,256.