Dorrington, CA Map & Demographics
Dorrington Map
Dorrington Overview
$61,887
PER CAPITA INCOME
$162,500
AVG FAMILY INCOME
$128,304
AVG HOUSEHOLD INCOME
0.37
INEQUALITY / GINI INDEX
498
TOTAL POPULATION
247
MALE POPULATION
251
FEMALE POPULATION
98.41
MALES / 100 FEMALES
101.62
FEMALES / 100 MALES
64.5
MEDIAN AGE
2.5
AVG FAMILY SIZE
2.0
AVG HOUSEHOLD SIZE
170
LABOR FORCE [ PEOPLE ]
36.8%
PERCENT IN LABOR FORCE
4.1%
UNEMPLOYMENT RATE
Income in Dorrington
Income Overview in Dorrington
Per Capita Income in Dorrington is $61,887, while median incomes of families and households are $162,500 and $128,304 respectively.
| Characteristic | Number | Measure |
| Per Capita Income | 498 | $61,887 |
| Median Family Income | 160 | $162,500 |
| Mean Family Income | 160 | $150,722 |
| Median Household Income | 247 | $128,304 |
| Mean Household Income | 247 | $118,593 |
| Income Deficit | 160 | $0 |
| Wage / Income Gap (%) | 498 | 0.00% |
| Wage / Income Gap ($) | 498 | 100.00¢ per $1 |
| Gini / Inequality Index | 498 | 0.37 |
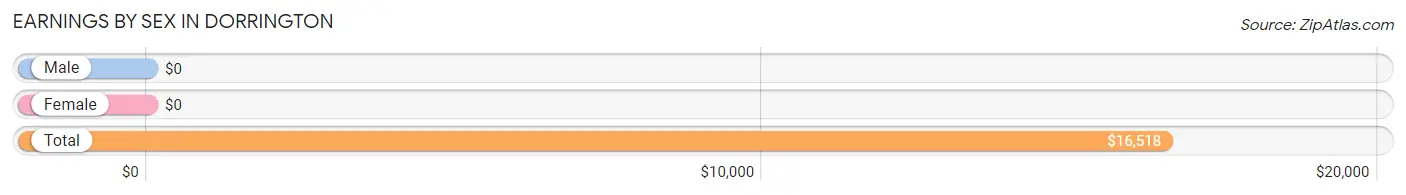
Earnings by Sex in Dorrington
| Sex | Number | Average Earnings |
| Male | 122 (59.5%) | $0 |
| Female | 83 (40.5%) | $0 |
| Total | 205 (100.0%) | $16,518 |
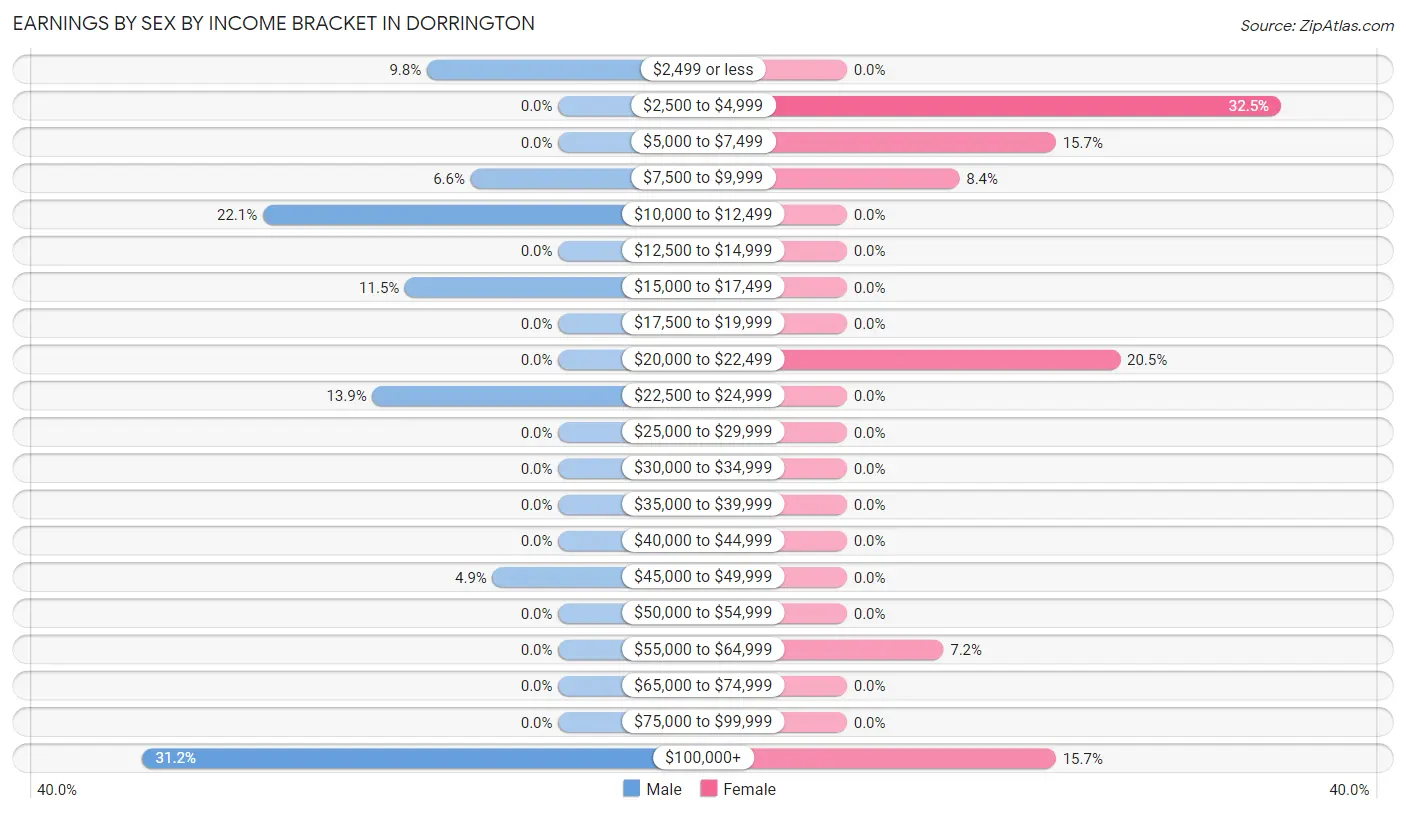
Earnings by Sex by Income Bracket in Dorrington
The most common earnings brackets in Dorrington are $100,000+ for men (38 | 31.1%) and $2,500 to $4,999 for women (27 | 32.5%).
| Income | Male | Female |
| $2,499 or less | 12 (9.8%) | 0 (0.0%) |
| $2,500 to $4,999 | 0 (0.0%) | 27 (32.5%) |
| $5,000 to $7,499 | 0 (0.0%) | 13 (15.7%) |
| $7,500 to $9,999 | 8 (6.6%) | 7 (8.4%) |
| $10,000 to $12,499 | 27 (22.1%) | 0 (0.0%) |
| $12,500 to $14,999 | 0 (0.0%) | 0 (0.0%) |
| $15,000 to $17,499 | 14 (11.5%) | 0 (0.0%) |
| $17,500 to $19,999 | 0 (0.0%) | 0 (0.0%) |
| $20,000 to $22,499 | 0 (0.0%) | 17 (20.5%) |
| $22,500 to $24,999 | 17 (13.9%) | 0 (0.0%) |
| $25,000 to $29,999 | 0 (0.0%) | 0 (0.0%) |
| $30,000 to $34,999 | 0 (0.0%) | 0 (0.0%) |
| $35,000 to $39,999 | 0 (0.0%) | 0 (0.0%) |
| $40,000 to $44,999 | 0 (0.0%) | 0 (0.0%) |
| $45,000 to $49,999 | 6 (4.9%) | 0 (0.0%) |
| $50,000 to $54,999 | 0 (0.0%) | 0 (0.0%) |
| $55,000 to $64,999 | 0 (0.0%) | 6 (7.2%) |
| $65,000 to $74,999 | 0 (0.0%) | 0 (0.0%) |
| $75,000 to $99,999 | 0 (0.0%) | 0 (0.0%) |
| $100,000+ | 38 (31.1%) | 13 (15.7%) |
| Total | 122 (100.0%) | 83 (100.0%) |
Earnings by Sex by Educational Attainment in Dorrington
| Educational Attainment | Male Income | Female Income |
| Less than High School | - | - |
| High School Diploma | - | - |
| College or Associate's Degree | - | - |
| Bachelor's Degree | - | - |
| Graduate Degree | - | - |
| Total | - | - |
Family Income in Dorrington
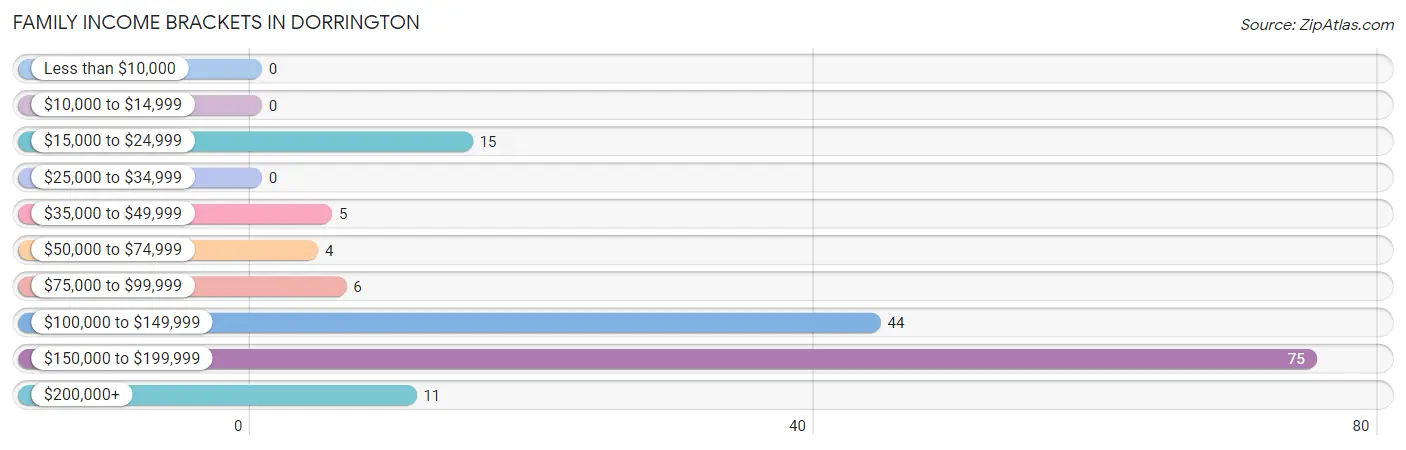
Family Income Brackets in Dorrington
According to the Dorrington family income data, there are 75 families falling into the $150,000 to $199,999 income range, which is the most common income bracket and makes up 46.9% of all families.
| Income Bracket | # Families | % Families |
| Less than $10,000 | 0 | 0.0% |
| $10,000 to $14,999 | 0 | 0.0% |
| $15,000 to $24,999 | 15 | 9.4% |
| $25,000 to $34,999 | 0 | 0.0% |
| $35,000 to $49,999 | 5 | 3.1% |
| $50,000 to $74,999 | 4 | 2.5% |
| $75,000 to $99,999 | 6 | 3.8% |
| $100,000 to $149,999 | 44 | 27.5% |
| $150,000 to $199,999 | 75 | 46.9% |
| $200,000+ | 11 | 6.9% |
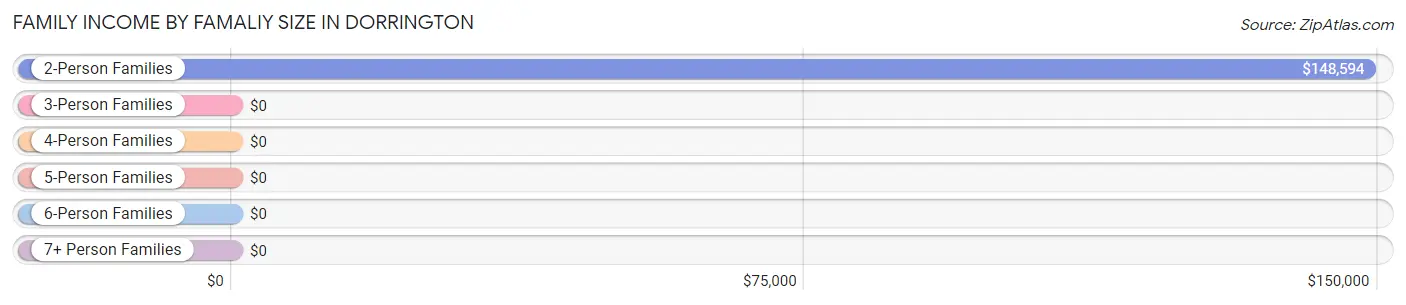
Family Income by Famaliy Size in Dorrington
2-person families (127 | 79.4%) account for the highest median family income in Dorrington with $148,594 per family, while 2-person families (127 | 79.4%) have the highest median income of $74,297 per family member.
| Income Bracket | # Families | Median Income |
| 2-Person Families | 127 (79.4%) | $148,594 |
| 3-Person Families | 22 (13.8%) | $0 |
| 4-Person Families | 11 (6.9%) | $0 |
| 5-Person Families | 0 (0.0%) | $0 |
| 6-Person Families | 0 (0.0%) | $0 |
| 7+ Person Families | 0 (0.0%) | $0 |
| Total | 160 (100.0%) | $162,500 |
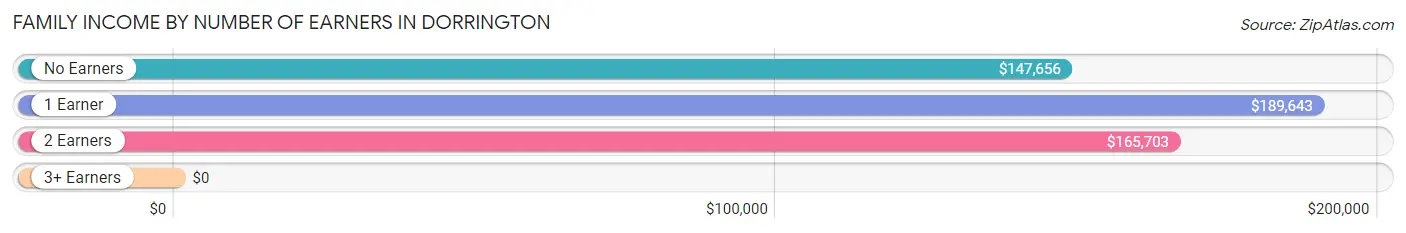
Family Income by Number of Earners in Dorrington
| Number of Earners | # Families | Median Income |
| No Earners | 81 (50.6%) | $147,656 |
| 1 Earner | 24 (15.0%) | $189,643 |
| 2 Earners | 49 (30.6%) | $165,703 |
| 3+ Earners | 6 (3.7%) | $0 |
| Total | 160 (100.0%) | $162,500 |
Household Income in Dorrington
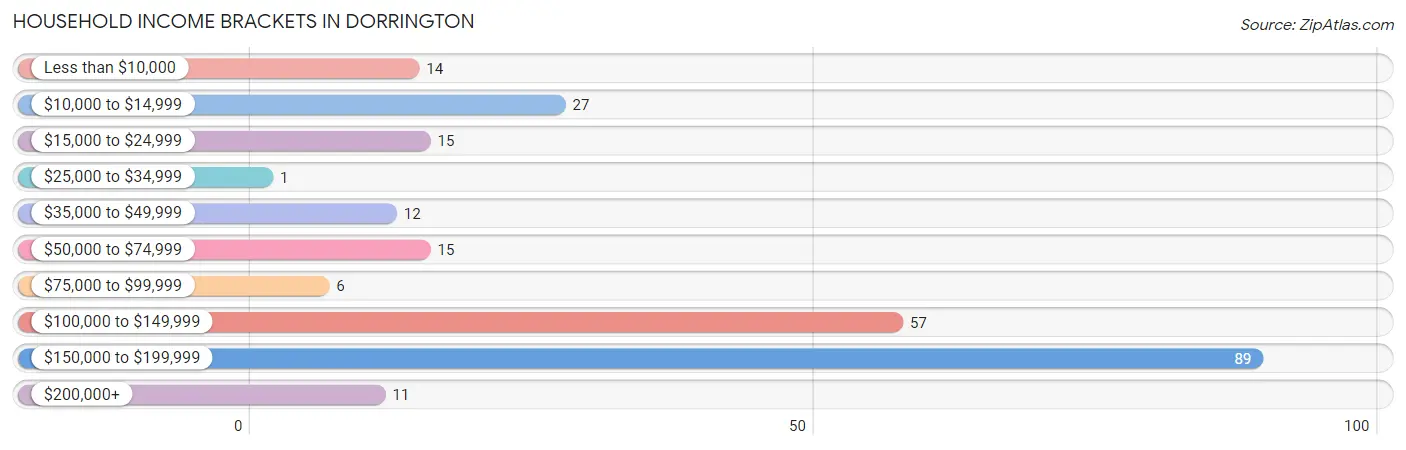
Household Income Brackets in Dorrington
With 89 households falling in the category, the $150,000 to $199,999 income range is the most frequent in Dorrington, accounting for 36.0% of all households. In contrast, only 1 households (0.4%) fall into the $25,000 to $34,999 income bracket, making it the least populous group.
| Income Bracket | # Households | % Households |
| Less than $10,000 | 14 | 5.7% |
| $10,000 to $14,999 | 27 | 10.9% |
| $15,000 to $24,999 | 15 | 6.1% |
| $25,000 to $34,999 | 1 | 0.4% |
| $35,000 to $49,999 | 12 | 4.9% |
| $50,000 to $74,999 | 15 | 6.1% |
| $75,000 to $99,999 | 6 | 2.4% |
| $100,000 to $149,999 | 57 | 23.1% |
| $150,000 to $199,999 | 89 | 36.0% |
| $200,000+ | 11 | 4.5% |
Household Income by Householder Age in Dorrington
The median household income in Dorrington is $128,304, with the highest median household income of $166,094 found in the 45 to 64 years age bracket for the primary householder. A total of 108 households (43.7%) fall into this category.
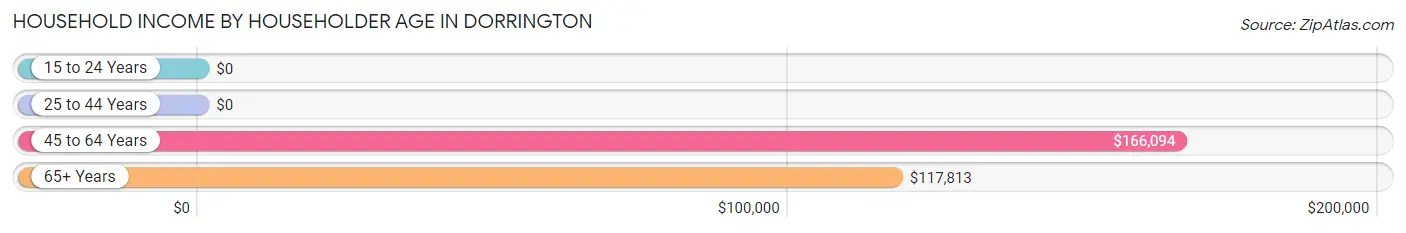
| Income Bracket | # Households | Median Income |
| 15 to 24 Years | 0 (0.0%) | $0 |
| 25 to 44 Years | 14 (5.7%) | $0 |
| 45 to 64 Years | 108 (43.7%) | $166,094 |
| 65+ Years | 125 (50.6%) | $117,813 |
| Total | 247 (100.0%) | $128,304 |
Poverty in Dorrington
Income Below Poverty by Sex and Age in Dorrington
With 14.2% poverty level for males and 5.6% for females among the residents of Dorrington, 35 to 44 year old males and 35 to 44 year old females are the most vulnerable to poverty, with 1 males (100.0%) and 14 females (48.3%) in their respective age groups living below the poverty level.
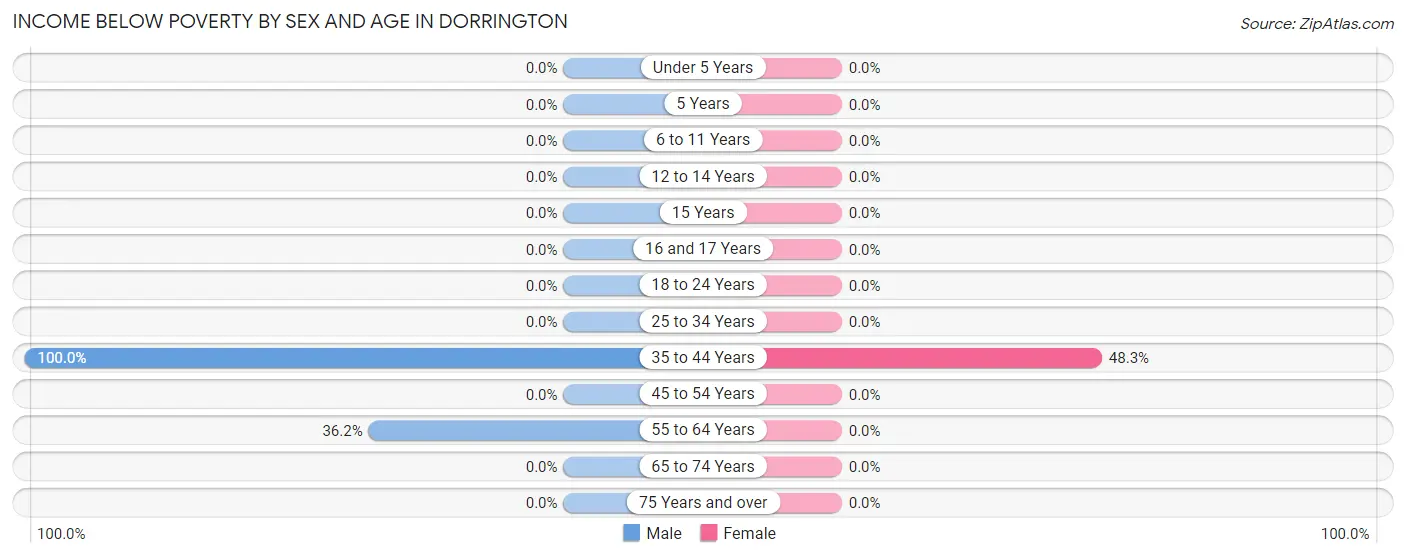
| Age Bracket | Male | Female |
| Under 5 Years | 0 (0.0%) | 0 (0.0%) |
| 5 Years | 0 (0.0%) | 0 (0.0%) |
| 6 to 11 Years | 0 (0.0%) | 0 (0.0%) |
| 12 to 14 Years | 0 (0.0%) | 0 (0.0%) |
| 15 Years | 0 (0.0%) | 0 (0.0%) |
| 16 and 17 Years | 0 (0.0%) | 0 (0.0%) |
| 18 to 24 Years | 0 (0.0%) | 0 (0.0%) |
| 25 to 34 Years | 0 (0.0%) | 0 (0.0%) |
| 35 to 44 Years | 1 (100.0%) | 14 (48.3%) |
| 45 to 54 Years | 0 (0.0%) | 0 (0.0%) |
| 55 to 64 Years | 34 (36.2%) | 0 (0.0%) |
| 65 to 74 Years | 0 (0.0%) | 0 (0.0%) |
| 75 Years and over | 0 (0.0%) | 0 (0.0%) |
| Total | 35 (14.2%) | 14 (5.6%) |
Income Above Poverty by Sex and Age in Dorrington
According to the poverty statistics in Dorrington, males aged under 5 years and females aged 6 to 11 years are the age groups that are most secure financially, with 100.0% of males and 100.0% of females in these age groups living above the poverty line.
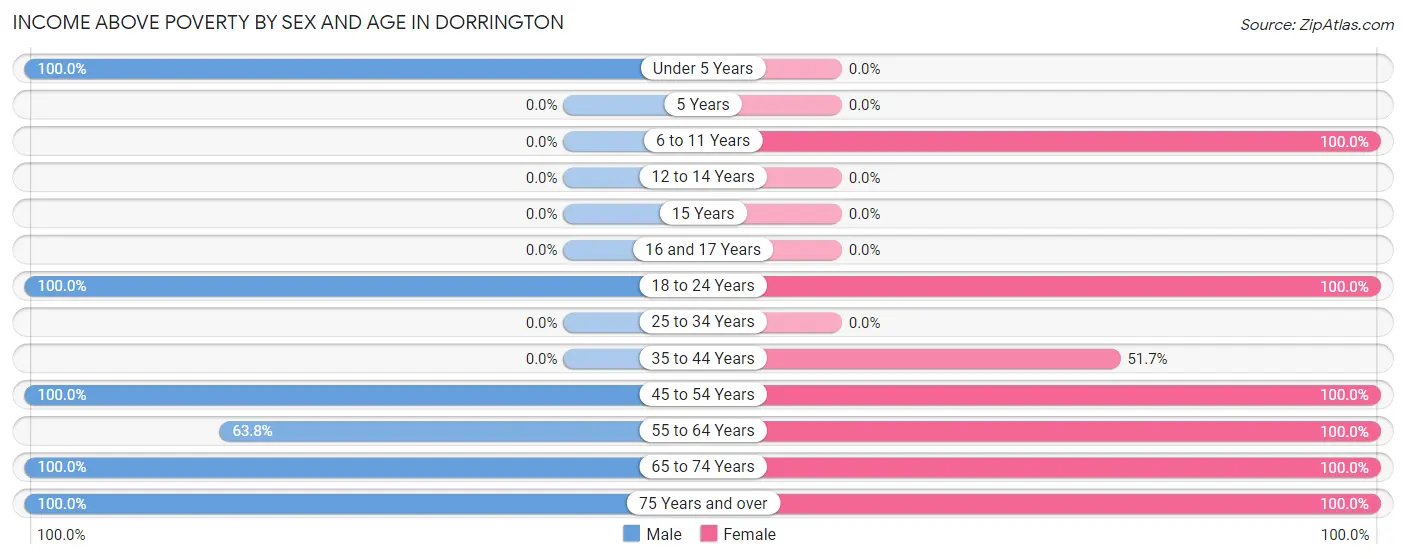
| Age Bracket | Male | Female |
| Under 5 Years | 17 (100.0%) | 0 (0.0%) |
| 5 Years | 0 (0.0%) | 0 (0.0%) |
| 6 to 11 Years | 0 (0.0%) | 19 (100.0%) |
| 12 to 14 Years | 0 (0.0%) | 0 (0.0%) |
| 15 Years | 0 (0.0%) | 0 (0.0%) |
| 16 and 17 Years | 0 (0.0%) | 0 (0.0%) |
| 18 to 24 Years | 5 (100.0%) | 17 (100.0%) |
| 25 to 34 Years | 0 (0.0%) | 0 (0.0%) |
| 35 to 44 Years | 0 (0.0%) | 15 (51.7%) |
| 45 to 54 Years | 11 (100.0%) | 7 (100.0%) |
| 55 to 64 Years | 60 (63.8%) | 55 (100.0%) |
| 65 to 74 Years | 41 (100.0%) | 44 (100.0%) |
| 75 Years and over | 78 (100.0%) | 80 (100.0%) |
| Total | 212 (85.8%) | 237 (94.4%) |
Income Below Poverty Among Married-Couple Families in Dorrington
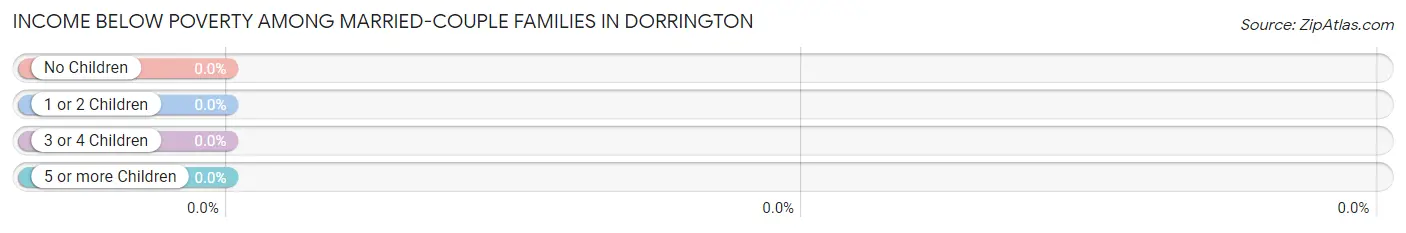
| Children | Above Poverty | Below Poverty |
| No Children | 149 (100.0%) | 0 (0.0%) |
| 1 or 2 Children | 11 (100.0%) | 0 (0.0%) |
| 3 or 4 Children | 0 (0.0%) | 0 (0.0%) |
| 5 or more Children | 0 (0.0%) | 0 (0.0%) |
| Total | 160 (100.0%) | 0 (0.0%) |
Income Below Poverty Among Single-Parent Households in Dorrington
| Children | Single Father | Single Mother |
| No Children | 0 (0.0%) | 0 (0.0%) |
| 1 or 2 Children | 0 (0.0%) | 0 (0.0%) |
| 3 or 4 Children | 0 (0.0%) | 0 (0.0%) |
| 5 or more Children | 0 (0.0%) | 0 (0.0%) |
| Total | 0 (0.0%) | 0 (0.0%) |
Income Below Poverty Among Married-Couple vs Single-Parent Households in Dorrington
| Children | Married-Couple Families | Single-Parent Households |
| No Children | 0 (0.0%) | 0 (0.0%) |
| 1 or 2 Children | 0 (0.0%) | 0 (0.0%) |
| 3 or 4 Children | 0 (0.0%) | 0 (0.0%) |
| 5 or more Children | 0 (0.0%) | 0 (0.0%) |
| Total | 0 (0.0%) | 0 (0.0%) |
Race in Dorrington
The most populous races in Dorrington are White / Caucasian (476 | 95.6%), Two or more Races (14 | 2.8%), and Hawaiian / Pacific (7 | 1.4%).
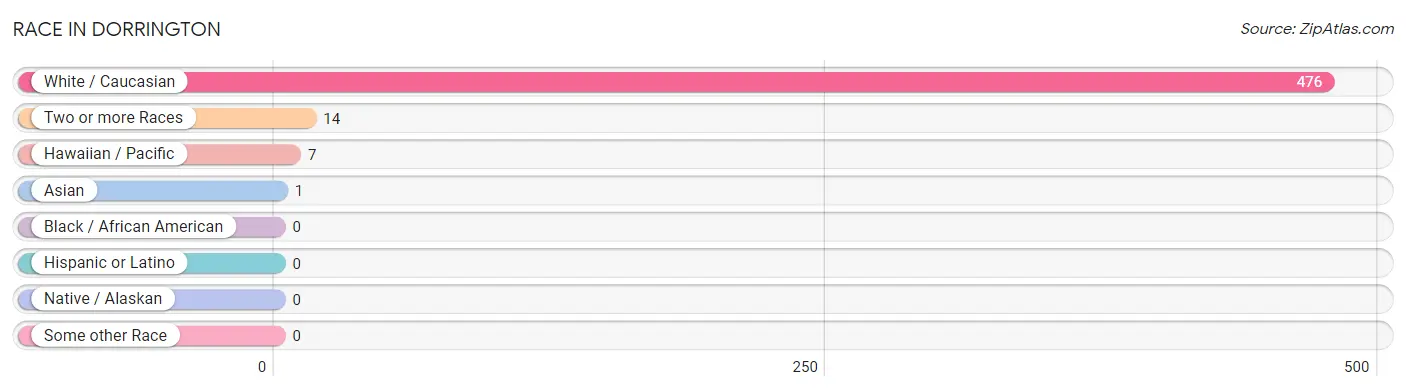
| Race | # Population | % Population |
| Asian | 1 | 0.2% |
| Black / African American | 0 | 0.0% |
| Hawaiian / Pacific | 7 | 1.4% |
| Hispanic or Latino | 0 | 0.0% |
| Native / Alaskan | 0 | 0.0% |
| White / Caucasian | 476 | 95.6% |
| Two or more Races | 14 | 2.8% |
| Some other Race | 0 | 0.0% |
| Total | 498 | 100.0% |
Ancestry in Dorrington
The most populous ancestries reported in Dorrington are English (105 | 21.1%), British (80 | 16.1%), Irish (55 | 11.0%), European (42 | 8.4%), and German (41 | 8.2%), together accounting for 64.8% of all Dorrington residents.
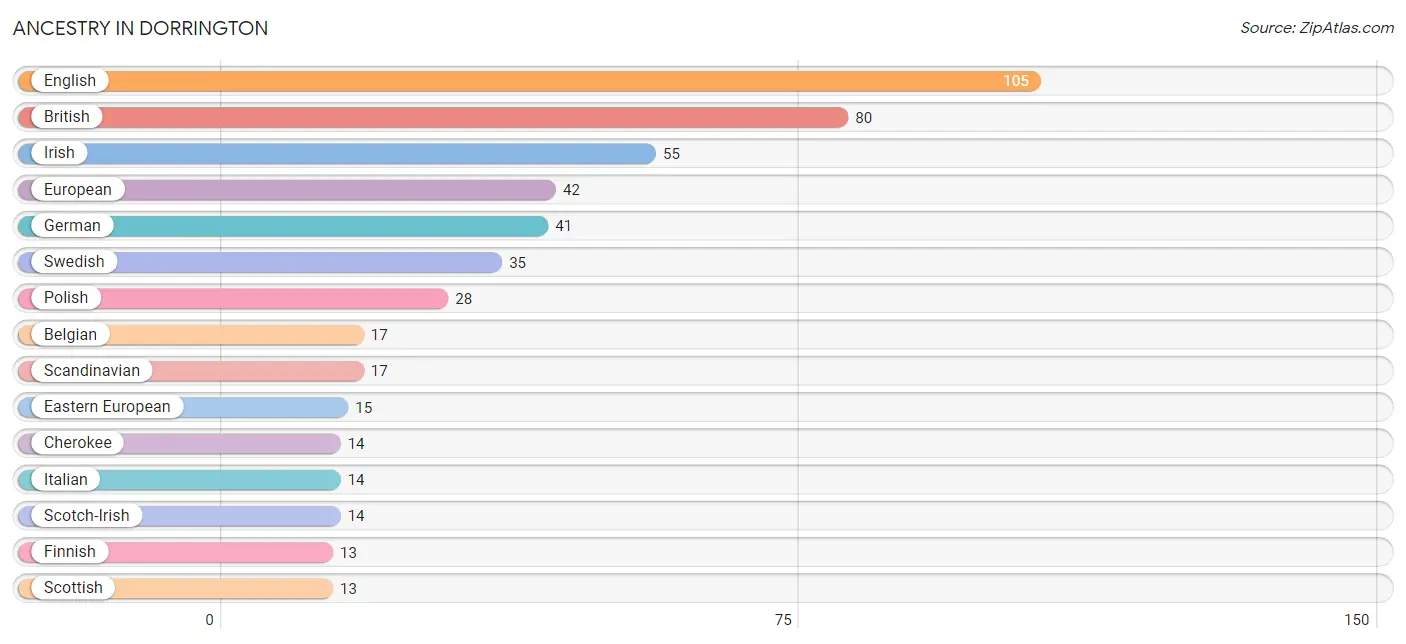
| Ancestry | # Population | % Population |
| American | 7 | 1.4% |
| Australian | 7 | 1.4% |
| Belgian | 17 | 3.4% |
| British | 80 | 16.1% |
| Burmese | 1 | 0.2% |
| Cherokee | 14 | 2.8% |
| Eastern European | 15 | 3.0% |
| English | 105 | 21.1% |
| European | 42 | 8.4% |
| Finnish | 13 | 2.6% |
| French | 6 | 1.2% |
| German | 41 | 8.2% |
| Irish | 55 | 11.0% |
| Italian | 14 | 2.8% |
| Northern European | 11 | 2.2% |
| Polish | 28 | 5.6% |
| Russian | 5 | 1.0% |
| Scandinavian | 17 | 3.4% |
| Scotch-Irish | 14 | 2.8% |
| Scottish | 13 | 2.6% |
| Swedish | 35 | 7.0% |
| Thai | 1 | 0.2% | View All 22 Rows |
Immigrants in Dorrington
The most numerous immigrant groups reported in Dorrington came from Europe (41 | 8.2%), Eastern Europe (37 | 7.4%), Poland (22 | 4.4%), Asia (15 | 3.0%), and Ukraine (15 | 3.0%), together accounting for 26.1% of all Dorrington residents.
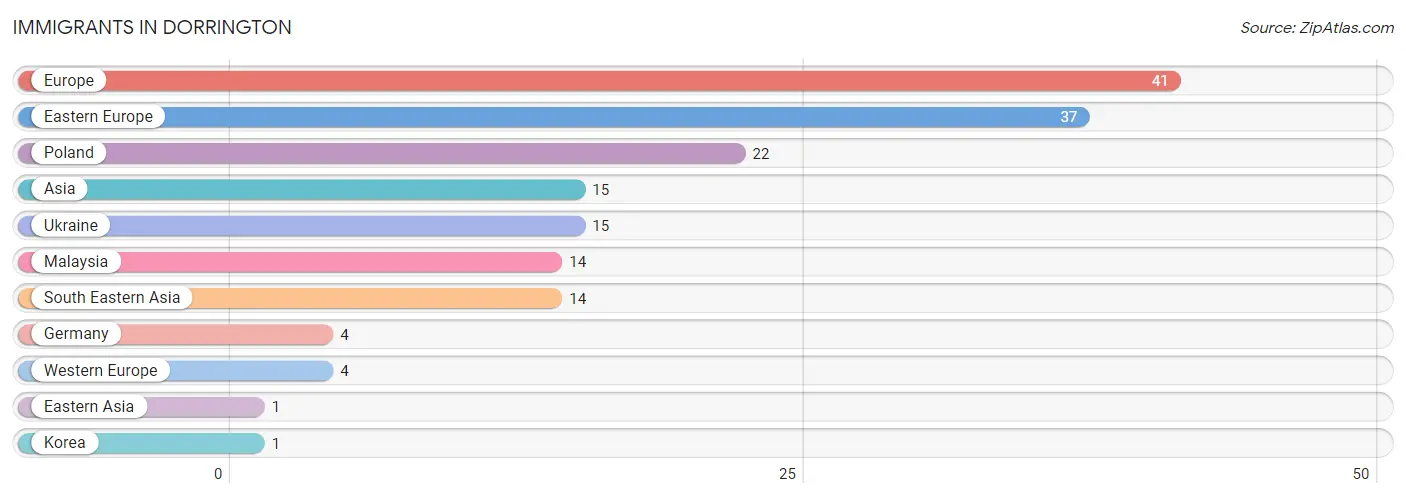
| Immigration Origin | # Population | % Population |
| Asia | 15 | 3.0% |
| Eastern Asia | 1 | 0.2% |
| Eastern Europe | 37 | 7.4% |
| Europe | 41 | 8.2% |
| Germany | 4 | 0.8% |
| Korea | 1 | 0.2% |
| Malaysia | 14 | 2.8% |
| Poland | 22 | 4.4% |
| South Eastern Asia | 14 | 2.8% |
| Ukraine | 15 | 3.0% |
| Western Europe | 4 | 0.8% | View All 11 Rows |
Sex and Age in Dorrington
Sex and Age in Dorrington
The most populous age groups in Dorrington are 60 to 64 Years (49 | 19.8%) for men and 85 Years and over (41 | 16.3%) for women.
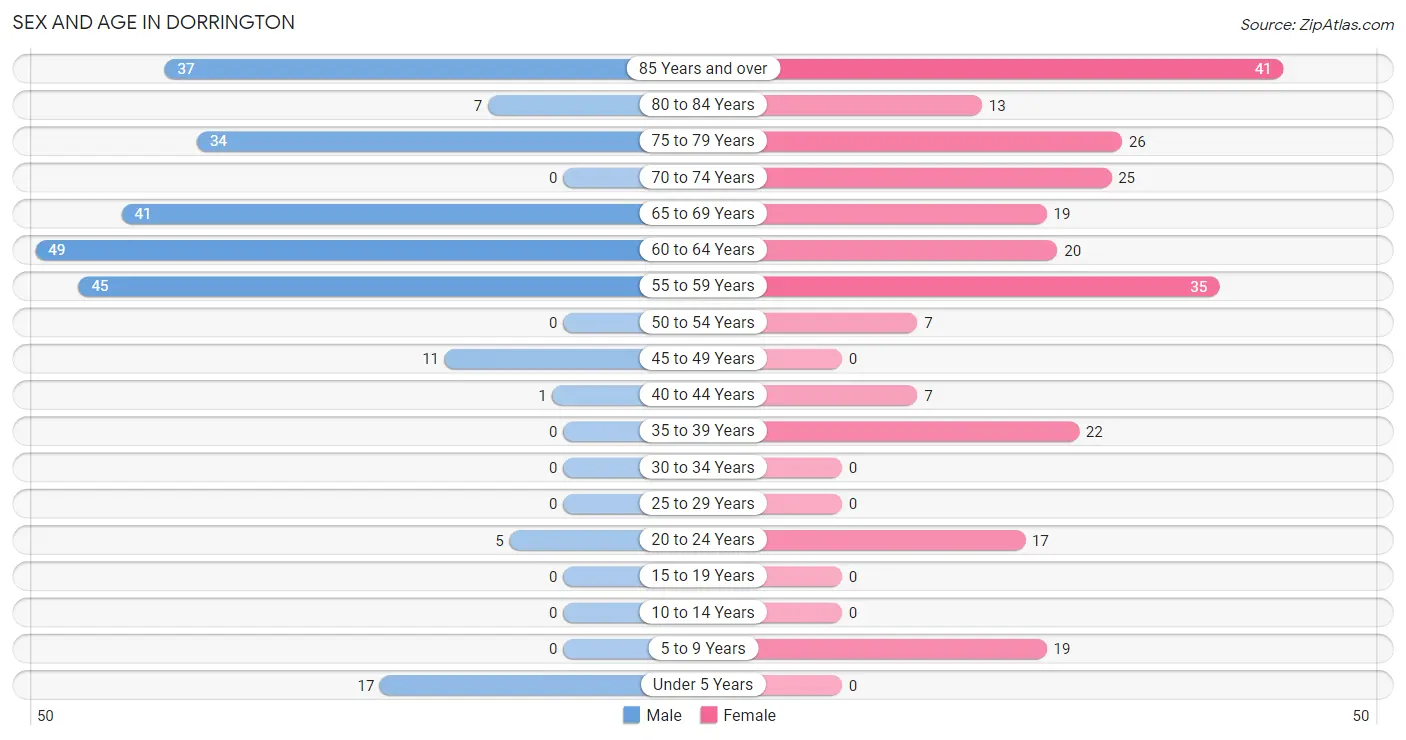
| Age Bracket | Male | Female |
| Under 5 Years | 17 (6.9%) | 0 (0.0%) |
| 5 to 9 Years | 0 (0.0%) | 19 (7.6%) |
| 10 to 14 Years | 0 (0.0%) | 0 (0.0%) |
| 15 to 19 Years | 0 (0.0%) | 0 (0.0%) |
| 20 to 24 Years | 5 (2.0%) | 17 (6.8%) |
| 25 to 29 Years | 0 (0.0%) | 0 (0.0%) |
| 30 to 34 Years | 0 (0.0%) | 0 (0.0%) |
| 35 to 39 Years | 0 (0.0%) | 22 (8.8%) |
| 40 to 44 Years | 1 (0.4%) | 7 (2.8%) |
| 45 to 49 Years | 11 (4.4%) | 0 (0.0%) |
| 50 to 54 Years | 0 (0.0%) | 7 (2.8%) |
| 55 to 59 Years | 45 (18.2%) | 35 (13.9%) |
| 60 to 64 Years | 49 (19.8%) | 20 (8.0%) |
| 65 to 69 Years | 41 (16.6%) | 19 (7.6%) |
| 70 to 74 Years | 0 (0.0%) | 25 (10.0%) |
| 75 to 79 Years | 34 (13.8%) | 26 (10.4%) |
| 80 to 84 Years | 7 (2.8%) | 13 (5.2%) |
| 85 Years and over | 37 (15.0%) | 41 (16.3%) |
| Total | 247 (100.0%) | 251 (100.0%) |
Families and Households in Dorrington
Median Family Size in Dorrington
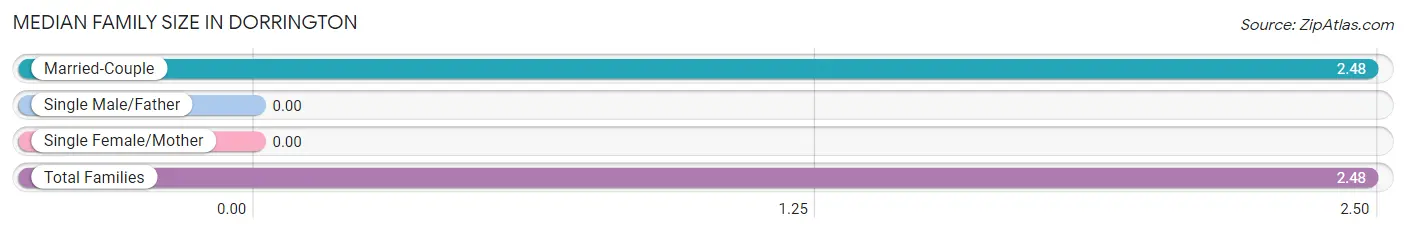
| Family Type | # Families | Family Size |
| Married-Couple | 160 (100.0%) | 2.48 |
| Single Male/Father | 0 (0.0%) | - |
| Single Female/Mother | 0 (0.0%) | - |
| Total Families | 160 (100.0%) | 2.48 |
Median Household Size in Dorrington
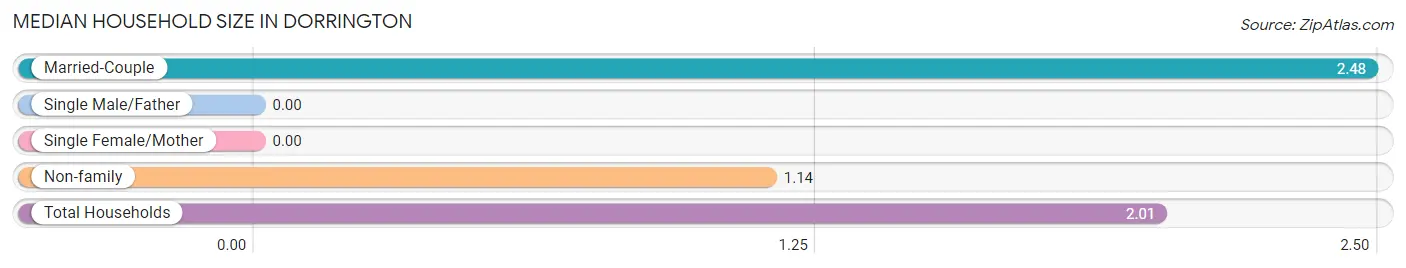
| Household Type | # Households | Household Size |
| Married-Couple | 160 (64.8%) | 2.48 |
| Single Male/Father | 0 (0.0%) | - |
| Single Female/Mother | 0 (0.0%) | - |
| Non-family | 87 (35.2%) | 1.14 |
| Total Households | 247 (100.0%) | 2.01 |
Household Size by Marriage Status in Dorrington
Out of a total of 247 households in Dorrington, 160 (64.8%) are family households, while 87 (35.2%) are nonfamily households. The most numerous type of family households are 2-person households, comprising 127, and the most common type of nonfamily households are 1-person households, comprising 73.
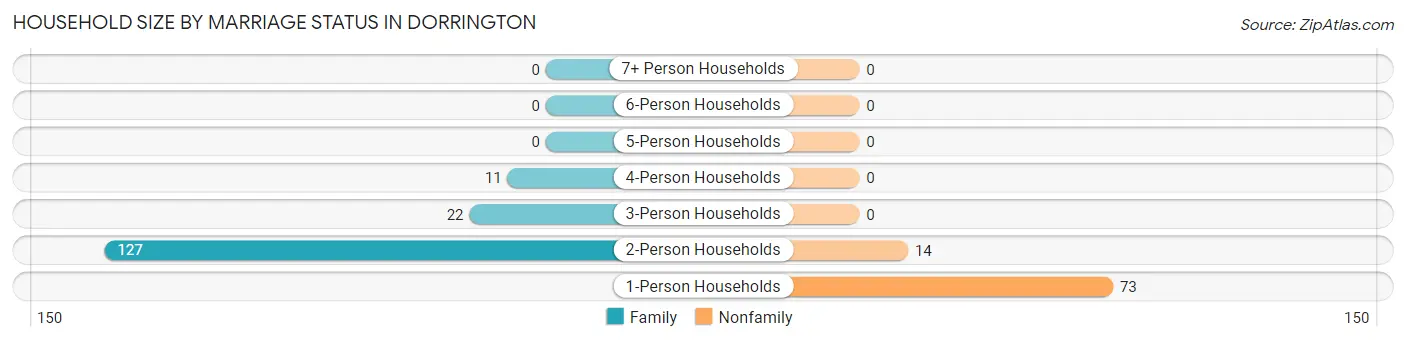
| Household Size | Family Households | Nonfamily Households |
| 1-Person Households | - | 73 (29.5%) |
| 2-Person Households | 127 (51.4%) | 14 (5.7%) |
| 3-Person Households | 22 (8.9%) | 0 (0.0%) |
| 4-Person Households | 11 (4.4%) | 0 (0.0%) |
| 5-Person Households | 0 (0.0%) | 0 (0.0%) |
| 6-Person Households | 0 (0.0%) | 0 (0.0%) |
| 7+ Person Households | 0 (0.0%) | 0 (0.0%) |
| Total | 160 (64.8%) | 87 (35.2%) |
Female Fertility in Dorrington
Fertility by Age in Dorrington
| Age Bracket | Women with Births | Births / 1,000 Women |
| 15 to 19 years | 0 (0.0%) | 0.0 |
| 20 to 34 years | 0 (0.0%) | 0.0 |
| 35 to 50 years | 0 (0.0%) | 0.0 |
| Total | 0 (0.0%) | 0.0 |
Fertility by Age by Marriage Status in Dorrington
| Age Bracket | Married | Unmarried |
| 15 to 19 years | 0 (0.0%) | 0 (0.0%) |
| 20 to 34 years | 0 (0.0%) | 0 (0.0%) |
| 35 to 50 years | 0 (0.0%) | 0 (0.0%) |
| Total | 0 (0.0%) | 0 (0.0%) |
Fertility by Education in Dorrington
| Educational Attainment | Women with Births | Births / 1,000 Women |
| Less than High School | 0 (0.0%) | 0.0 |
| High School Diploma | 0 (0.0%) | 0.0 |
| College or Associate's Degree | 0 (0.0%) | 0.0 |
| Bachelor's Degree | 0 (0.0%) | 0.0 |
| Graduate Degree | 0 (0.0%) | 0.0 |
| Total | 0 (0.0%) | 0.0 |
Fertility by Education by Marriage Status in Dorrington
| Educational Attainment | Married | Unmarried |
| Less than High School | 0 (0.0%) | 0 (0.0%) |
| High School Diploma | 0 (0.0%) | 0 (0.0%) |
| College or Associate's Degree | 0 (0.0%) | 0 (0.0%) |
| Bachelor's Degree | 0 (0.0%) | 0 (0.0%) |
| Graduate Degree | 0 (0.0%) | 0 (0.0%) |
| Total | 0 (0.0%) | 0 (0.0%) |
Employment Characteristics in Dorrington
Employment by Class of Employer in Dorrington
Among the 163 employed individuals in Dorrington, private company employees (105 | 64.4%), not-for-profit organizations (20 | 12.3%), and self-employed (incorporated) (17 | 10.4%) make up the most common classes of employment.
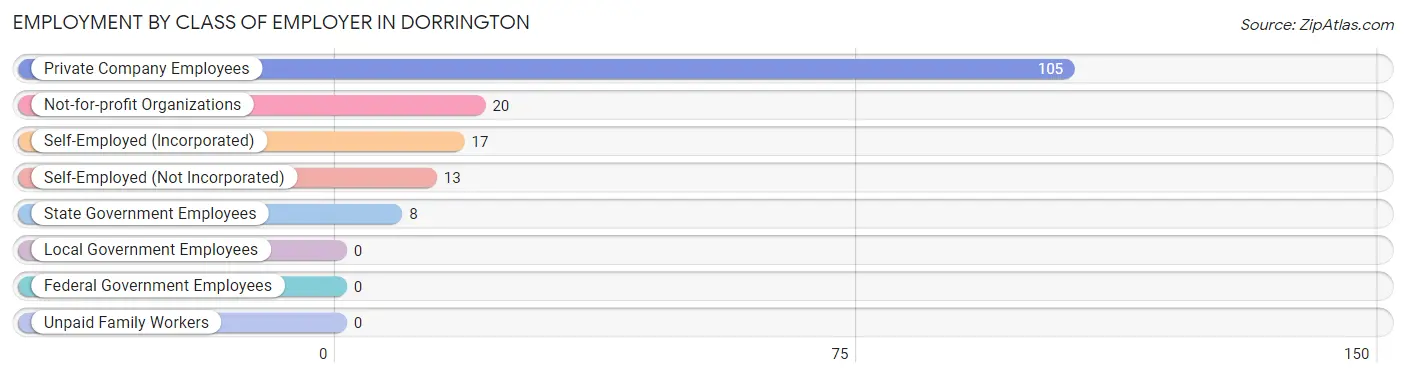
| Employer Class | # Employees | % Employees |
| Private Company Employees | 105 | 64.4% |
| Self-Employed (Incorporated) | 17 | 10.4% |
| Self-Employed (Not Incorporated) | 13 | 8.0% |
| Not-for-profit Organizations | 20 | 12.3% |
| Local Government Employees | 0 | 0.0% |
| State Government Employees | 8 | 4.9% |
| Federal Government Employees | 0 | 0.0% |
| Unpaid Family Workers | 0 | 0.0% |
| Total | 163 | 100.0% |
Employment Status by Age in Dorrington
According to the labor force statistics for Dorrington, out of the total population over 16 years of age (462), 36.8% or 170 individuals are in the labor force, with 4.1% or 7 of them unemployed. The age group with the highest labor force participation rate is 45 to 54 years, with 100.0% or 18 individuals in the labor force. Within the labor force, the 55 to 59 years age range has the highest percentage of unemployed individuals, with 17.5% or 7 of them being unemployed.
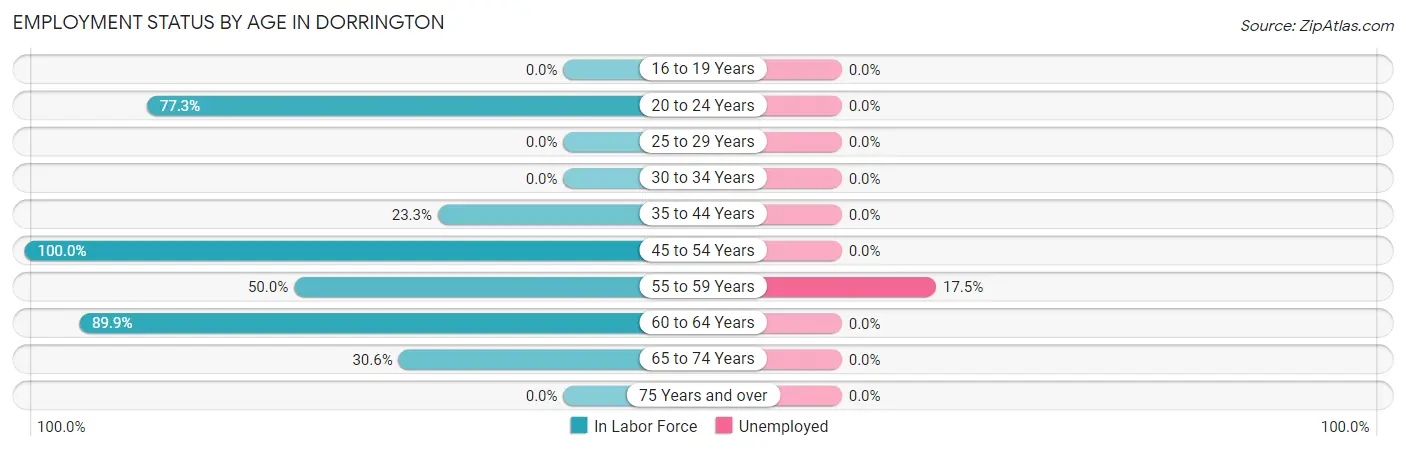
| Age Bracket | In Labor Force | Unemployed |
| 16 to 19 Years | 0 (0.0%) | 0 (0.0%) |
| 20 to 24 Years | 17 (77.3%) | 0 (0.0%) |
| 25 to 29 Years | 0 (0.0%) | 0 (0.0%) |
| 30 to 34 Years | 0 (0.0%) | 0 (0.0%) |
| 35 to 44 Years | 7 (23.3%) | 0 (0.0%) |
| 45 to 54 Years | 18 (100.0%) | 0 (0.0%) |
| 55 to 59 Years | 40 (50.0%) | 7 (17.5%) |
| 60 to 64 Years | 62 (89.9%) | 0 (0.0%) |
| 65 to 74 Years | 26 (30.6%) | 0 (0.0%) |
| 75 Years and over | 0 (0.0%) | 0 (0.0%) |
| Total | 170 (36.8%) | 7 (4.1%) |
Employment Status by Educational Attainment in Dorrington
According to labor force statistics for Dorrington, 64.5% of individuals (127) out of the total population between 25 and 64 years of age (197) are in the labor force, with 5.5% or 7 of them being unemployed. The group with the highest labor force participation rate are those with the educational attainment of less than high school, with 100.0% or 47 individuals in the labor force. Within the labor force, individuals with high school diploma education have the highest percentage of unemployment, with 20.6% or 7 of them being unemployed.
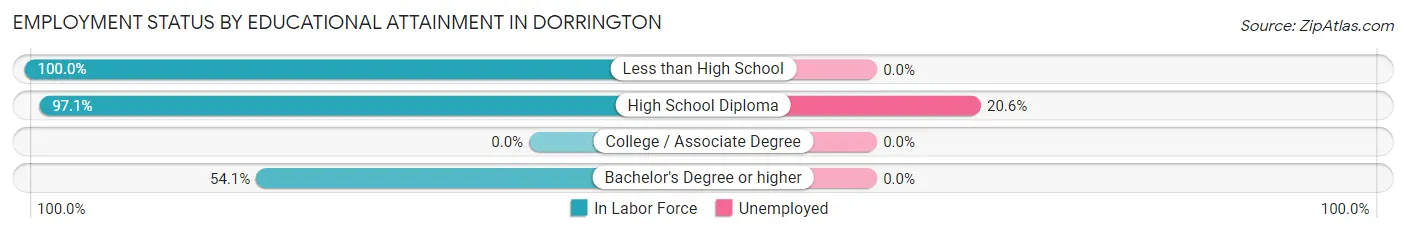
| Educational Attainment | In Labor Force | Unemployed |
| Less than High School | 47 (100.0%) | 0 (0.0%) |
| High School Diploma | 34 (97.1%) | 7 (20.6%) |
| College / Associate Degree | 0 (0.0%) | 0 (0.0%) |
| Bachelor's Degree or higher | 46 (54.1%) | 0 (0.0%) |
| Total | 127 (64.5%) | 11 (5.5%) |
Employment Occupations by Sex in Dorrington
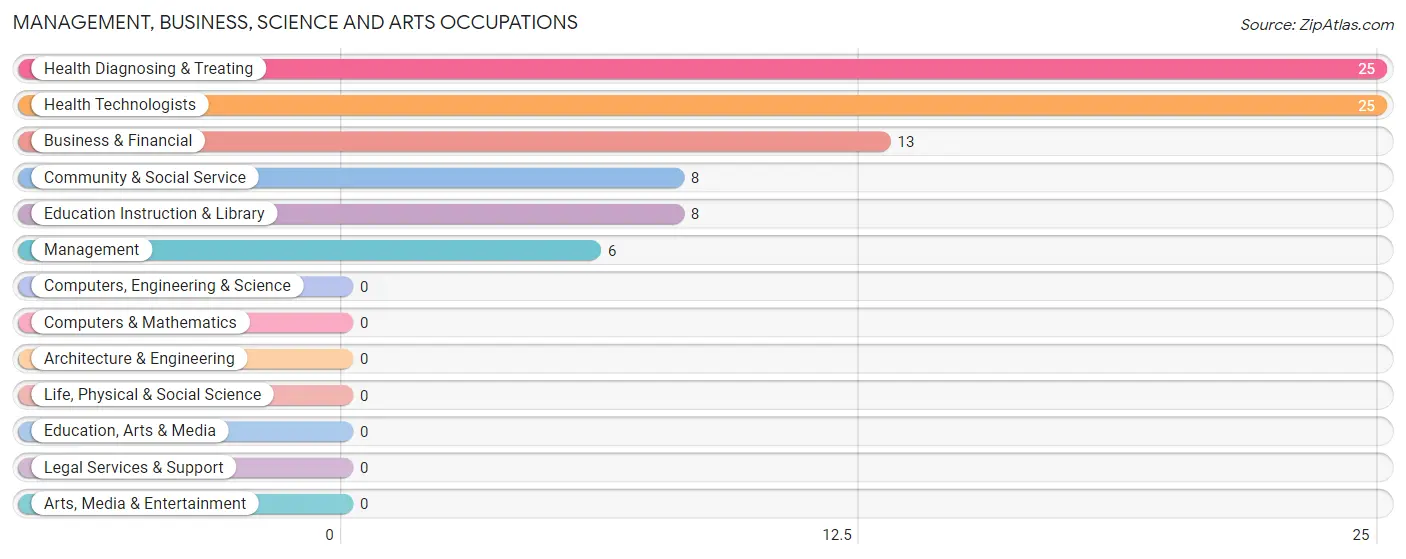
Management, Business, Science and Arts Occupations
The most common Management, Business, Science and Arts occupations in Dorrington are Health Diagnosing & Treating (25 | 15.3%), Health Technologists (25 | 15.3%), Business & Financial (13 | 8.0%), Community & Social Service (8 | 4.9%), and Education Instruction & Library (8 | 4.9%).
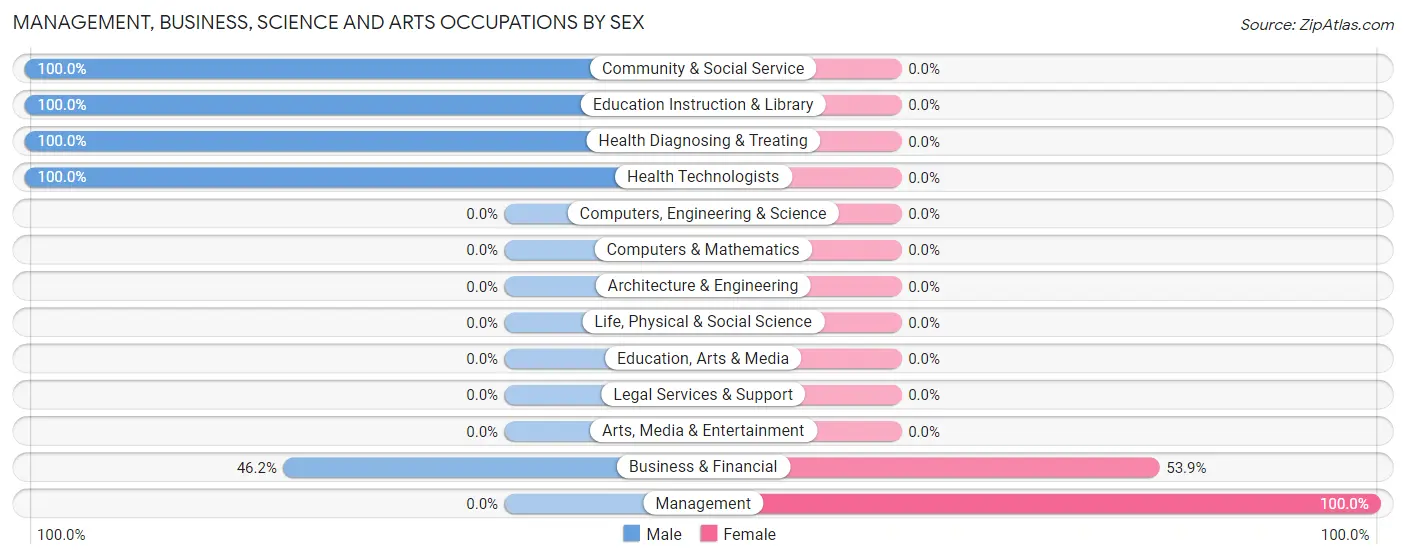
Management, Business, Science and Arts Occupations by Sex
Within the Management, Business, Science and Arts occupations in Dorrington, the most male-oriented occupations are Community & Social Service (100.0%), Education Instruction & Library (100.0%), and Health Diagnosing & Treating (100.0%), while the most female-oriented occupations are Management (100.0%), and Business & Financial (53.8%).
| Occupation | Male | Female |
| Management | 0 (0.0%) | 6 (100.0%) |
| Business & Financial | 6 (46.2%) | 7 (53.8%) |
| Computers, Engineering & Science | 0 (0.0%) | 0 (0.0%) |
| Computers & Mathematics | 0 (0.0%) | 0 (0.0%) |
| Architecture & Engineering | 0 (0.0%) | 0 (0.0%) |
| Life, Physical & Social Science | 0 (0.0%) | 0 (0.0%) |
| Community & Social Service | 8 (100.0%) | 0 (0.0%) |
| Education, Arts & Media | 0 (0.0%) | 0 (0.0%) |
| Legal Services & Support | 0 (0.0%) | 0 (0.0%) |
| Education Instruction & Library | 8 (100.0%) | 0 (0.0%) |
| Arts, Media & Entertainment | 0 (0.0%) | 0 (0.0%) |
| Health Diagnosing & Treating | 25 (100.0%) | 0 (0.0%) |
| Health Technologists | 25 (100.0%) | 0 (0.0%) |
| Total (Category) | 39 (75.0%) | 13 (25.0%) |
| Total (Overall) | 93 (57.1%) | 70 (42.9%) |
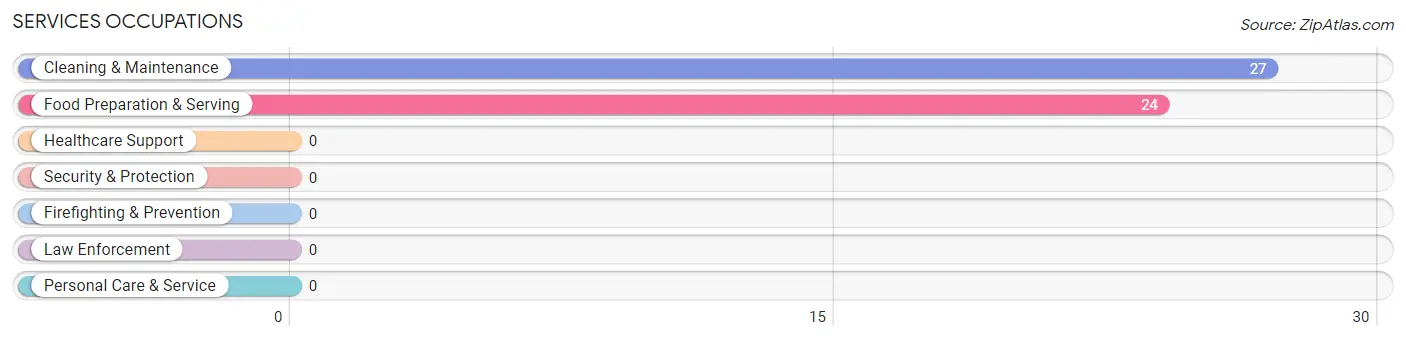
Services Occupations
The most common Services occupations in Dorrington are Cleaning & Maintenance (27 | 16.6%), and Food Preparation & Serving (24 | 14.7%).
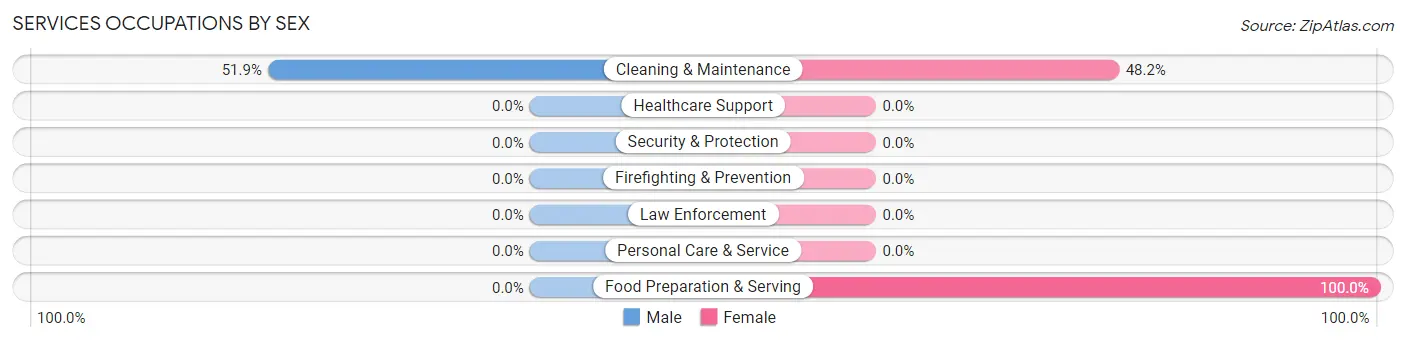
Services Occupations by Sex
| Occupation | Male | Female |
| Healthcare Support | 0 (0.0%) | 0 (0.0%) |
| Security & Protection | 0 (0.0%) | 0 (0.0%) |
| Firefighting & Prevention | 0 (0.0%) | 0 (0.0%) |
| Law Enforcement | 0 (0.0%) | 0 (0.0%) |
| Food Preparation & Serving | 0 (0.0%) | 24 (100.0%) |
| Cleaning & Maintenance | 14 (51.8%) | 13 (48.1%) |
| Personal Care & Service | 0 (0.0%) | 0 (0.0%) |
| Total (Category) | 14 (27.5%) | 37 (72.6%) |
| Total (Overall) | 93 (57.1%) | 70 (42.9%) |
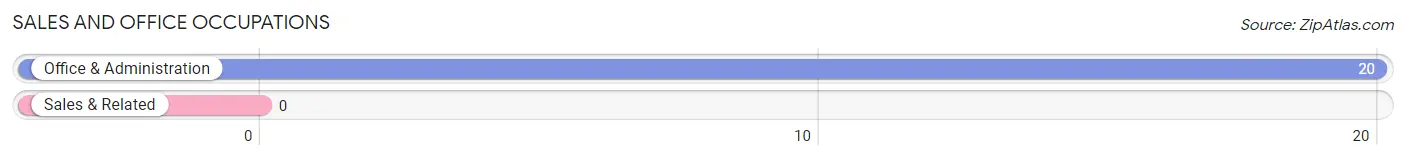
Sales and Office Occupations
The most common Sales and Office occupations in Dorrington are , and Office & Administration (20 | 12.3%).
Sales and Office Occupations by Sex
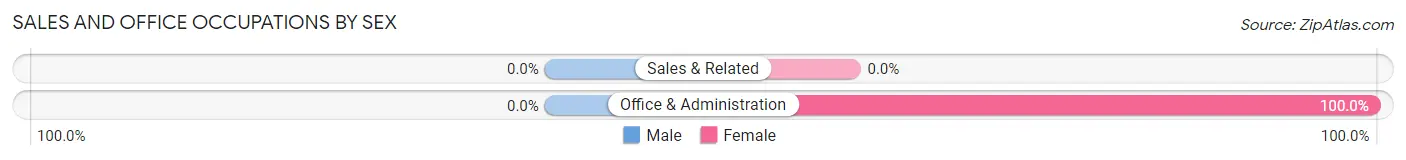
| Occupation | Male | Female |
| Sales & Related | 0 (0.0%) | 0 (0.0%) |
| Office & Administration | 0 (0.0%) | 20 (100.0%) |
| Total (Category) | 0 (0.0%) | 20 (100.0%) |
| Total (Overall) | 93 (57.1%) | 70 (42.9%) |
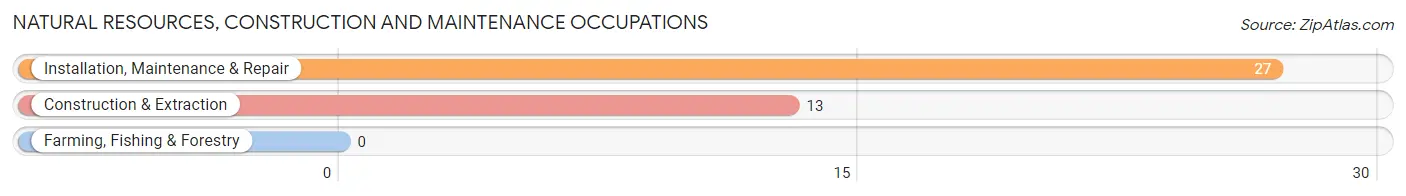
Natural Resources, Construction and Maintenance Occupations
The most common Natural Resources, Construction and Maintenance occupations in Dorrington are Installation, Maintenance & Repair (27 | 16.6%), and Construction & Extraction (13 | 8.0%).
Natural Resources, Construction and Maintenance Occupations by Sex
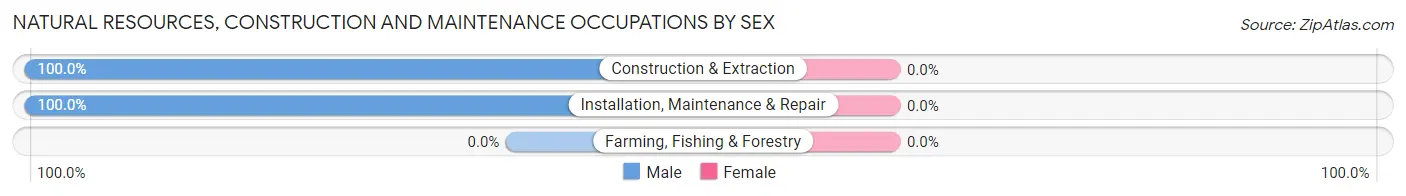
| Occupation | Male | Female |
| Farming, Fishing & Forestry | 0 (0.0%) | 0 (0.0%) |
| Construction & Extraction | 13 (100.0%) | 0 (0.0%) |
| Installation, Maintenance & Repair | 27 (100.0%) | 0 (0.0%) |
| Total (Category) | 40 (100.0%) | 0 (0.0%) |
| Total (Overall) | 93 (57.1%) | 70 (42.9%) |
Production, Transportation and Moving Occupations
Production, Transportation and Moving Occupations by Sex
| Occupation | Male | Female |
| Production | 0 (0.0%) | 0 (0.0%) |
| Transportation | 0 (0.0%) | 0 (0.0%) |
| Material Moving | 0 (0.0%) | 0 (0.0%) |
| Total (Category) | 0 (0.0%) | 0 (0.0%) |
| Total (Overall) | 93 (57.1%) | 70 (42.9%) |
Employment Industries by Sex in Dorrington
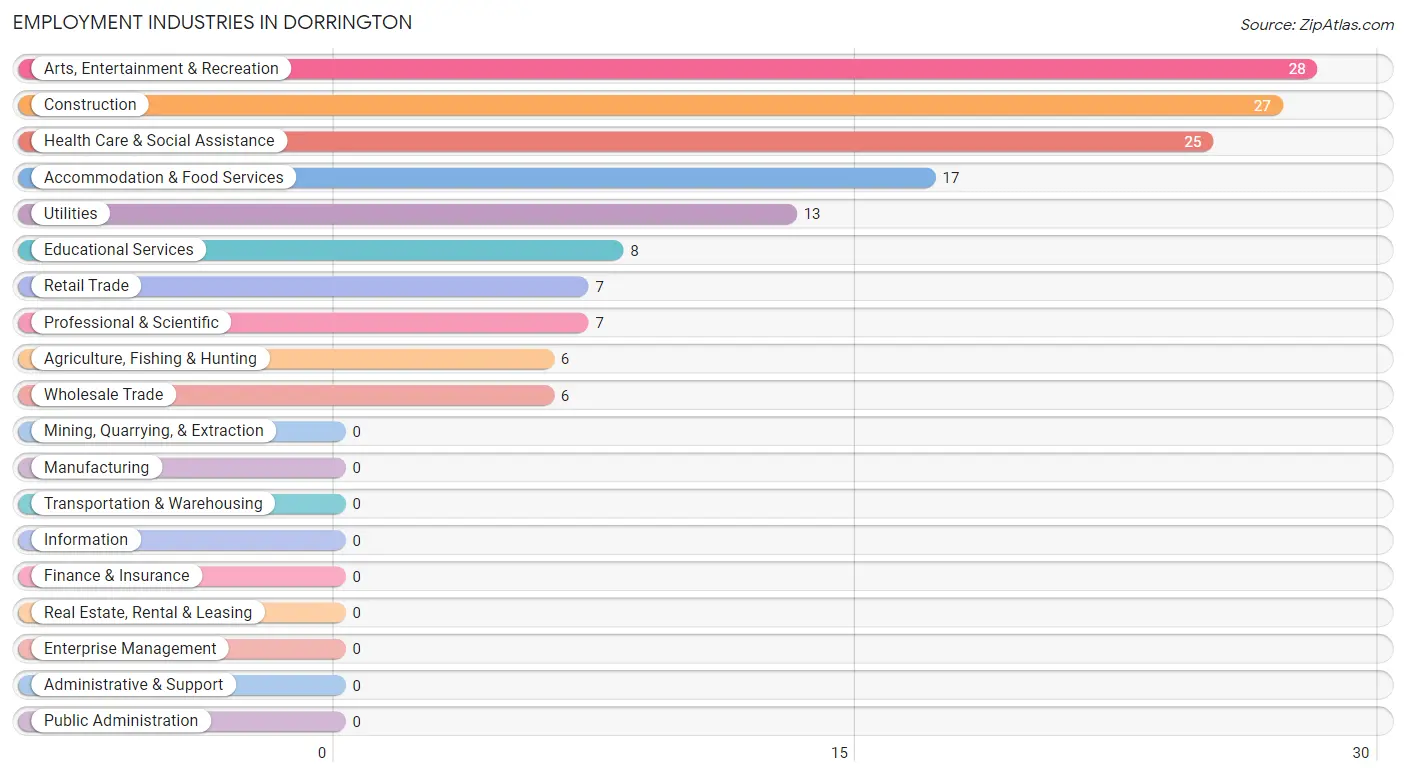
Employment Industries in Dorrington
The major employment industries in Dorrington include Arts, Entertainment & Recreation (28 | 17.2%), Construction (27 | 16.6%), Health Care & Social Assistance (25 | 15.3%), Accommodation & Food Services (17 | 10.4%), and Utilities (13 | 8.0%).
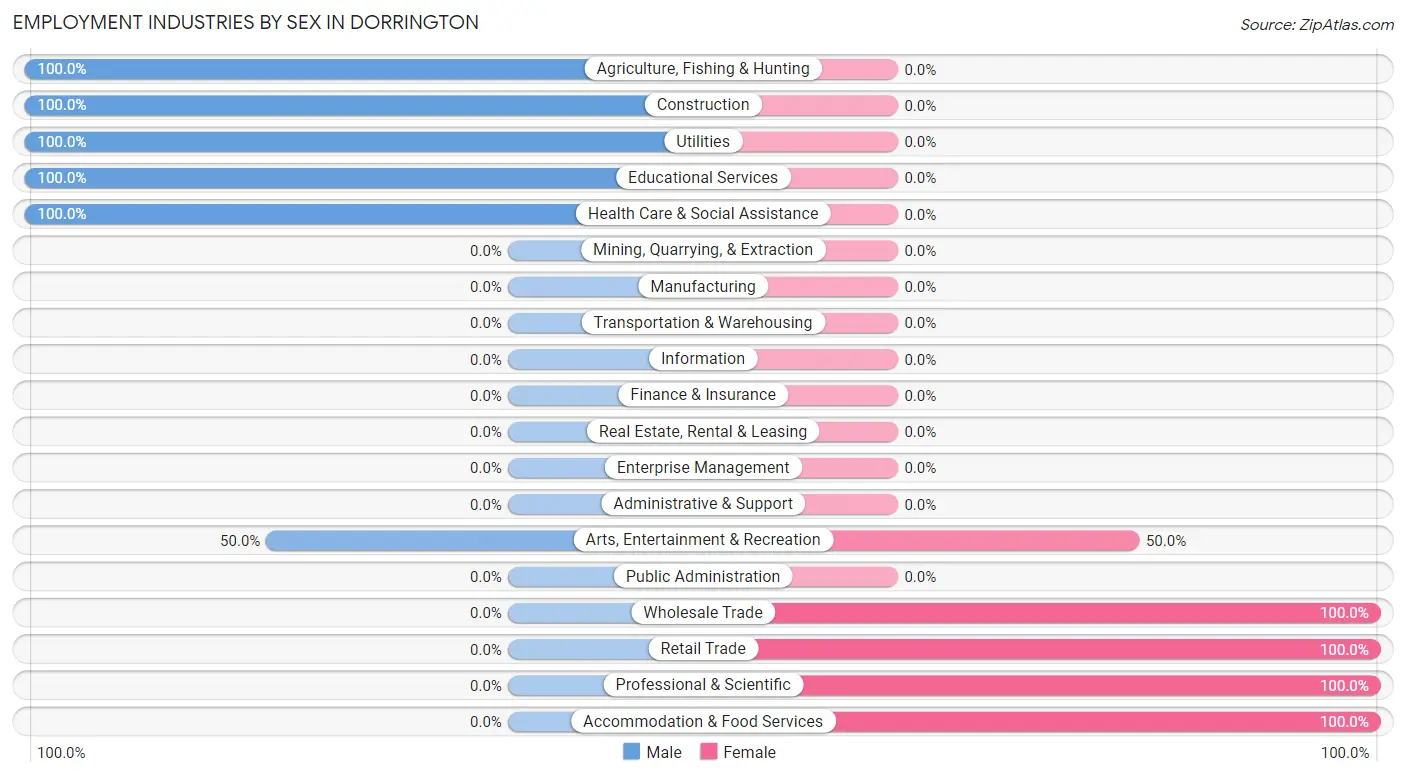
Employment Industries by Sex in Dorrington
The Dorrington industries that see more men than women are Agriculture, Fishing & Hunting (100.0%), Construction (100.0%), and Utilities (100.0%), whereas the industries that tend to have a higher number of women are Wholesale Trade (100.0%), Retail Trade (100.0%), and Professional & Scientific (100.0%).
| Industry | Male | Female |
| Agriculture, Fishing & Hunting | 6 (100.0%) | 0 (0.0%) |
| Mining, Quarrying, & Extraction | 0 (0.0%) | 0 (0.0%) |
| Construction | 27 (100.0%) | 0 (0.0%) |
| Manufacturing | 0 (0.0%) | 0 (0.0%) |
| Wholesale Trade | 0 (0.0%) | 6 (100.0%) |
| Retail Trade | 0 (0.0%) | 7 (100.0%) |
| Transportation & Warehousing | 0 (0.0%) | 0 (0.0%) |
| Utilities | 13 (100.0%) | 0 (0.0%) |
| Information | 0 (0.0%) | 0 (0.0%) |
| Finance & Insurance | 0 (0.0%) | 0 (0.0%) |
| Real Estate, Rental & Leasing | 0 (0.0%) | 0 (0.0%) |
| Professional & Scientific | 0 (0.0%) | 7 (100.0%) |
| Enterprise Management | 0 (0.0%) | 0 (0.0%) |
| Administrative & Support | 0 (0.0%) | 0 (0.0%) |
| Educational Services | 8 (100.0%) | 0 (0.0%) |
| Health Care & Social Assistance | 25 (100.0%) | 0 (0.0%) |
| Arts, Entertainment & Recreation | 14 (50.0%) | 14 (50.0%) |
| Accommodation & Food Services | 0 (0.0%) | 17 (100.0%) |
| Public Administration | 0 (0.0%) | 0 (0.0%) |
| Total | 93 (57.1%) | 70 (42.9%) |
Education in Dorrington
School Enrollment in Dorrington
The most common levels of schooling among the 46 students in Dorrington are college / undergraduate (27 | 58.7%), and elementary school (19 | 41.3%).
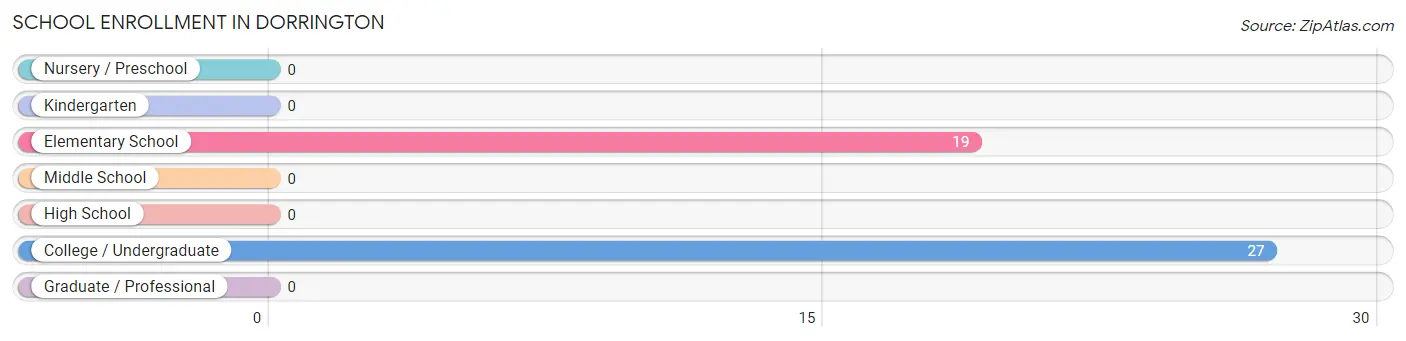
| School Level | # Students | % Students |
| Nursery / Preschool | 0 | 0.0% |
| Kindergarten | 0 | 0.0% |
| Elementary School | 19 | 41.3% |
| Middle School | 0 | 0.0% |
| High School | 0 | 0.0% |
| College / Undergraduate | 27 | 58.7% |
| Graduate / Professional | 0 | 0.0% |
| Total | 46 | 100.0% |
School Enrollment by Age by Funding Source in Dorrington
Out of a total of 46 students who are enrolled in schools in Dorrington, 7 (15.2%) attend a private institution, while the remaining 39 (84.8%) are enrolled in public schools. The age group of 35 years and over has the highest likelihood of being enrolled in private schools, with 7 (31.8% in the age bracket) enrolled. Conversely, the age group of 5 to 9 year old has the lowest likelihood of being enrolled in a private school, with 19 (100.0% in the age bracket) attending a public institution.
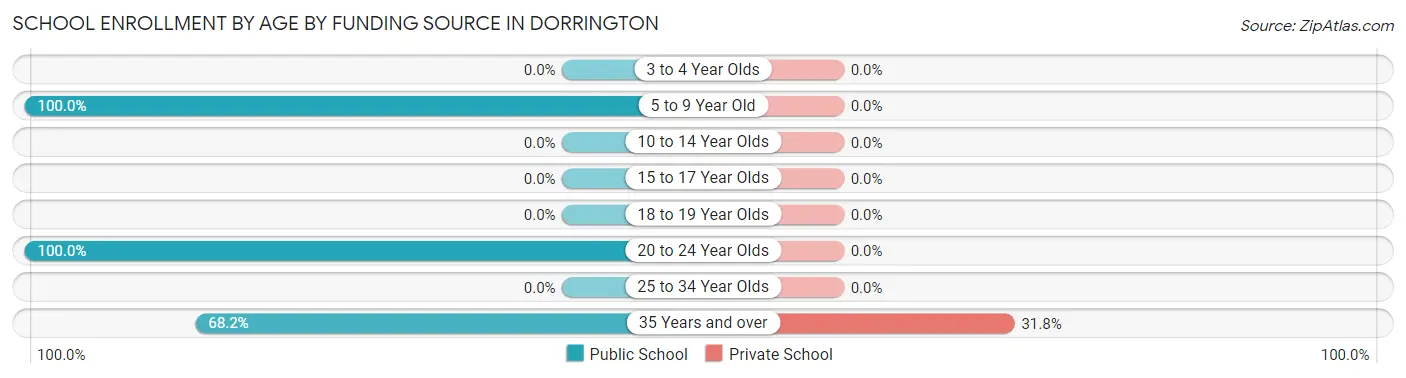
| Age Bracket | Public School | Private School |
| 3 to 4 Year Olds | 0 (0.0%) | 0 (0.0%) |
| 5 to 9 Year Old | 19 (100.0%) | 0 (0.0%) |
| 10 to 14 Year Olds | 0 (0.0%) | 0 (0.0%) |
| 15 to 17 Year Olds | 0 (0.0%) | 0 (0.0%) |
| 18 to 19 Year Olds | 0 (0.0%) | 0 (0.0%) |
| 20 to 24 Year Olds | 5 (100.0%) | 0 (0.0%) |
| 25 to 34 Year Olds | 0 (0.0%) | 0 (0.0%) |
| 35 Years and over | 15 (68.2%) | 7 (31.8%) |
| Total | 39 (84.8%) | 7 (15.2%) |
Educational Attainment by Field of Study in Dorrington
Psychology (74 | 25.7%), science & technology (31 | 10.8%), engineering (28 | 9.7%), education (24 | 8.3%), and physical & health sciences (23 | 8.0%) are the most common fields of study among 288 individuals in Dorrington who have obtained a bachelor's degree or higher.
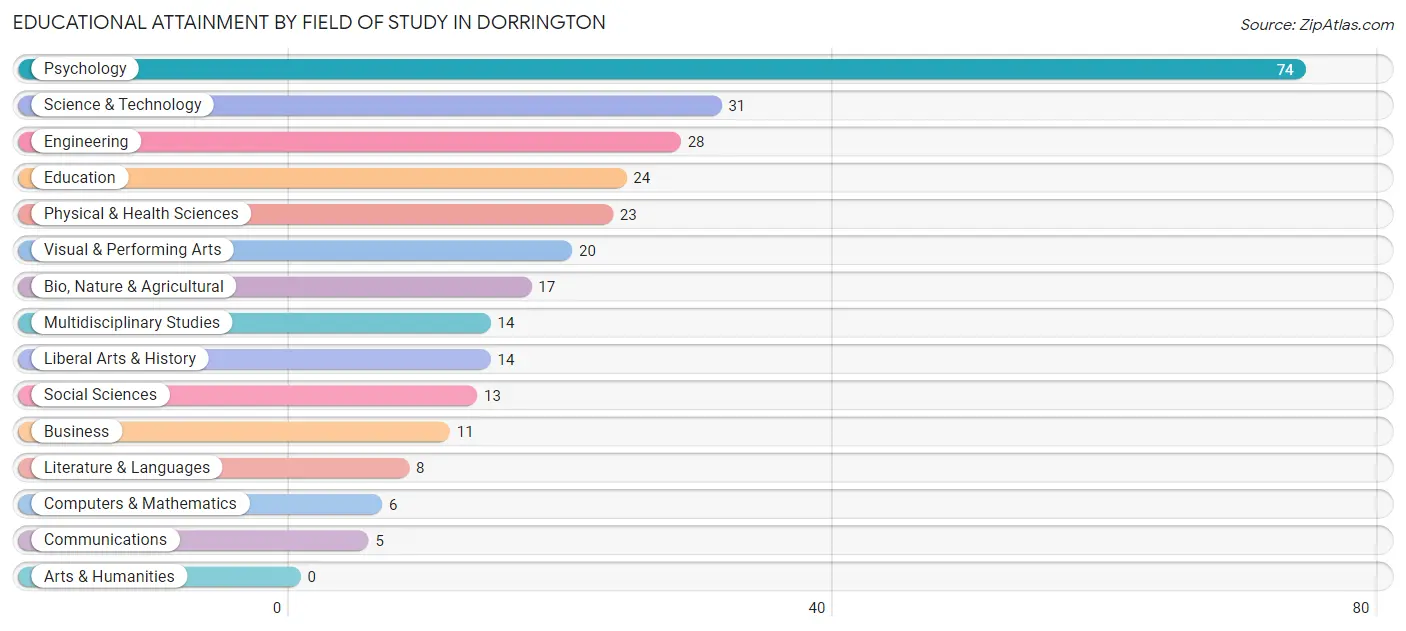
| Field of Study | # Graduates | % Graduates |
| Computers & Mathematics | 6 | 2.1% |
| Bio, Nature & Agricultural | 17 | 5.9% |
| Physical & Health Sciences | 23 | 8.0% |
| Psychology | 74 | 25.7% |
| Social Sciences | 13 | 4.5% |
| Engineering | 28 | 9.7% |
| Multidisciplinary Studies | 14 | 4.9% |
| Science & Technology | 31 | 10.8% |
| Business | 11 | 3.8% |
| Education | 24 | 8.3% |
| Literature & Languages | 8 | 2.8% |
| Liberal Arts & History | 14 | 4.9% |
| Visual & Performing Arts | 20 | 6.9% |
| Communications | 5 | 1.7% |
| Arts & Humanities | 0 | 0.0% |
| Total | 288 | 100.0% |
Transportation & Commute in Dorrington
Vehicle Availability by Sex in Dorrington
The most prevalent vehicle ownership categories in Dorrington are males with 2 vehicles (66, accounting for 71.0%) and females with 2 vehicles (21, making up 94.3%).
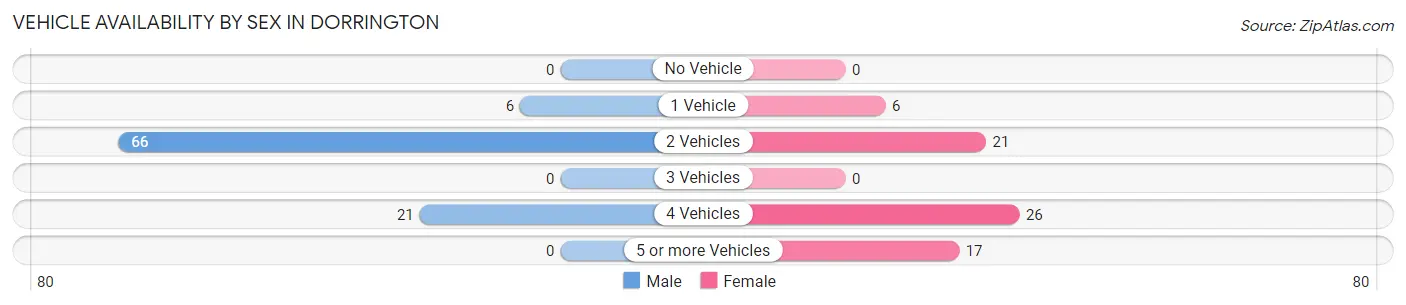
| Vehicles Available | Male | Female |
| No Vehicle | 0 (0.0%) | 0 (0.0%) |
| 1 Vehicle | 6 (6.5%) | 6 (8.6%) |
| 2 Vehicles | 66 (71.0%) | 21 (30.0%) |
| 3 Vehicles | 0 (0.0%) | 0 (0.0%) |
| 4 Vehicles | 21 (22.6%) | 26 (37.1%) |
| 5 or more Vehicles | 0 (0.0%) | 17 (24.3%) |
| Total | 93 (100.0%) | 70 (100.0%) |
Commute Time in Dorrington
The most frequently occuring commute durations in Dorrington are 10 to 14 minutes (28 commuters, 26.9%), less than 5 minutes (23 commuters, 22.1%), and 5 to 9 minutes (20 commuters, 19.2%).
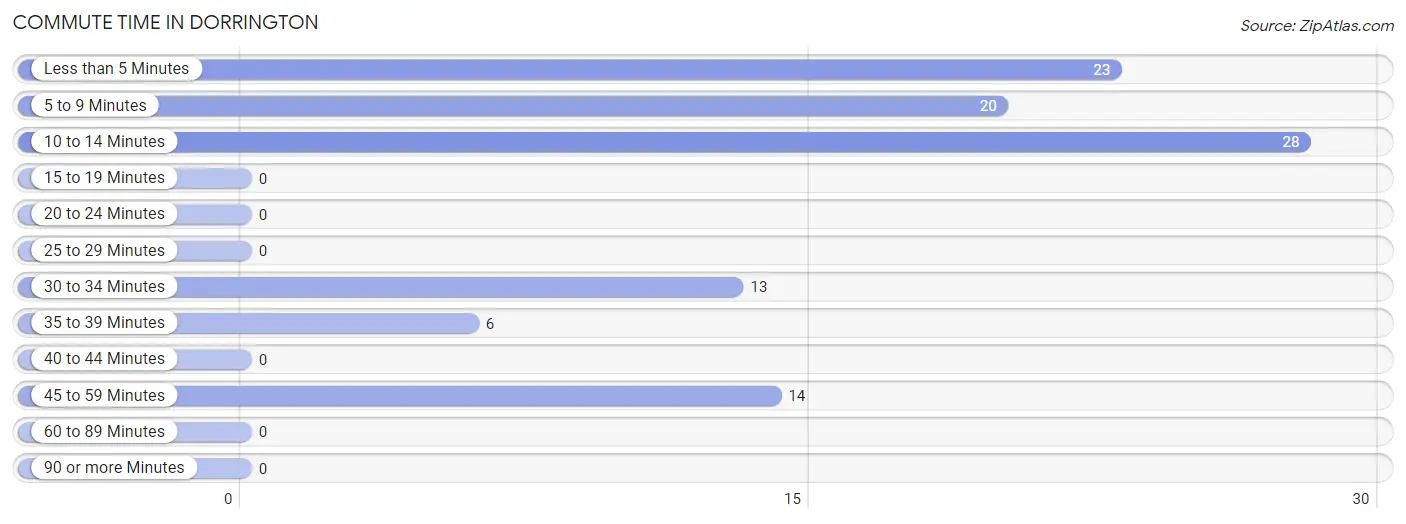
| Commute Time | # Commuters | % Commuters |
| Less than 5 Minutes | 23 | 22.1% |
| 5 to 9 Minutes | 20 | 19.2% |
| 10 to 14 Minutes | 28 | 26.9% |
| 15 to 19 Minutes | 0 | 0.0% |
| 20 to 24 Minutes | 0 | 0.0% |
| 25 to 29 Minutes | 0 | 0.0% |
| 30 to 34 Minutes | 13 | 12.5% |
| 35 to 39 Minutes | 6 | 5.8% |
| 40 to 44 Minutes | 0 | 0.0% |
| 45 to 59 Minutes | 14 | 13.5% |
| 60 to 89 Minutes | 0 | 0.0% |
| 90 or more Minutes | 0 | 0.0% |
Commute Time by Sex in Dorrington
The most common commute times in Dorrington are 10 to 14 minutes (14 commuters, 29.8%) for males and less than 5 minutes (23 commuters, 40.4%) for females.
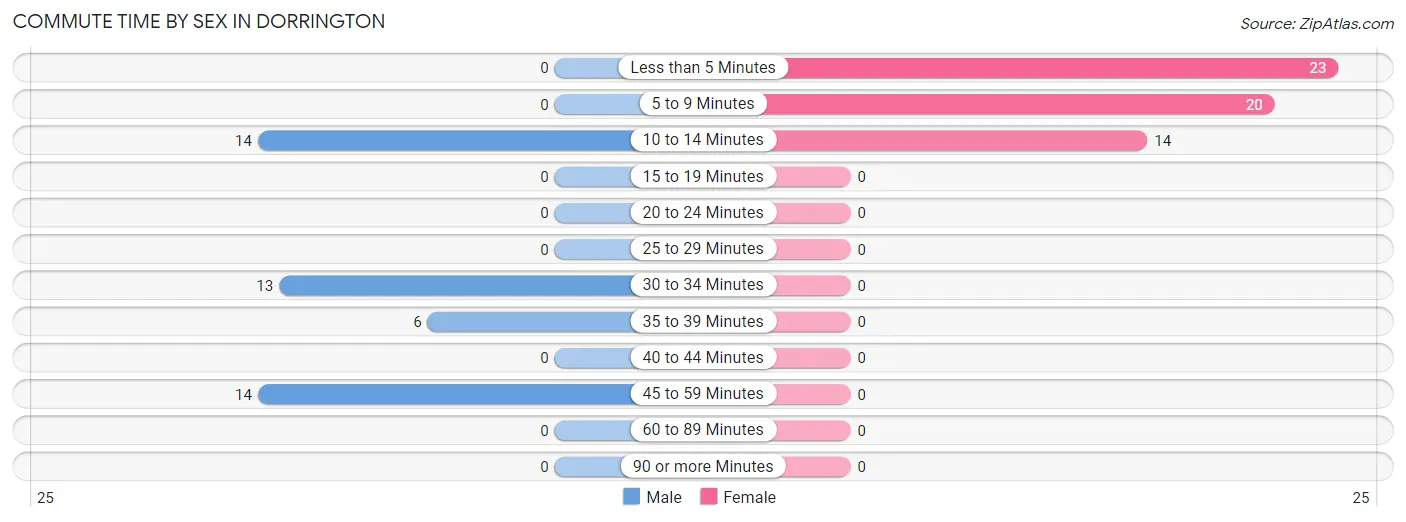
| Commute Time | Male | Female |
| Less than 5 Minutes | 0 (0.0%) | 23 (40.4%) |
| 5 to 9 Minutes | 0 (0.0%) | 20 (35.1%) |
| 10 to 14 Minutes | 14 (29.8%) | 14 (24.6%) |
| 15 to 19 Minutes | 0 (0.0%) | 0 (0.0%) |
| 20 to 24 Minutes | 0 (0.0%) | 0 (0.0%) |
| 25 to 29 Minutes | 0 (0.0%) | 0 (0.0%) |
| 30 to 34 Minutes | 13 (27.7%) | 0 (0.0%) |
| 35 to 39 Minutes | 6 (12.8%) | 0 (0.0%) |
| 40 to 44 Minutes | 0 (0.0%) | 0 (0.0%) |
| 45 to 59 Minutes | 14 (29.8%) | 0 (0.0%) |
| 60 to 89 Minutes | 0 (0.0%) | 0 (0.0%) |
| 90 or more Minutes | 0 (0.0%) | 0 (0.0%) |
Time of Departure to Work by Sex in Dorrington
The most frequent times of departure to work in Dorrington are 5:30 AM to 5:59 AM (20, 42.5%) for males and 10:00 AM to 10:59 AM (37, 64.9%) for females.
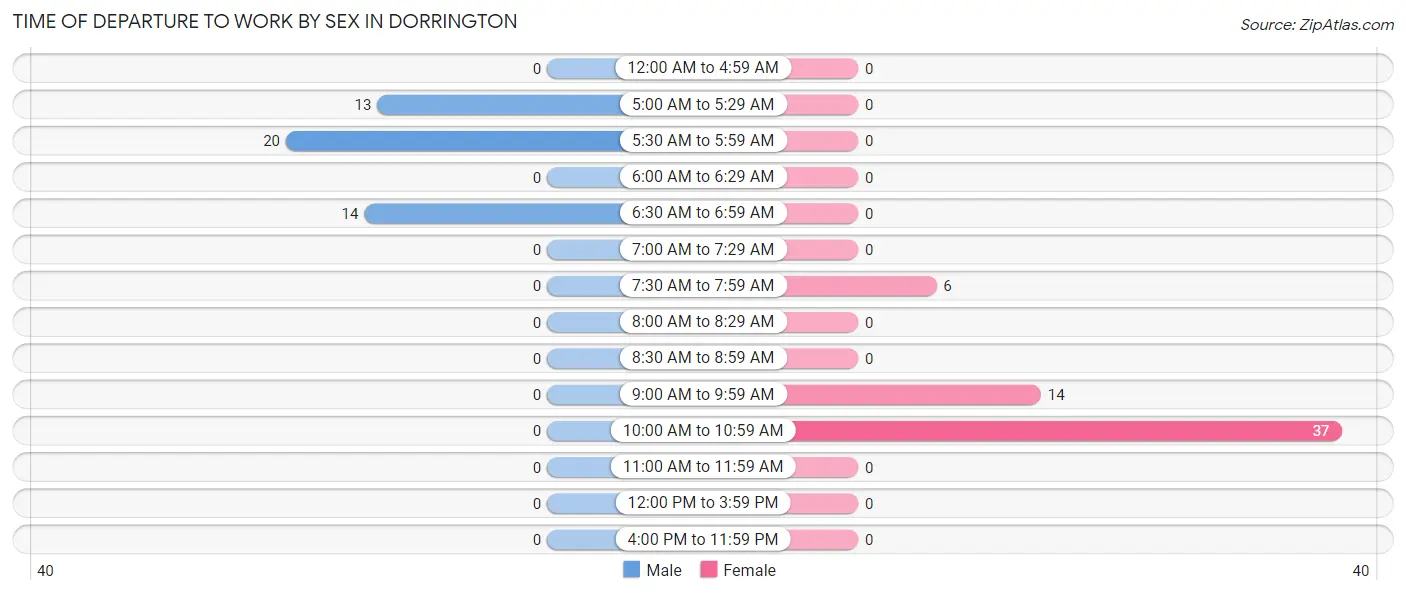
| Time of Departure | Male | Female |
| 12:00 AM to 4:59 AM | 0 (0.0%) | 0 (0.0%) |
| 5:00 AM to 5:29 AM | 13 (27.7%) | 0 (0.0%) |
| 5:30 AM to 5:59 AM | 20 (42.5%) | 0 (0.0%) |
| 6:00 AM to 6:29 AM | 0 (0.0%) | 0 (0.0%) |
| 6:30 AM to 6:59 AM | 14 (29.8%) | 0 (0.0%) |
| 7:00 AM to 7:29 AM | 0 (0.0%) | 0 (0.0%) |
| 7:30 AM to 7:59 AM | 0 (0.0%) | 6 (10.5%) |
| 8:00 AM to 8:29 AM | 0 (0.0%) | 0 (0.0%) |
| 8:30 AM to 8:59 AM | 0 (0.0%) | 0 (0.0%) |
| 9:00 AM to 9:59 AM | 0 (0.0%) | 14 (24.6%) |
| 10:00 AM to 10:59 AM | 0 (0.0%) | 37 (64.9%) |
| 11:00 AM to 11:59 AM | 0 (0.0%) | 0 (0.0%) |
| 12:00 PM to 3:59 PM | 0 (0.0%) | 0 (0.0%) |
| 4:00 PM to 11:59 PM | 0 (0.0%) | 0 (0.0%) |
| Total | 47 (100.0%) | 57 (100.0%) |
Housing Occupancy in Dorrington
Occupancy by Ownership in Dorrington
Of the total 247 dwellings in Dorrington, owner-occupied units account for 233 (94.3%), while renter-occupied units make up 14 (5.7%).
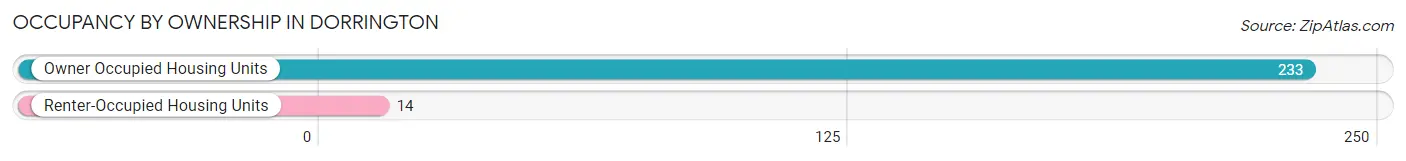
| Occupancy | # Housing Units | % Housing Units |
| Owner Occupied Housing Units | 233 | 94.3% |
| Renter-Occupied Housing Units | 14 | 5.7% |
| Total Occupied Housing Units | 247 | 100.0% |
Occupancy by Household Size in Dorrington
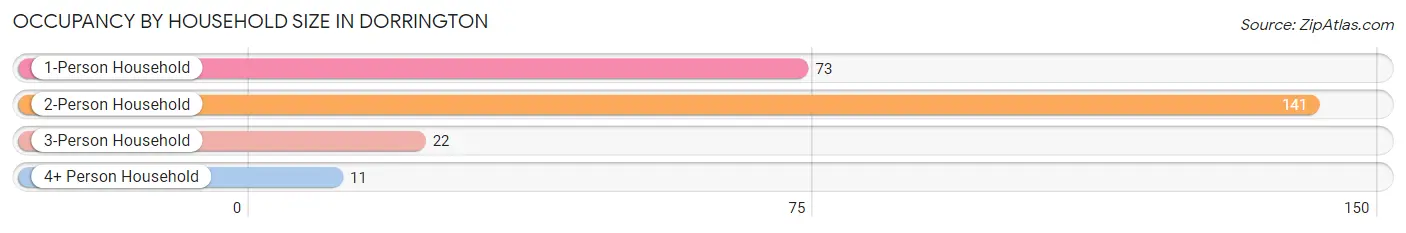
| Household Size | # Housing Units | % Housing Units |
| 1-Person Household | 73 | 29.5% |
| 2-Person Household | 141 | 57.1% |
| 3-Person Household | 22 | 8.9% |
| 4+ Person Household | 11 | 4.4% |
| Total Housing Units | 247 | 100.0% |
Occupancy by Ownership by Household Size in Dorrington
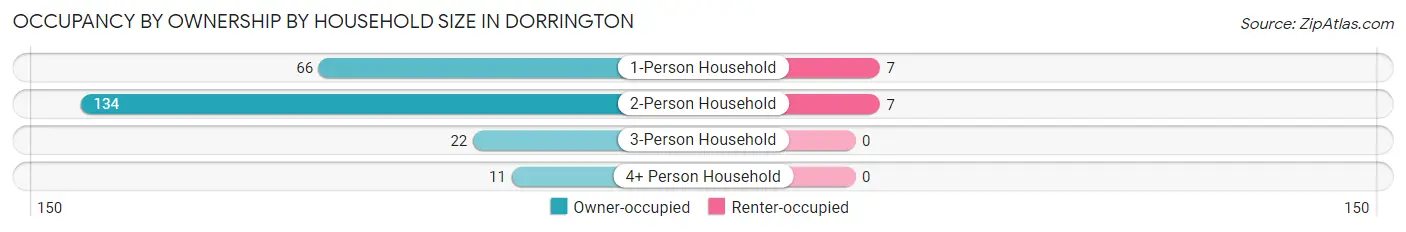
| Household Size | Owner-occupied | Renter-occupied |
| 1-Person Household | 66 (90.4%) | 7 (9.6%) |
| 2-Person Household | 134 (95.0%) | 7 (5.0%) |
| 3-Person Household | 22 (100.0%) | 0 (0.0%) |
| 4+ Person Household | 11 (100.0%) | 0 (0.0%) |
| Total Housing Units | 233 (94.3%) | 14 (5.7%) |
Occupancy by Educational Attainment in Dorrington
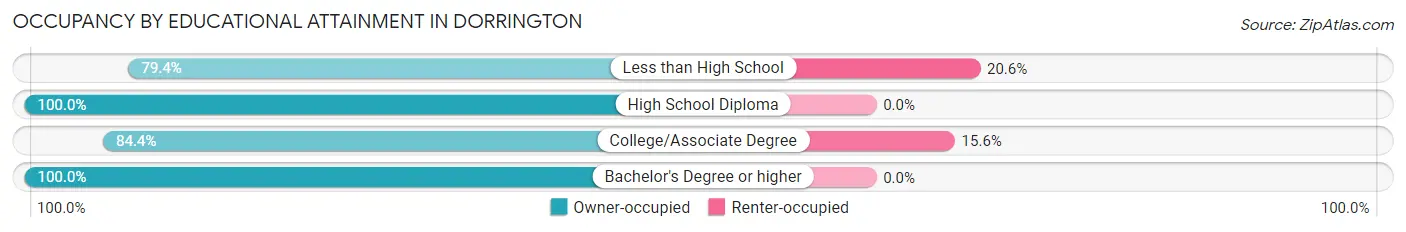
| Household Size | Owner-occupied | Renter-occupied |
| Less than High School | 27 (79.4%) | 7 (20.6%) |
| High School Diploma | 36 (100.0%) | 0 (0.0%) |
| College/Associate Degree | 38 (84.4%) | 7 (15.6%) |
| Bachelor's Degree or higher | 132 (100.0%) | 0 (0.0%) |
Occupancy by Age of Householder in Dorrington
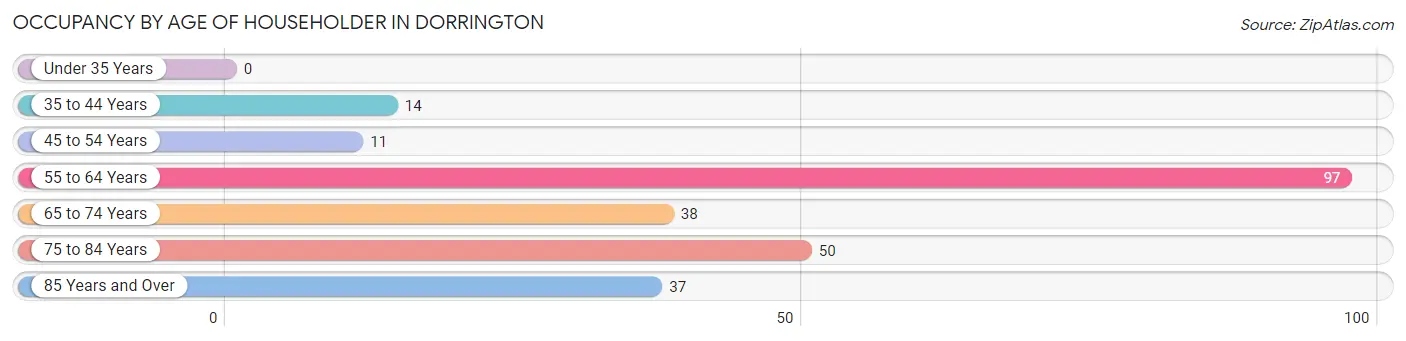
| Age Bracket | # Households | % Households |
| Under 35 Years | 0 | 0.0% |
| 35 to 44 Years | 14 | 5.7% |
| 45 to 54 Years | 11 | 4.4% |
| 55 to 64 Years | 97 | 39.3% |
| 65 to 74 Years | 38 | 15.4% |
| 75 to 84 Years | 50 | 20.2% |
| 85 Years and Over | 37 | 15.0% |
| Total | 247 | 100.0% |
Housing Finances in Dorrington
Median Income by Occupancy in Dorrington
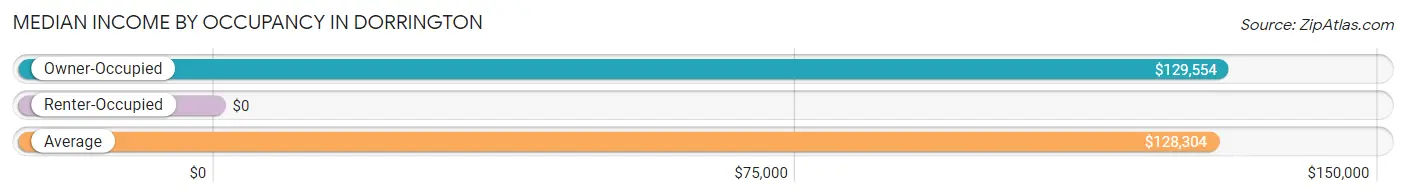
| Occupancy Type | # Households | Median Income |
| Owner-Occupied | 233 (94.3%) | $129,554 |
| Renter-Occupied | 14 (5.7%) | $0 |
| Average | 247 (100.0%) | $128,304 |
Occupancy by Householder Income Bracket in Dorrington
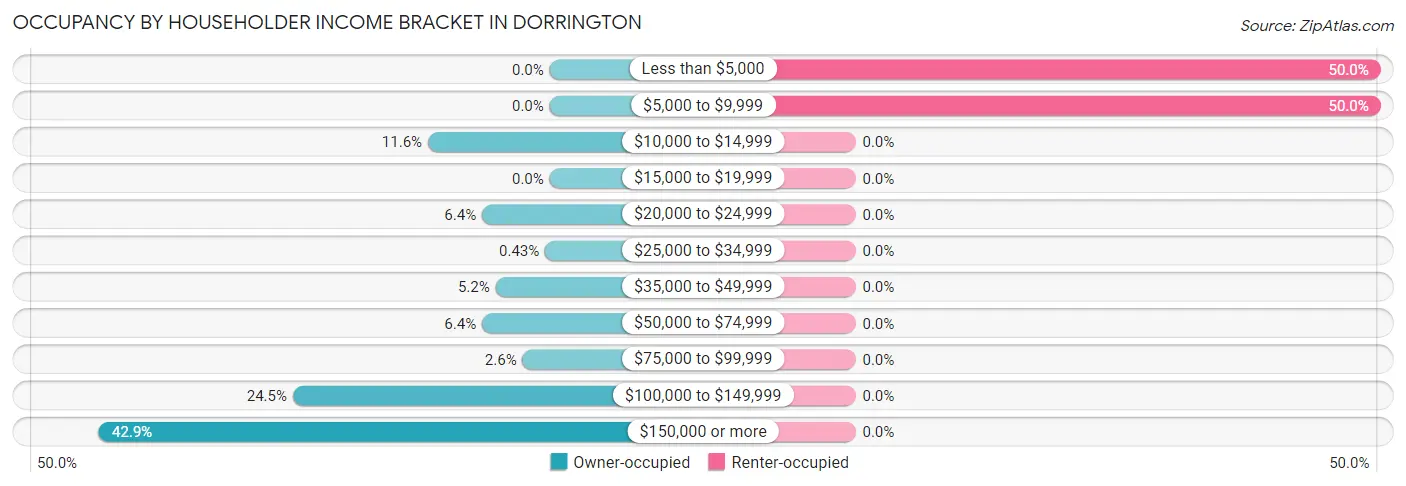
| Income Bracket | Owner-occupied | Renter-occupied |
| Less than $5,000 | 0 (0.0%) | 7 (50.0%) |
| $5,000 to $9,999 | 0 (0.0%) | 7 (50.0%) |
| $10,000 to $14,999 | 27 (11.6%) | 0 (0.0%) |
| $15,000 to $19,999 | 0 (0.0%) | 0 (0.0%) |
| $20,000 to $24,999 | 15 (6.4%) | 0 (0.0%) |
| $25,000 to $34,999 | 1 (0.4%) | 0 (0.0%) |
| $35,000 to $49,999 | 12 (5.1%) | 0 (0.0%) |
| $50,000 to $74,999 | 15 (6.4%) | 0 (0.0%) |
| $75,000 to $99,999 | 6 (2.6%) | 0 (0.0%) |
| $100,000 to $149,999 | 57 (24.5%) | 0 (0.0%) |
| $150,000 or more | 100 (42.9%) | 0 (0.0%) |
| Total | 233 (100.0%) | 14 (100.0%) |
Monthly Housing Cost Tiers in Dorrington
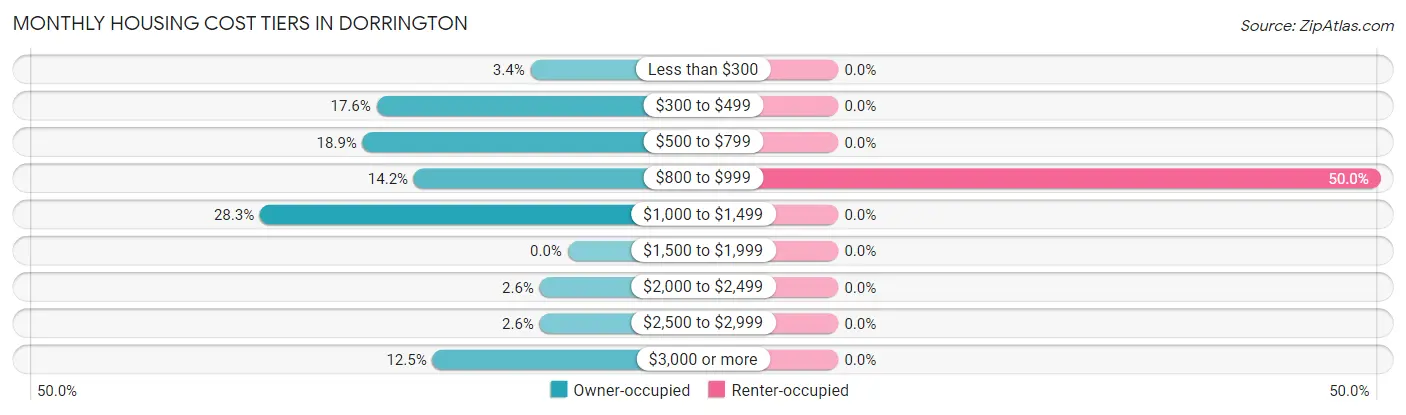
| Monthly Cost | Owner-occupied | Renter-occupied |
| Less than $300 | 8 (3.4%) | 0 (0.0%) |
| $300 to $499 | 41 (17.6%) | 0 (0.0%) |
| $500 to $799 | 44 (18.9%) | 0 (0.0%) |
| $800 to $999 | 33 (14.2%) | 7 (50.0%) |
| $1,000 to $1,499 | 66 (28.3%) | 0 (0.0%) |
| $1,500 to $1,999 | 0 (0.0%) | 0 (0.0%) |
| $2,000 to $2,499 | 6 (2.6%) | 0 (0.0%) |
| $2,500 to $2,999 | 6 (2.6%) | 0 (0.0%) |
| $3,000 or more | 29 (12.4%) | 0 (0.0%) |
| Total | 233 (100.0%) | 14 (100.0%) |
Physical Housing Characteristics in Dorrington
Housing Structures in Dorrington
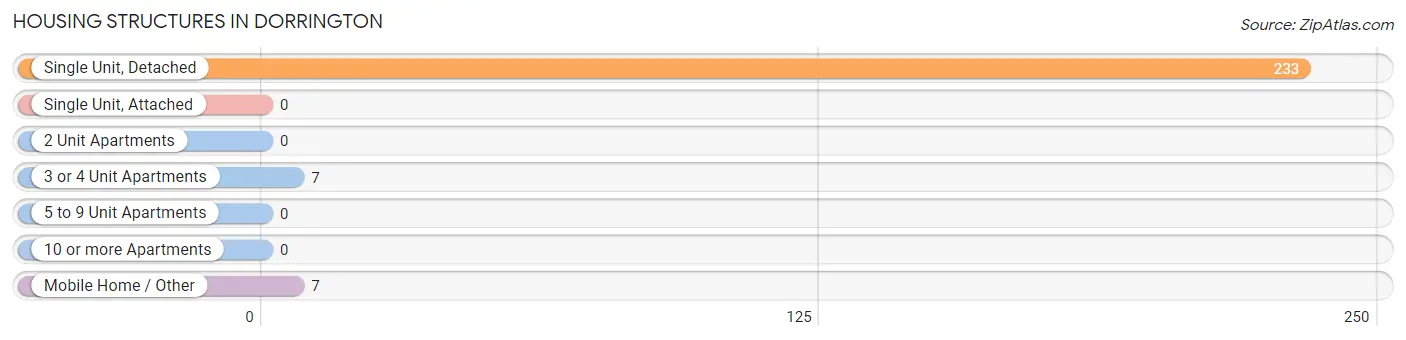
| Structure Type | # Housing Units | % Housing Units |
| Single Unit, Detached | 233 | 94.3% |
| Single Unit, Attached | 0 | 0.0% |
| 2 Unit Apartments | 0 | 0.0% |
| 3 or 4 Unit Apartments | 7 | 2.8% |
| 5 to 9 Unit Apartments | 0 | 0.0% |
| 10 or more Apartments | 0 | 0.0% |
| Mobile Home / Other | 7 | 2.8% |
| Total | 247 | 100.0% |
Housing Structures by Occupancy in Dorrington
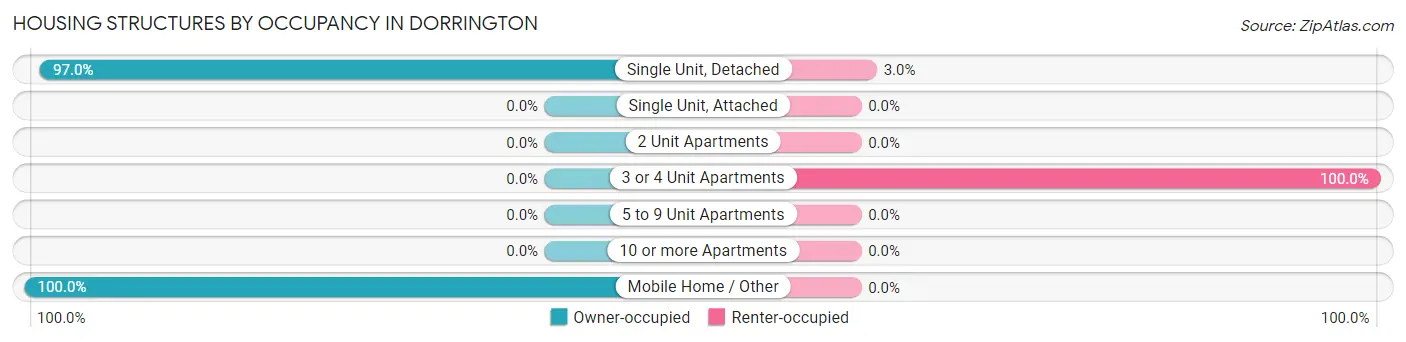
| Structure Type | Owner-occupied | Renter-occupied |
| Single Unit, Detached | 226 (97.0%) | 7 (3.0%) |
| Single Unit, Attached | 0 (0.0%) | 0 (0.0%) |
| 2 Unit Apartments | 0 (0.0%) | 0 (0.0%) |
| 3 or 4 Unit Apartments | 0 (0.0%) | 7 (100.0%) |
| 5 to 9 Unit Apartments | 0 (0.0%) | 0 (0.0%) |
| 10 or more Apartments | 0 (0.0%) | 0 (0.0%) |
| Mobile Home / Other | 7 (100.0%) | 0 (0.0%) |
| Total | 233 (94.3%) | 14 (5.7%) |
Housing Structures by Number of Rooms in Dorrington
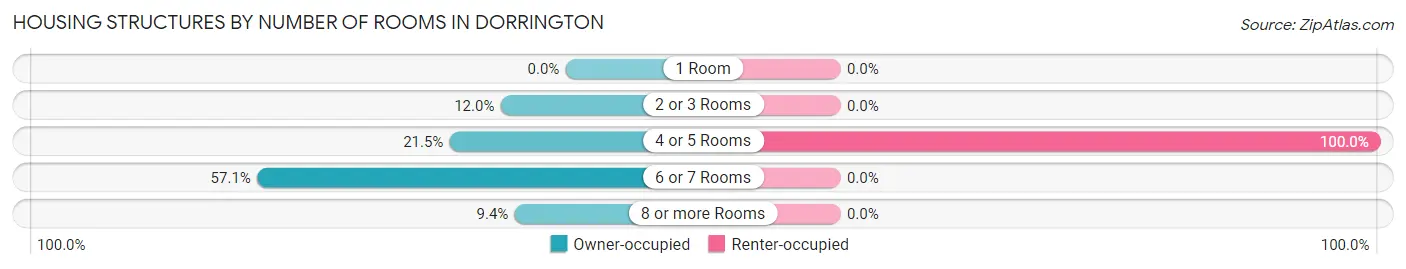
| Number of Rooms | Owner-occupied | Renter-occupied |
| 1 Room | 0 (0.0%) | 0 (0.0%) |
| 2 or 3 Rooms | 28 (12.0%) | 0 (0.0%) |
| 4 or 5 Rooms | 50 (21.5%) | 14 (100.0%) |
| 6 or 7 Rooms | 133 (57.1%) | 0 (0.0%) |
| 8 or more Rooms | 22 (9.4%) | 0 (0.0%) |
| Total | 233 (100.0%) | 14 (100.0%) |
Housing Structure by Heating Type in Dorrington
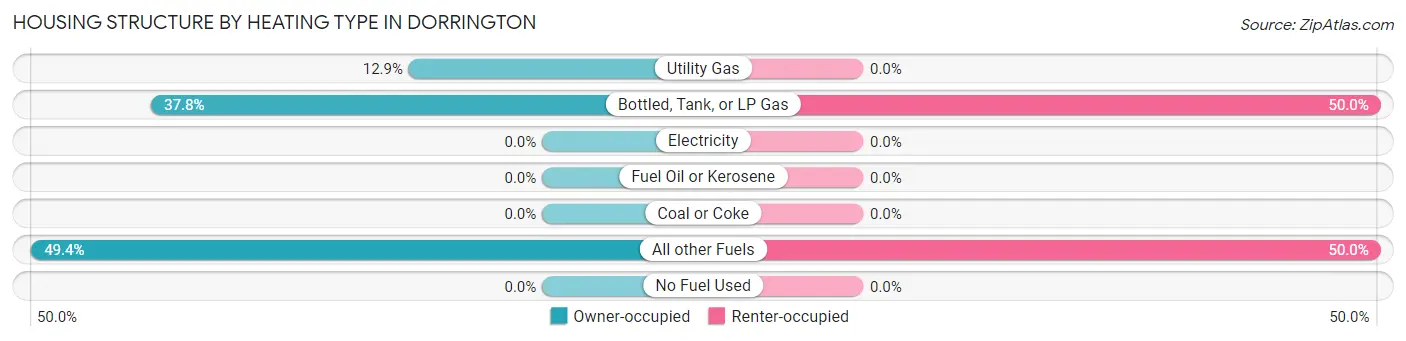
| Heating Type | Owner-occupied | Renter-occupied |
| Utility Gas | 30 (12.9%) | 0 (0.0%) |
| Bottled, Tank, or LP Gas | 88 (37.8%) | 7 (50.0%) |
| Electricity | 0 (0.0%) | 0 (0.0%) |
| Fuel Oil or Kerosene | 0 (0.0%) | 0 (0.0%) |
| Coal or Coke | 0 (0.0%) | 0 (0.0%) |
| All other Fuels | 115 (49.4%) | 7 (50.0%) |
| No Fuel Used | 0 (0.0%) | 0 (0.0%) |
| Total | 233 (100.0%) | 14 (100.0%) |
Household Vehicle Usage in Dorrington
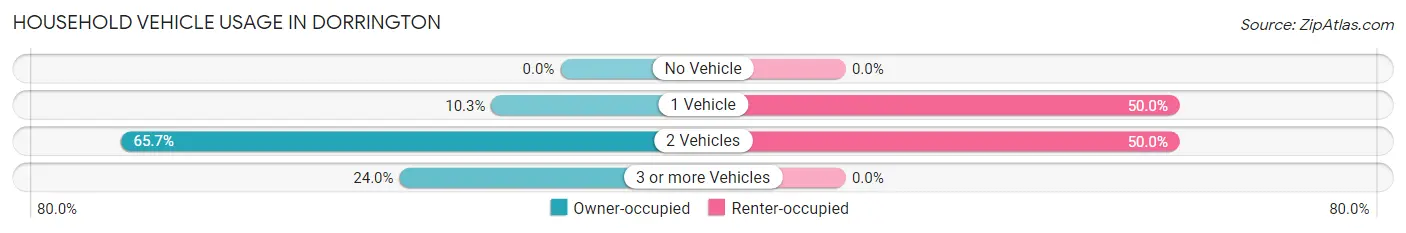
| Vehicles per Household | Owner-occupied | Renter-occupied |
| No Vehicle | 0 (0.0%) | 0 (0.0%) |
| 1 Vehicle | 24 (10.3%) | 7 (50.0%) |
| 2 Vehicles | 153 (65.7%) | 7 (50.0%) |
| 3 or more Vehicles | 56 (24.0%) | 0 (0.0%) |
| Total | 233 (100.0%) | 14 (100.0%) |
Real Estate & Mortgages in Dorrington
Real Estate and Mortgage Overview in Dorrington
| Characteristic | Without Mortgage | With Mortgage |
| Housing Units | 118 | 115 |
| Median Property Value | $394,700 | $390,700 |
| Median Household Income | $123,125 | $64 |
| Monthly Housing Costs | $633 | $29 |
| Real Estate Taxes | $2,368 | $0 |
Property Value by Mortgage Status in Dorrington
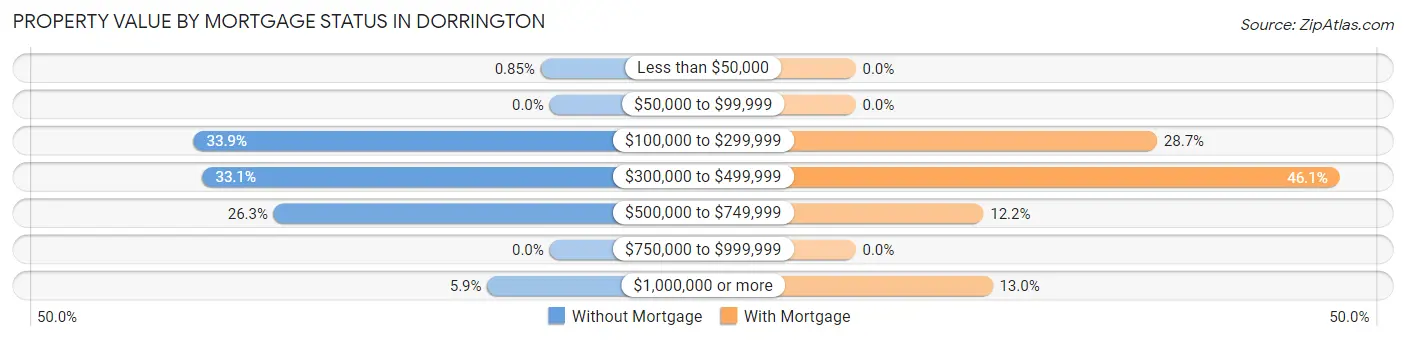
| Property Value | Without Mortgage | With Mortgage |
| Less than $50,000 | 1 (0.9%) | 0 (0.0%) |
| $50,000 to $99,999 | 0 (0.0%) | 0 (0.0%) |
| $100,000 to $299,999 | 40 (33.9%) | 33 (28.7%) |
| $300,000 to $499,999 | 39 (33.1%) | 53 (46.1%) |
| $500,000 to $749,999 | 31 (26.3%) | 14 (12.2%) |
| $750,000 to $999,999 | 0 (0.0%) | 0 (0.0%) |
| $1,000,000 or more | 7 (5.9%) | 15 (13.0%) |
| Total | 118 (100.0%) | 115 (100.0%) |
Household Income by Mortgage Status in Dorrington
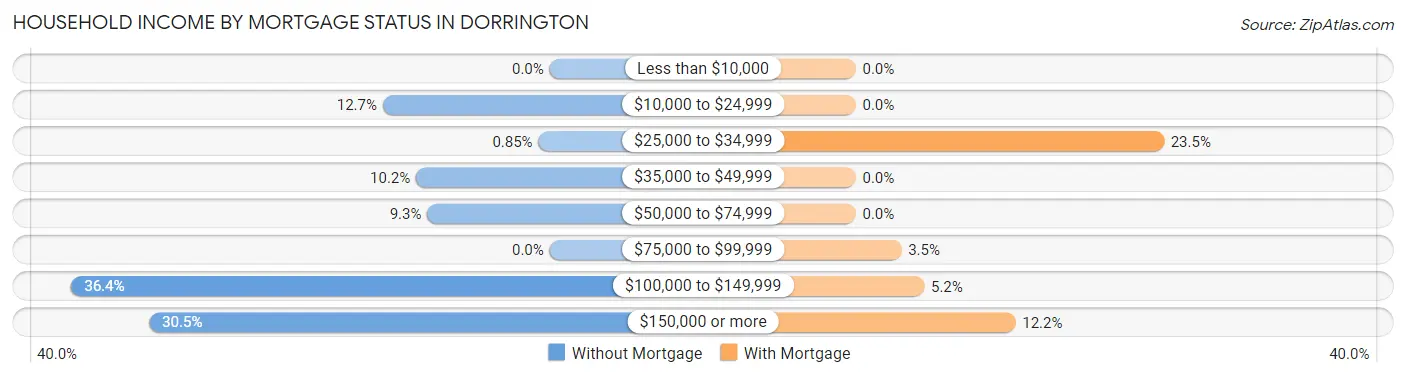
| Household Income | Without Mortgage | With Mortgage |
| Less than $10,000 | 0 (0.0%) | 0 (0.0%) |
| $10,000 to $24,999 | 15 (12.7%) | 0 (0.0%) |
| $25,000 to $34,999 | 1 (0.9%) | 27 (23.5%) |
| $35,000 to $49,999 | 12 (10.2%) | 0 (0.0%) |
| $50,000 to $74,999 | 11 (9.3%) | 0 (0.0%) |
| $75,000 to $99,999 | 0 (0.0%) | 4 (3.5%) |
| $100,000 to $149,999 | 43 (36.4%) | 6 (5.2%) |
| $150,000 or more | 36 (30.5%) | 14 (12.2%) |
| Total | 118 (100.0%) | 115 (100.0%) |
Property Value to Household Income Ratio in Dorrington
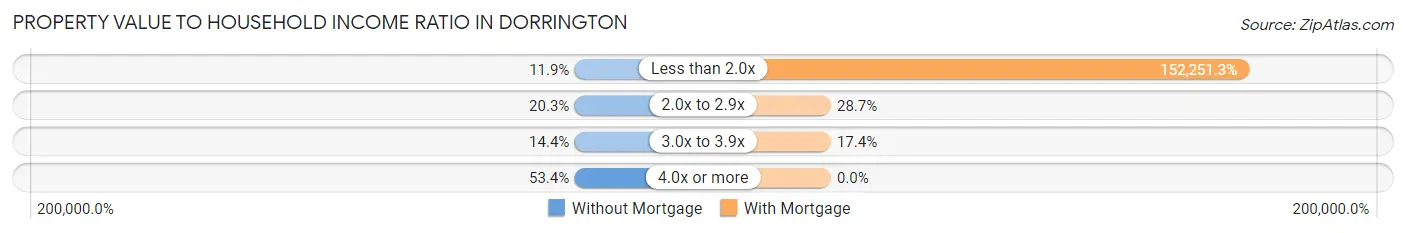
| Value-to-Income Ratio | Without Mortgage | With Mortgage |
| Less than 2.0x | 14 (11.9%) | 175,089 (152,251.3%) |
| 2.0x to 2.9x | 24 (20.3%) | 33 (28.7%) |
| 3.0x to 3.9x | 17 (14.4%) | 20 (17.4%) |
| 4.0x or more | 63 (53.4%) | 0 (0.0%) |
| Total | 118 (100.0%) | 115 (100.0%) |
Real Estate Taxes by Mortgage Status in Dorrington
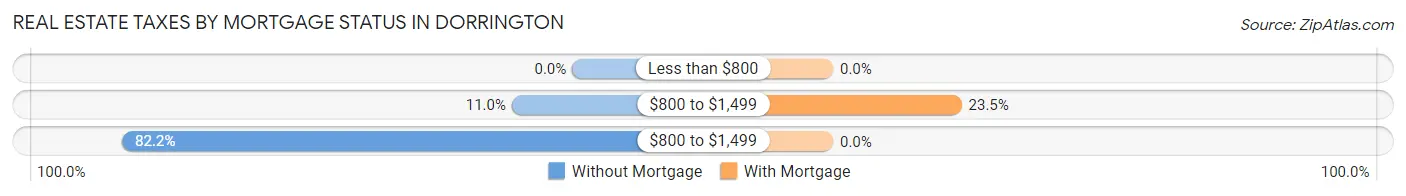
| Property Taxes | Without Mortgage | With Mortgage |
| Less than $800 | 0 (0.0%) | 0 (0.0%) |
| $800 to $1,499 | 13 (11.0%) | 27 (23.5%) |
| $800 to $1,499 | 97 (82.2%) | 0 (0.0%) |
| Total | 118 (100.0%) | 115 (100.0%) |
Health & Disability in Dorrington
Health Insurance Coverage by Age in Dorrington
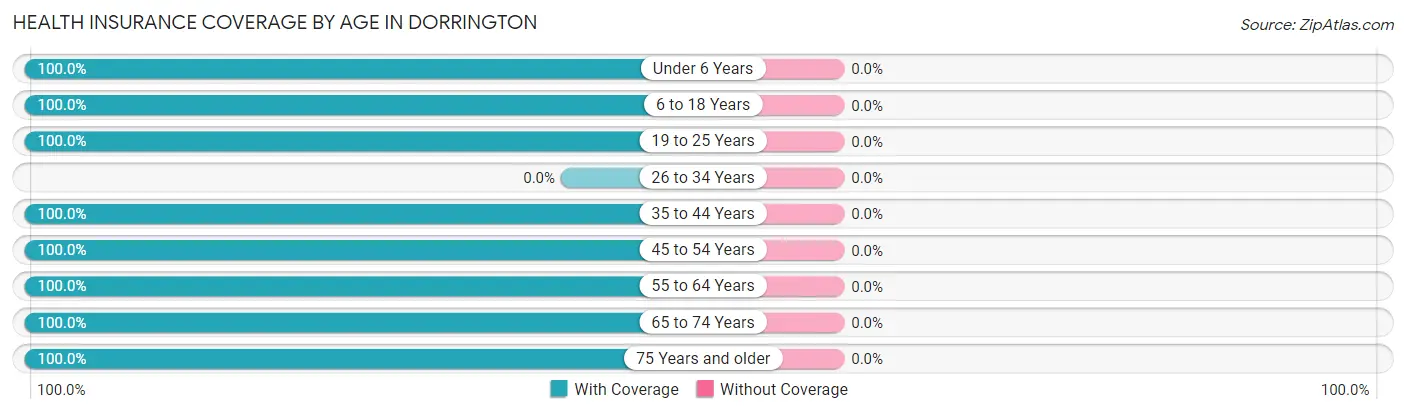
| Age Bracket | With Coverage | Without Coverage |
| Under 6 Years | 17 (100.0%) | 0 (0.0%) |
| 6 to 18 Years | 19 (100.0%) | 0 (0.0%) |
| 19 to 25 Years | 22 (100.0%) | 0 (0.0%) |
| 26 to 34 Years | 0 (0.0%) | 0 (0.0%) |
| 35 to 44 Years | 30 (100.0%) | 0 (0.0%) |
| 45 to 54 Years | 18 (100.0%) | 0 (0.0%) |
| 55 to 64 Years | 149 (100.0%) | 0 (0.0%) |
| 65 to 74 Years | 85 (100.0%) | 0 (0.0%) |
| 75 Years and older | 158 (100.0%) | 0 (0.0%) |
| Total | 498 (100.0%) | 0 (0.0%) |
Health Insurance Coverage by Citizenship Status in Dorrington
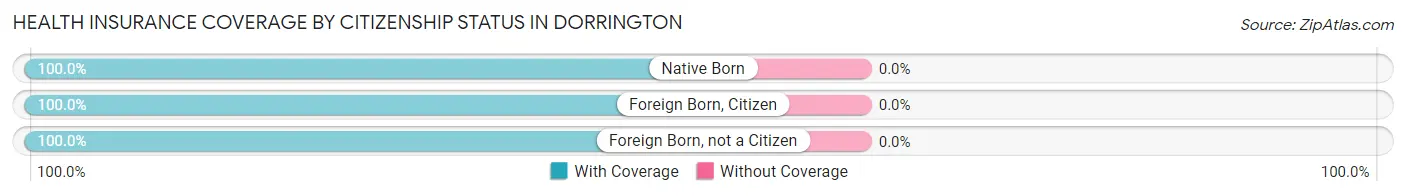
| Citizenship Status | With Coverage | Without Coverage |
| Native Born | 17 (100.0%) | 0 (0.0%) |
| Foreign Born, Citizen | 19 (100.0%) | 0 (0.0%) |
| Foreign Born, not a Citizen | 22 (100.0%) | 0 (0.0%) |
Health Insurance Coverage by Household Income in Dorrington
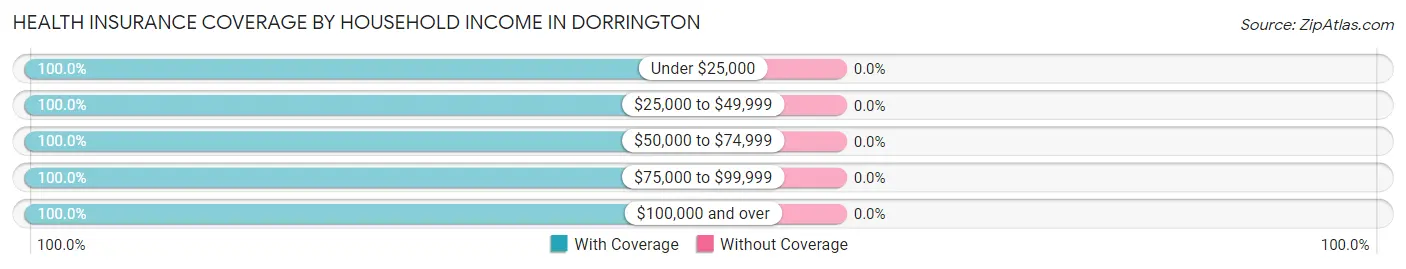
| Household Income | With Coverage | Without Coverage |
| Under $25,000 | 76 (100.0%) | 0 (0.0%) |
| $25,000 to $49,999 | 22 (100.0%) | 0 (0.0%) |
| $50,000 to $74,999 | 20 (100.0%) | 0 (0.0%) |
| $75,000 to $99,999 | 12 (100.0%) | 0 (0.0%) |
| $100,000 and over | 366 (100.0%) | 0 (0.0%) |
Public vs Private Health Insurance Coverage by Age in Dorrington
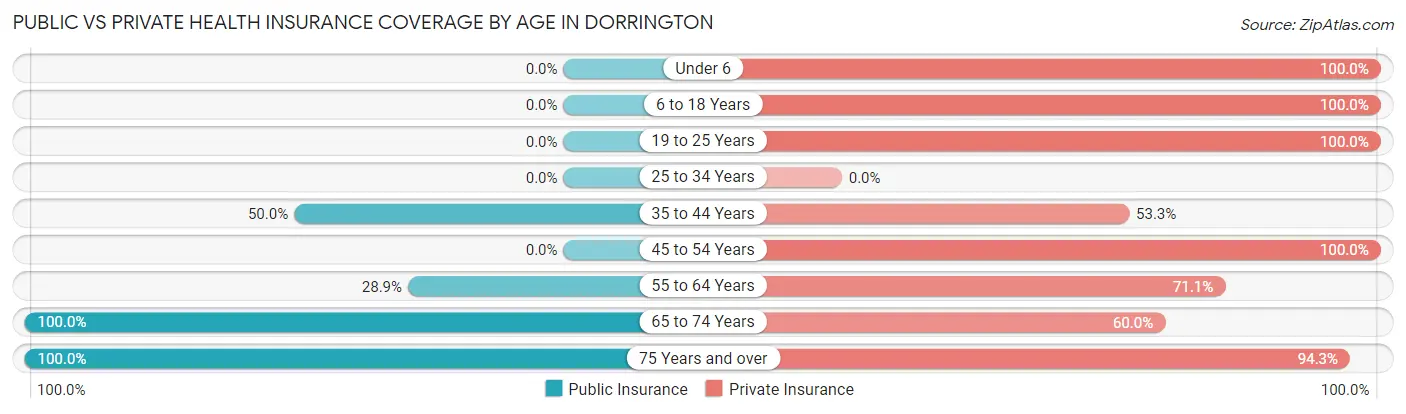
| Age Bracket | Public Insurance | Private Insurance |
| Under 6 | 0 (0.0%) | 17 (100.0%) |
| 6 to 18 Years | 0 (0.0%) | 19 (100.0%) |
| 19 to 25 Years | 0 (0.0%) | 22 (100.0%) |
| 25 to 34 Years | 0 (0.0%) | 0 (0.0%) |
| 35 to 44 Years | 15 (50.0%) | 16 (53.3%) |
| 45 to 54 Years | 0 (0.0%) | 18 (100.0%) |
| 55 to 64 Years | 43 (28.9%) | 106 (71.1%) |
| 65 to 74 Years | 85 (100.0%) | 51 (60.0%) |
| 75 Years and over | 158 (100.0%) | 149 (94.3%) |
| Total | 301 (60.4%) | 398 (79.9%) |
Disability Status by Sex by Age in Dorrington
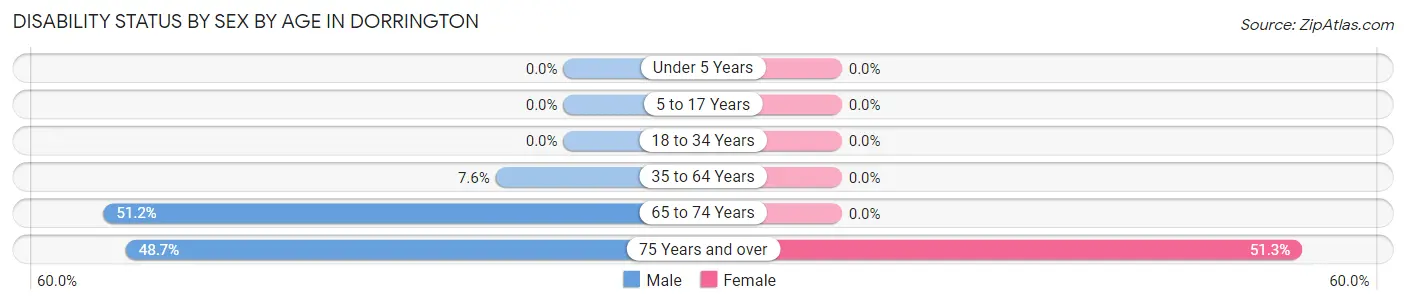
| Age Bracket | Male | Female |
| Under 5 Years | 0 (0.0%) | 0 (0.0%) |
| 5 to 17 Years | 0 (0.0%) | 0 (0.0%) |
| 18 to 34 Years | 0 (0.0%) | 0 (0.0%) |
| 35 to 64 Years | 8 (7.5%) | 0 (0.0%) |
| 65 to 74 Years | 21 (51.2%) | 0 (0.0%) |
| 75 Years and over | 38 (48.7%) | 41 (51.2%) |
Disability Class by Sex by Age in Dorrington
Disability Class: Hearing Difficulty
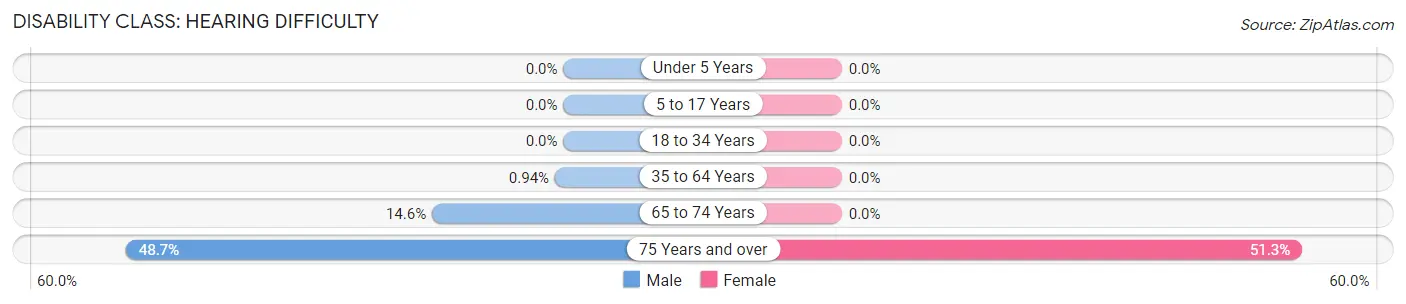
| Age Bracket | Male | Female |
| Under 5 Years | 0 (0.0%) | 0 (0.0%) |
| 5 to 17 Years | 0 (0.0%) | 0 (0.0%) |
| 18 to 34 Years | 0 (0.0%) | 0 (0.0%) |
| 35 to 64 Years | 1 (0.9%) | 0 (0.0%) |
| 65 to 74 Years | 6 (14.6%) | 0 (0.0%) |
| 75 Years and over | 38 (48.7%) | 41 (51.2%) |
Disability Class: Vision Difficulty
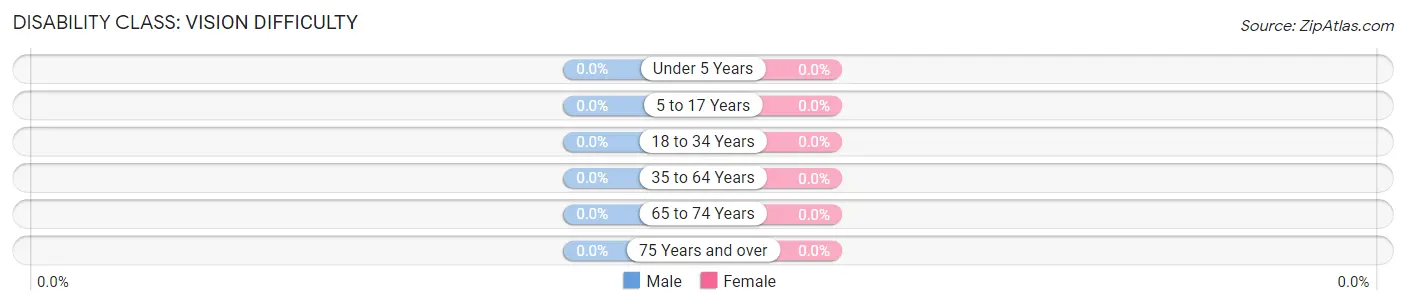
| Age Bracket | Male | Female |
| Under 5 Years | 0 (0.0%) | 0 (0.0%) |
| 5 to 17 Years | 0 (0.0%) | 0 (0.0%) |
| 18 to 34 Years | 0 (0.0%) | 0 (0.0%) |
| 35 to 64 Years | 0 (0.0%) | 0 (0.0%) |
| 65 to 74 Years | 0 (0.0%) | 0 (0.0%) |
| 75 Years and over | 0 (0.0%) | 0 (0.0%) |
Disability Class: Cognitive Difficulty
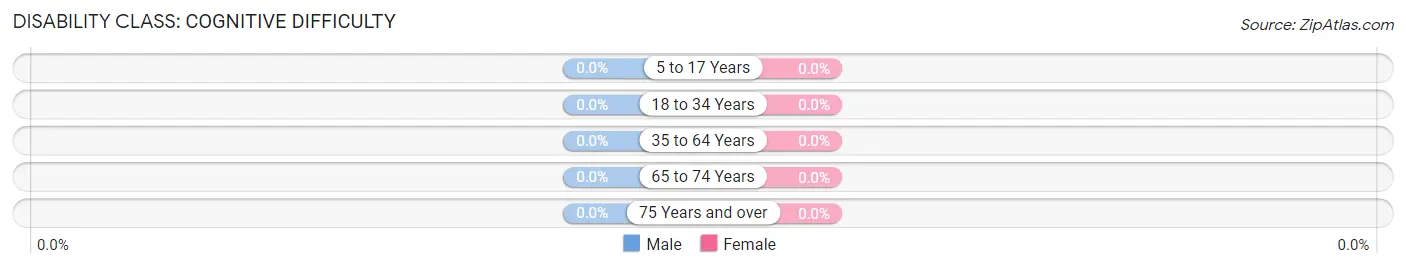
| Age Bracket | Male | Female |
| 5 to 17 Years | 0 (0.0%) | 0 (0.0%) |
| 18 to 34 Years | 0 (0.0%) | 0 (0.0%) |
| 35 to 64 Years | 0 (0.0%) | 0 (0.0%) |
| 65 to 74 Years | 0 (0.0%) | 0 (0.0%) |
| 75 Years and over | 0 (0.0%) | 0 (0.0%) |
Disability Class: Ambulatory Difficulty
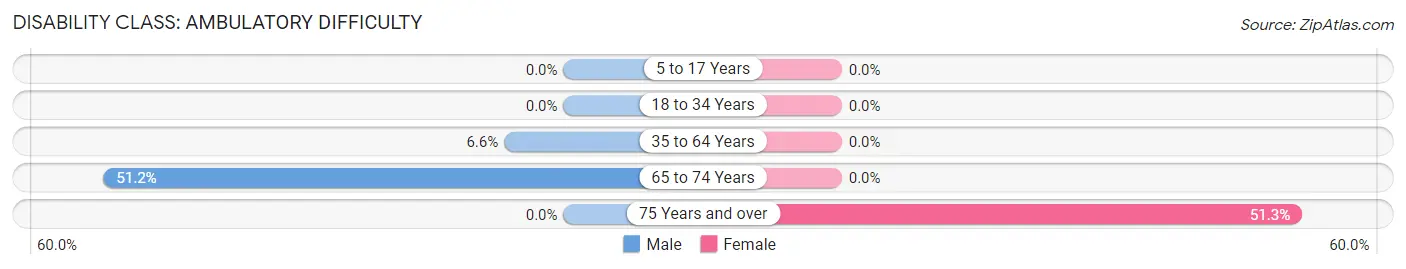
| Age Bracket | Male | Female |
| 5 to 17 Years | 0 (0.0%) | 0 (0.0%) |
| 18 to 34 Years | 0 (0.0%) | 0 (0.0%) |
| 35 to 64 Years | 7 (6.6%) | 0 (0.0%) |
| 65 to 74 Years | 21 (51.2%) | 0 (0.0%) |
| 75 Years and over | 0 (0.0%) | 41 (51.2%) |
Disability Class: Self-Care Difficulty
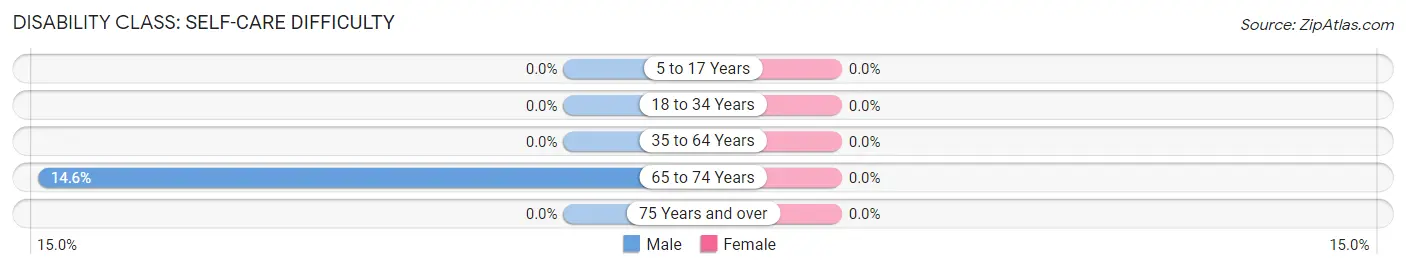
| Age Bracket | Male | Female |
| 5 to 17 Years | 0 (0.0%) | 0 (0.0%) |
| 18 to 34 Years | 0 (0.0%) | 0 (0.0%) |
| 35 to 64 Years | 0 (0.0%) | 0 (0.0%) |
| 65 to 74 Years | 6 (14.6%) | 0 (0.0%) |
| 75 Years and over | 0 (0.0%) | 0 (0.0%) |
Technology Access in Dorrington
Computing Device Access in Dorrington
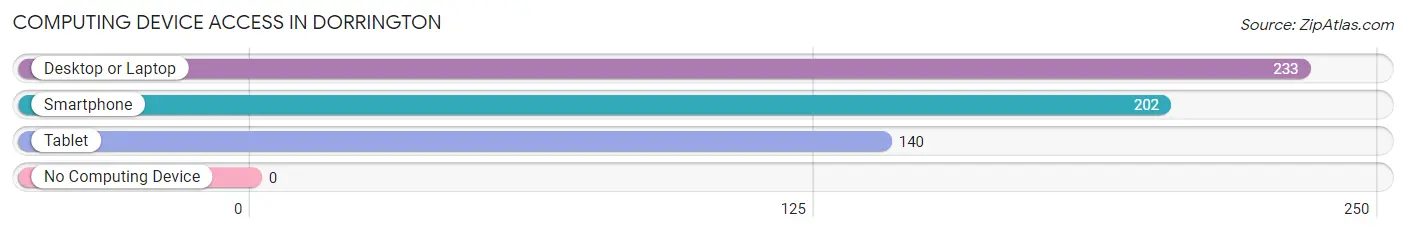
| Device Type | # Households | % Households |
| Desktop or Laptop | 233 | 94.3% |
| Smartphone | 202 | 81.8% |
| Tablet | 140 | 56.7% |
| No Computing Device | 0 | 0.0% |
| Total | 247 | 100.0% |
Internet Access in Dorrington
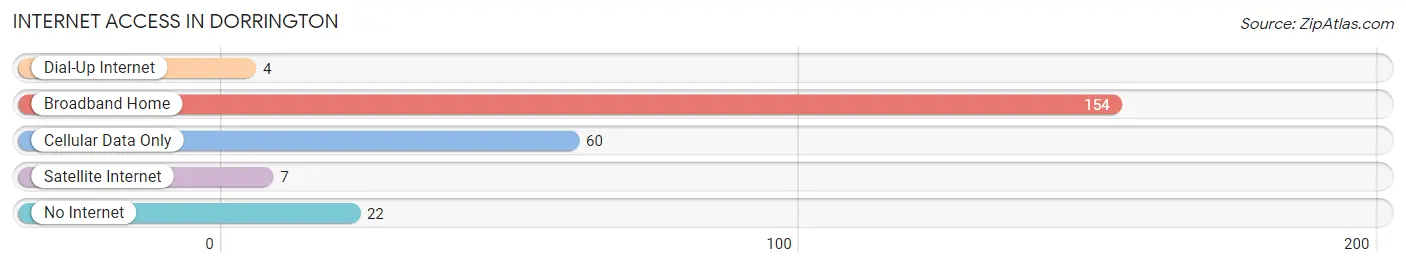
| Internet Type | # Households | % Households |
| Dial-Up Internet | 4 | 1.6% |
| Broadband Home | 154 | 62.4% |
| Cellular Data Only | 60 | 24.3% |
| Satellite Internet | 7 | 2.8% |
| No Internet | 22 | 8.9% |
| Total | 247 | 100.0% |
Dorrington Summary
Dorrington is a small unincorporated community located in Calaveras County, California. It is situated in the Sierra Nevada foothills, approximately 8 miles east of Angels Camp and 8 miles west of Arnold. The population of Dorrington was estimated to be 1,845 in 2019.
History
Dorrington was founded in 1851 by a group of miners who were searching for gold in the area. The town was named after a local miner, John Dorrington, who was one of the first to discover gold in the area. The town quickly grew as more miners arrived in search of gold. By 1852, Dorrington had a population of over 500 people and was home to several businesses, including a hotel, saloon, and general store.
In the late 1800s, Dorrington began to decline as the gold rush ended and the population dwindled. By the early 1900s, the town was nearly abandoned. In the 1920s, the town was revived when the logging industry began to take off in the area. The town was home to several lumber mills and sawmills, which provided employment for many of the residents.
Geography
Dorrington is located in the Sierra Nevada foothills, approximately 8 miles east of Angels Camp and 8 miles west of Arnold. The town is situated at an elevation of 2,400 feet and is surrounded by rolling hills and forests. The climate in Dorrington is mild, with hot summers and cold winters.
Economy
The economy of Dorrington is largely based on tourism and the logging industry. The town is home to several tourist attractions, including the Dorrington Hotel, which was built in the late 1800s and is now a popular destination for visitors. The town is also home to several logging companies, which provide employment for many of the residents.
Demographics
As of 2019, the population of Dorrington was estimated to be 1,845. The racial makeup of the town was 94.3% White, 0.7% African American, 0.7% Native American, 0.7% Asian, 0.3% Pacific Islander, and 2.7% from other races. The median household income in Dorrington was $50,000, and the median age was 44.5 years. The town is home to several churches, including the Dorrington United Methodist Church, which was founded in 1852.
Common Questions
What is Per Capita Income in Dorrington?
Per Capita income in Dorrington is $61,887.
What is the Median Family Income in Dorrington?
Median Family Income in Dorrington is $162,500.
What is the Median Household income in Dorrington?
Median Household Income in Dorrington is $128,304.
What is Inequality or Gini Index in Dorrington?
Inequality or Gini Index in Dorrington is 0.37.
What is the Total Population of Dorrington?
Total Population of Dorrington is 498.
What is the Total Male Population of Dorrington?
Total Male Population of Dorrington is 247.
What is the Total Female Population of Dorrington?
Total Female Population of Dorrington is 251.
What is the Ratio of Males per 100 Females in Dorrington?
There are 98.41 Males per 100 Females in Dorrington.
What is the Ratio of Females per 100 Males in Dorrington?
There are 101.62 Females per 100 Males in Dorrington.
What is the Median Population Age in Dorrington?
Median Population Age in Dorrington is 64.5 Years.
What is the Average Family Size in Dorrington
Average Family Size in Dorrington is 2.5 People.
What is the Average Household Size in Dorrington
Average Household Size in Dorrington is 2.0 People.
How Large is the Labor Force in Dorrington?
There are 170 People in the Labor Forcein in Dorrington.
What is the Percentage of People in the Labor Force in Dorrington?
36.8% of People are in the Labor Force in Dorrington.
What is the Unemployment Rate in Dorrington?
Unemployment Rate in Dorrington is 4.1%.