Cities with the Highest Percentage of Immigrants from Brazil in California
RELATED REPORTS & OPTIONS
Brazil
California
Compare Cities
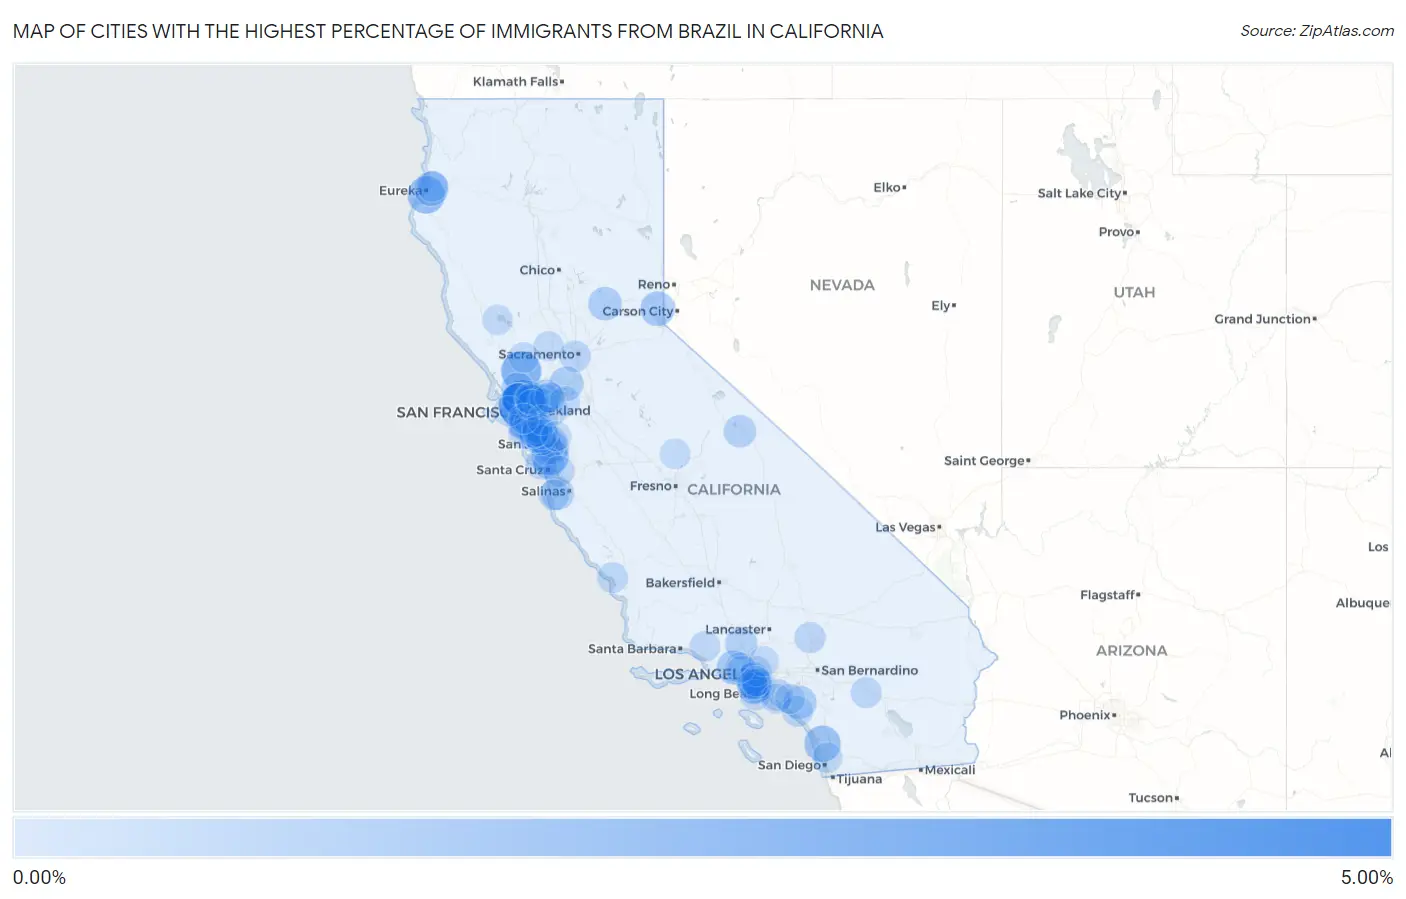
Map of Cities with the Highest Percentage of Immigrants from Brazil in California
0.00%
5.00%
Cities with the Highest Percentage of Immigrants from Brazil in California
| City | Brazil | vs State | vs National | |
| 1. | Tiburon | 4.88% | 0.14%(+4.75)#609 | 0.17%(+4.72)#3,719 |
| 2. | Eldridge | 2.60% | 0.14%(+2.47)#610 | 0.17%(+2.44)#3,720 |
| 3. | Marin City | 1.96% | 0.14%(+1.82)#611 | 0.17%(+1.79)#3,721 |
| 4. | Corte Madera | 1.95% | 0.14%(+1.81)#612 | 0.17%(+1.78)#3,722 |
| 5. | Pine Hills | 1.94% | 0.14%(+1.80)#613 | 0.17%(+1.77)#3,723 |
| 6. | Lexington Hills | 1.93% | 0.14%(+1.80)#614 | 0.17%(+1.77)#3,724 |
| 7. | Rancho Santa Fe | 1.71% | 0.14%(+1.58)#615 | 0.17%(+1.55)#3,725 |
| 8. | Richmond | 1.53% | 0.14%(+1.40)#616 | 0.17%(+1.37)#3,726 |
| 9. | Dollar Point | 1.30% | 0.14%(+1.16)#617 | 0.17%(+1.13)#3,727 |
| 10. | Indianola | 1.26% | 0.14%(+1.12)#618 | 0.17%(+1.09)#3,728 |
| 11. | Larkspur | 1.25% | 0.14%(+1.11)#619 | 0.17%(+1.08)#3,729 |
| 12. | Kentfield | 1.21% | 0.14%(+1.08)#620 | 0.17%(+1.05)#3,730 |
| 13. | Agoura Hills | 1.18% | 0.14%(+1.04)#621 | 0.17%(+1.01)#3,731 |
| 14. | Rio Vista | 1.17% | 0.14%(+1.04)#622 | 0.17%(+1.00)#3,732 |
| 15. | Millbrae | 1.09% | 0.14%(+0.951)#623 | 0.17%(+0.920)#3,733 |
| 16. | Cedar Flat | 1.05% | 0.14%(+0.920)#624 | 0.17%(+0.888)#3,734 |
| 17. | Nevada City | 1.05% | 0.14%(+0.915)#625 | 0.17%(+0.883)#3,735 |
| 18. | Pacheco | 1.03% | 0.14%(+0.896)#626 | 0.17%(+0.865)#3,736 |
| 19. | Rancho Santa Margarita | 0.97% | 0.14%(+0.835)#627 | 0.17%(+0.804)#3,737 |
| 20. | Campbell | 0.95% | 0.14%(+0.810)#628 | 0.17%(+0.779)#3,738 |
| 21. | Sand City | 0.94% | 0.14%(+0.805)#629 | 0.17%(+0.774)#3,739 |
| 22. | El Sobrante Cdp Contra Costa County | 0.92% | 0.14%(+0.781)#630 | 0.17%(+0.749)#3,740 |
| 23. | Menlo Park | 0.91% | 0.14%(+0.771)#631 | 0.17%(+0.739)#3,741 |
| 24. | Rollingwood | 0.89% | 0.14%(+0.755)#632 | 0.17%(+0.723)#3,742 |
| 25. | Belmont | 0.89% | 0.14%(+0.753)#633 | 0.17%(+0.721)#3,743 |
| 26. | Swall Meadows | 0.82% | 0.14%(+0.687)#634 | 0.17%(+0.655)#3,744 |
| 27. | Novato | 0.80% | 0.14%(+0.662)#635 | 0.17%(+0.630)#3,745 |
| 28. | Castaic | 0.79% | 0.14%(+0.653)#636 | 0.17%(+0.622)#3,746 |
| 29. | Eastern Goleta Valley | 0.79% | 0.14%(+0.653)#637 | 0.17%(+0.621)#3,747 |
| 30. | San Bruno | 0.75% | 0.14%(+0.619)#638 | 0.17%(+0.587)#3,748 |
| 31. | Hermosa Beach | 0.75% | 0.14%(+0.612)#639 | 0.17%(+0.580)#3,749 |
| 32. | La Cresta | 0.68% | 0.14%(+0.550)#640 | 0.17%(+0.518)#3,750 |
| 33. | Burlingame | 0.68% | 0.14%(+0.542)#641 | 0.17%(+0.511)#3,751 |
| 34. | Strawberry Cdp Marin County | 0.66% | 0.14%(+0.522)#642 | 0.17%(+0.490)#3,752 |
| 35. | Midway City | 0.65% | 0.14%(+0.512)#643 | 0.17%(+0.481)#3,753 |
| 36. | Mountain View | 0.63% | 0.14%(+0.499)#644 | 0.17%(+0.468)#3,754 |
| 37. | Pacifica | 0.60% | 0.14%(+0.461)#645 | 0.17%(+0.430)#3,755 |
| 38. | Saratoga | 0.59% | 0.14%(+0.459)#646 | 0.17%(+0.428)#3,756 |
| 39. | Gardena | 0.59% | 0.14%(+0.459)#647 | 0.17%(+0.428)#3,757 |
| 40. | Santa Clara | 0.56% | 0.14%(+0.425)#648 | 0.17%(+0.393)#3,758 |
| 41. | Bonny Doon | 0.56% | 0.14%(+0.425)#649 | 0.17%(+0.393)#3,759 |
| 42. | West Sacramento | 0.55% | 0.14%(+0.419)#650 | 0.17%(+0.387)#3,760 |
| 43. | Torrance | 0.55% | 0.14%(+0.418)#651 | 0.17%(+0.386)#3,761 |
| 44. | Marina Del Rey | 0.53% | 0.14%(+0.390)#652 | 0.17%(+0.359)#3,762 |
| 45. | Adelanto | 0.50% | 0.14%(+0.368)#653 | 0.17%(+0.336)#3,763 |
| 46. | San Miguel Cdp Contra Costa County | 0.50% | 0.14%(+0.364)#654 | 0.17%(+0.333)#3,764 |
| 47. | Lawndale | 0.49% | 0.14%(+0.353)#655 | 0.17%(+0.321)#3,765 |
| 48. | Scotts Valley | 0.48% | 0.14%(+0.347)#656 | 0.17%(+0.315)#3,766 |
| 49. | San Mateo | 0.48% | 0.14%(+0.346)#657 | 0.17%(+0.314)#3,767 |
| 50. | San Juan Capistrano | 0.48% | 0.14%(+0.341)#658 | 0.17%(+0.309)#3,768 |
| 51. | Ross | 0.47% | 0.14%(+0.338)#659 | 0.17%(+0.306)#3,769 |
| 52. | North Fair Oaks | 0.46% | 0.14%(+0.324)#660 | 0.17%(+0.292)#3,770 |
| 53. | Aptos Hills Larkin Valley | 0.46% | 0.14%(+0.323)#661 | 0.17%(+0.291)#3,771 |
| 54. | Woodside | 0.46% | 0.14%(+0.321)#662 | 0.17%(+0.290)#3,772 |
| 55. | Rancho Mirage | 0.45% | 0.14%(+0.317)#663 | 0.17%(+0.285)#3,773 |
| 56. | South San Francisco | 0.44% | 0.14%(+0.302)#664 | 0.17%(+0.271)#3,774 |
| 57. | Pacific Grove | 0.44% | 0.14%(+0.302)#665 | 0.17%(+0.270)#3,775 |
| 58. | Culver City | 0.43% | 0.14%(+0.298)#666 | 0.17%(+0.267)#3,776 |
| 59. | Half Moon Bay | 0.43% | 0.14%(+0.295)#667 | 0.17%(+0.263)#3,777 |
| 60. | Topanga | 0.43% | 0.14%(+0.291)#668 | 0.17%(+0.260)#3,778 |
| 61. | Redondo Beach | 0.42% | 0.14%(+0.290)#669 | 0.17%(+0.258)#3,779 |
| 62. | Cayucos | 0.42% | 0.14%(+0.288)#670 | 0.17%(+0.257)#3,780 |
| 63. | Rancho Palos Verdes | 0.42% | 0.14%(+0.288)#671 | 0.17%(+0.257)#3,781 |
| 64. | Meiners Oaks | 0.41% | 0.14%(+0.274)#672 | 0.17%(+0.242)#3,782 |
| 65. | Arcata | 0.40% | 0.14%(+0.264)#673 | 0.17%(+0.232)#3,783 |
| 66. | St Helena | 0.39% | 0.14%(+0.252)#674 | 0.17%(+0.220)#3,784 |
| 67. | Albany | 0.38% | 0.14%(+0.249)#675 | 0.17%(+0.218)#3,785 |
| 68. | Hawthorne | 0.37% | 0.14%(+0.237)#676 | 0.17%(+0.206)#3,786 |
| 69. | Stanford | 0.37% | 0.14%(+0.236)#677 | 0.17%(+0.204)#3,787 |
| 70. | East Palo Alto | 0.37% | 0.14%(+0.234)#678 | 0.17%(+0.202)#3,788 |
| 71. | Foster City | 0.37% | 0.14%(+0.232)#679 | 0.17%(+0.200)#3,789 |
| 72. | Berkeley | 0.37% | 0.14%(+0.231)#680 | 0.17%(+0.199)#3,790 |
| 73. | Pepperdine University | 0.36% | 0.14%(+0.230)#681 | 0.17%(+0.198)#3,791 |
| 74. | Danville | 0.36% | 0.14%(+0.228)#682 | 0.17%(+0.197)#3,792 |
| 75. | Yosemite Lakes | 0.36% | 0.14%(+0.228)#683 | 0.17%(+0.196)#3,793 |
| 76. | Manhattan Beach | 0.36% | 0.14%(+0.226)#684 | 0.17%(+0.195)#3,794 |
| 77. | Lafayette | 0.36% | 0.14%(+0.224)#685 | 0.17%(+0.193)#3,795 |
| 78. | Lakeport | 0.36% | 0.14%(+0.224)#686 | 0.17%(+0.192)#3,796 |
| 79. | Palo Alto | 0.36% | 0.14%(+0.221)#687 | 0.17%(+0.190)#3,797 |
| 80. | San Francisco | 0.35% | 0.14%(+0.218)#688 | 0.17%(+0.187)#3,798 |
| 81. | West Hollywood | 0.34% | 0.14%(+0.204)#689 | 0.17%(+0.173)#3,799 |
| 82. | East Richmond Heights | 0.33% | 0.14%(+0.200)#690 | 0.17%(+0.168)#3,800 |
| 83. | El Segundo | 0.33% | 0.14%(+0.198)#691 | 0.17%(+0.167)#3,801 |
| 84. | Esparto | 0.33% | 0.14%(+0.198)#692 | 0.17%(+0.167)#3,802 |
| 85. | Pleasant Hill | 0.33% | 0.14%(+0.198)#693 | 0.17%(+0.166)#3,803 |
| 86. | Old Stine | 0.33% | 0.14%(+0.197)#694 | 0.17%(+0.165)#3,804 |
| 87. | Brentwood | 0.32% | 0.14%(+0.186)#695 | 0.17%(+0.154)#3,805 |
| 88. | La Crescenta Montrose | 0.32% | 0.14%(+0.183)#696 | 0.17%(+0.152)#3,806 |
| 89. | Redwood City | 0.31% | 0.14%(+0.177)#697 | 0.17%(+0.145)#3,807 |
| 90. | Huntington Beach | 0.31% | 0.14%(+0.176)#698 | 0.17%(+0.144)#3,808 |
| 91. | San Diego | 0.31% | 0.14%(+0.175)#699 | 0.17%(+0.143)#3,809 |
| 92. | Irvine | 0.31% | 0.14%(+0.171)#700 | 0.17%(+0.139)#3,810 |
| 93. | San Carlos | 0.31% | 0.14%(+0.170)#701 | 0.17%(+0.138)#3,811 |
| 94. | San Pablo | 0.30% | 0.14%(+0.169)#702 | 0.17%(+0.137)#3,812 |
| 95. | Calabasas | 0.30% | 0.14%(+0.168)#703 | 0.17%(+0.136)#3,813 |
| 96. | San Lorenzo | 0.30% | 0.14%(+0.164)#704 | 0.17%(+0.132)#3,814 |
| 97. | Concord | 0.30% | 0.14%(+0.161)#705 | 0.17%(+0.129)#3,815 |
| 98. | Milpitas | 0.28% | 0.14%(+0.149)#706 | 0.17%(+0.118)#3,816 |
| 99. | Daly City | 0.28% | 0.14%(+0.146)#707 | 0.17%(+0.114)#3,817 |
| 100. | Lennox | 0.28% | 0.14%(+0.145)#708 | 0.17%(+0.114)#3,818 |
Common Questions
What are the Top 10 Cities with the Highest Percentage of Immigrants from Brazil in California?
Top 10 Cities with the Highest Percentage of Immigrants from Brazil in California are:
#1
4.88%
#2
2.60%
#3
1.96%
#4
1.95%
#5
1.94%
#6
1.93%
#7
1.71%
#8
1.53%
#9
1.30%
#10
1.26%
What city has the Highest Percentage of Immigrants from Brazil in California?
Tiburon has the Highest Percentage of Immigrants from Brazil in California with 4.88%.
What is the Percentage of Immigrants from Brazil in the State of California?
Percentage of Immigrants from Brazil in California is 0.14%.
What is the Percentage of Immigrants from Brazil in the United States?
Percentage of Immigrants from Brazil in the United States is 0.17%.