Cities with the Highest Child Poverty Level Among Boys Under the Age of 16 in California
RELATED REPORTS & OPTIONS
Highest Poverty | Boys 0-16
California
Compare Cities
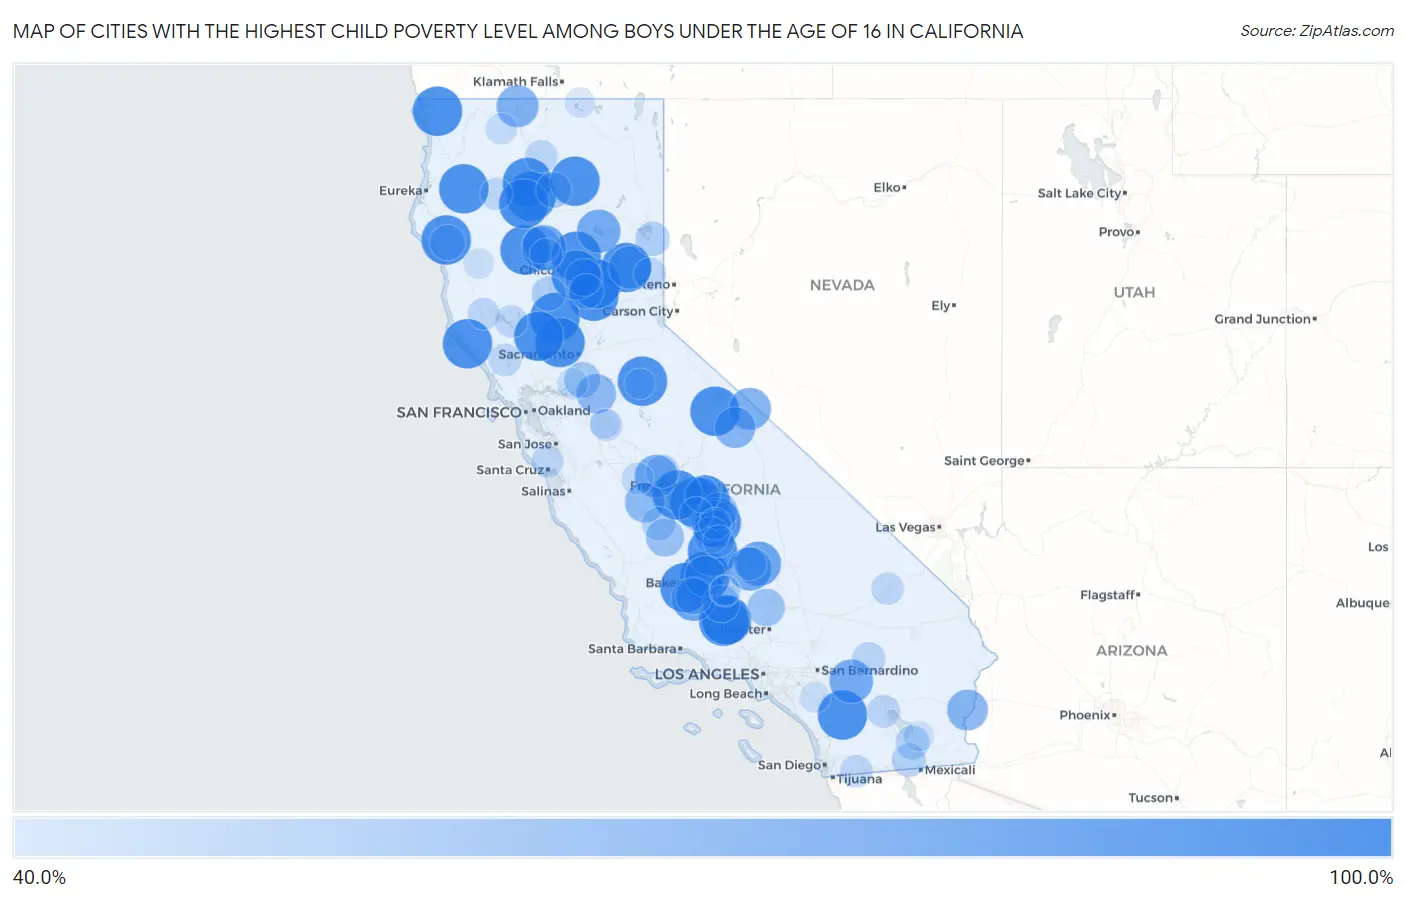
Map of Cities with the Highest Child Poverty Level Among Boys Under the Age of 16 in California
0.0%
100.0%
Cities with the Highest Child Poverty Level Among Boys Under the Age of 16 in California
| City | Child Poverty (Boys) | vs State | vs National | |
| 1. | Frazier Park | 100.0% | 15.5%(+84.5)#1 | 16.9%(+83.1)#4 |
| 2. | Redway | 100.0% | 15.5%(+84.5)#2 | 16.9%(+83.1)#46 |
| 3. | Sea Ranch | 100.0% | 15.5%(+84.5)#3 | 16.9%(+83.1)#50 |
| 4. | Delft Colony | 100.0% | 15.5%(+84.5)#4 | 16.9%(+83.1)#64 |
| 5. | Lebec | 100.0% | 15.5%(+84.5)#5 | 16.9%(+83.1)#82 |
| 6. | Mountain Gate | 100.0% | 15.5%(+84.5)#6 | 16.9%(+83.1)#89 |
| 7. | Rancho Tehama Reserve | 100.0% | 15.5%(+84.5)#7 | 16.9%(+83.1)#96 |
| 8. | Aguanga | 100.0% | 15.5%(+84.5)#8 | 16.9%(+83.1)#131 |
| 9. | Lakehead | 100.0% | 15.5%(+84.5)#9 | 16.9%(+83.1)#141 |
| 10. | Stirling City | 100.0% | 15.5%(+84.5)#10 | 16.9%(+83.1)#162 |
| 11. | Edison | 100.0% | 15.5%(+84.5)#11 | 16.9%(+83.1)#165 |
| 12. | Avery | 100.0% | 15.5%(+84.5)#12 | 16.9%(+83.1)#192 |
| 13. | East Orosi | 100.0% | 15.5%(+84.5)#13 | 16.9%(+83.1)#193 |
| 14. | Dobbins | 100.0% | 15.5%(+84.5)#14 | 16.9%(+83.1)#194 |
| 15. | Graeagle | 100.0% | 15.5%(+84.5)#15 | 16.9%(+83.1)#199 |
| 16. | Gasquet | 100.0% | 15.5%(+84.5)#16 | 16.9%(+83.1)#215 |
| 17. | Grimes | 100.0% | 15.5%(+84.5)#17 | 16.9%(+83.1)#220 |
| 18. | Clipper Mills | 100.0% | 15.5%(+84.5)#18 | 16.9%(+83.1)#238 |
| 19. | Mexican Colony | 100.0% | 15.5%(+84.5)#20 | 16.9%(+83.1)#248 |
| 20. | June Lake | 100.0% | 15.5%(+84.5)#21 | 16.9%(+83.1)#249 |
| 21. | Yolo | 100.0% | 15.5%(+84.5)#22 | 16.9%(+83.1)#268 |
| 22. | Whitmore | 100.0% | 15.5%(+84.5)#23 | 16.9%(+83.1)#276 |
| 23. | Burnt Ranch | 100.0% | 15.5%(+84.5)#24 | 16.9%(+83.1)#315 |
| 24. | Cassel | 100.0% | 15.5%(+84.5)#25 | 16.9%(+83.1)#316 |
| 25. | Bowles | 100.0% | 15.5%(+84.5)#26 | 16.9%(+83.1)#318 |
| 26. | Cherokee | 100.0% | 15.5%(+84.5)#27 | 16.9%(+83.1)#340 |
| 27. | Guinda | 100.0% | 15.5%(+84.5)#28 | 16.9%(+83.1)#353 |
| 28. | La Grange | 100.0% | 15.5%(+84.5)#29 | 16.9%(+83.1)#422 |
| 29. | Keswick | 100.0% | 15.5%(+84.5)#30 | 16.9%(+83.1)#434 |
| 30. | Mckittrick | 100.0% | 15.5%(+84.5)#31 | 16.9%(+83.1)#512 |
| 31. | Weitchpec | 100.0% | 15.5%(+84.5)#32 | 16.9%(+83.1)#541 |
| 32. | El Rancho | 100.0% | 15.5%(+84.5)#33 | 16.9%(+83.1)#570 |
| 33. | Rodriguez Camp | 100.0% | 15.5%(+84.5)#34 | 16.9%(+83.1)#595 |
| 34. | Los Molinos | 87.2% | 15.5%(+71.6)#35 | 16.9%(+70.3)#784 |
| 35. | Weldon | 86.8% | 15.5%(+71.2)#36 | 16.9%(+69.9)#793 |
| 36. | South Taft | 86.5% | 15.5%(+71.0)#37 | 16.9%(+69.6)#800 |
| 37. | Bodfish | 84.9% | 15.5%(+69.4)#38 | 16.9%(+68.0)#844 |
| 38. | Whitewater | 83.9% | 15.5%(+68.4)#39 | 16.9%(+67.0)#873 |
| 39. | Lake Almanor Country Club | 83.3% | 15.5%(+67.8)#40 | 16.9%(+66.4)#889 |
| 40. | La Vina | 82.1% | 15.5%(+66.6)#41 | 16.9%(+65.2)#931 |
| 41. | Clio | 82.0% | 15.5%(+66.5)#42 | 16.9%(+65.1)#938 |
| 42. | Benton | 80.0% | 15.5%(+64.5)#43 | 16.9%(+63.1)#997 |
| 43. | Hornbrook | 79.5% | 15.5%(+63.9)#44 | 16.9%(+62.6)#1,027 |
| 44. | Tonyville | 77.2% | 15.5%(+61.6)#45 | 16.9%(+60.3)#1,114 |
| 45. | Cherokee Strip | 76.9% | 15.5%(+61.4)#46 | 16.9%(+60.0)#1,124 |
| 46. | Ripley | 76.7% | 15.5%(+61.2)#47 | 16.9%(+59.8)#1,126 |
| 47. | Crowley Lake | 76.6% | 15.5%(+61.1)#48 | 16.9%(+59.7)#1,129 |
| 48. | Cantua Creek | 74.3% | 15.5%(+58.8)#49 | 16.9%(+57.4)#1,226 |
| 49. | Waterloo | 73.3% | 15.5%(+57.8)#50 | 16.9%(+56.4)#1,261 |
| 50. | Kettleman City | 69.0% | 15.5%(+53.5)#51 | 16.9%(+52.1)#1,464 |
| 51. | Plainview | 68.8% | 15.5%(+53.2)#52 | 16.9%(+51.8)#1,477 |
| 52. | Lemon Cove | 67.8% | 15.5%(+52.3)#53 | 16.9%(+50.9)#1,527 |
| 53. | Mojave | 67.4% | 15.5%(+51.8)#54 | 16.9%(+50.4)#1,544 |
| 54. | Gerber | 66.7% | 15.5%(+51.1)#55 | 16.9%(+49.8)#1,565 |
| 55. | Berry Creek | 66.7% | 15.5%(+51.1)#56 | 16.9%(+49.8)#1,566 |
| 56. | Mettler | 66.7% | 15.5%(+51.1)#57 | 16.9%(+49.8)#1,597 |
| 57. | Ford City | 65.0% | 15.5%(+49.5)#58 | 16.9%(+48.1)#1,685 |
| 58. | Thornton | 63.9% | 15.5%(+48.3)#59 | 16.9%(+47.0)#1,749 |
| 59. | Poplar Cotton Center | 63.8% | 15.5%(+48.2)#60 | 16.9%(+46.9)#1,754 |
| 60. | Round Mountain | 62.5% | 15.5%(+47.0)#61 | 16.9%(+45.6)#1,846 |
| 61. | Garberville | 62.2% | 15.5%(+46.7)#62 | 16.9%(+45.3)#1,857 |
| 62. | Orange Cove | 61.4% | 15.5%(+45.9)#63 | 16.9%(+44.5)#1,904 |
| 63. | Rackerby | 60.6% | 15.5%(+45.1)#64 | 16.9%(+43.7)#1,957 |
| 64. | Patton Village | 59.5% | 15.5%(+43.9)#65 | 16.9%(+42.6)#2,045 |
| 65. | Princeton | 59.5% | 15.5%(+43.9)#66 | 16.9%(+42.6)#2,047 |
| 66. | Westmorland | 58.2% | 15.5%(+42.6)#67 | 16.9%(+41.3)#2,144 |
| 67. | Seeley | 58.2% | 15.5%(+42.6)#68 | 16.9%(+41.3)#2,146 |
| 68. | Huron | 57.8% | 15.5%(+42.2)#69 | 16.9%(+40.9)#2,176 |
| 69. | Oak Run | 57.3% | 15.5%(+41.8)#70 | 16.9%(+40.4)#2,204 |
| 70. | Goshen | 57.3% | 15.5%(+41.7)#71 | 16.9%(+40.4)#2,209 |
| 71. | Parksdale | 56.6% | 15.5%(+41.1)#72 | 16.9%(+39.7)#2,271 |
| 72. | Homestead Valley | 56.1% | 15.5%(+40.6)#73 | 16.9%(+39.2)#2,312 |
| 73. | Oasis | 55.6% | 15.5%(+40.0)#74 | 16.9%(+38.7)#2,346 |
| 74. | Vina | 55.6% | 15.5%(+40.0)#75 | 16.9%(+38.7)#2,357 |
| 75. | Lake Isabella | 55.5% | 15.5%(+40.0)#76 | 16.9%(+38.6)#2,366 |
| 76. | Fulton | 54.7% | 15.5%(+39.2)#77 | 16.9%(+37.8)#2,419 |
| 77. | Clearlake Oaks | 54.7% | 15.5%(+39.1)#78 | 16.9%(+37.8)#2,420 |
| 78. | Potrero | 54.5% | 15.5%(+39.0)#79 | 16.9%(+37.6)#2,441 |
| 79. | Mccloud | 54.3% | 15.5%(+38.8)#80 | 16.9%(+37.4)#2,467 |
| 80. | Baker | 54.2% | 15.5%(+38.7)#81 | 16.9%(+37.3)#2,480 |
| 81. | Loyalton | 54.0% | 15.5%(+38.5)#82 | 16.9%(+37.1)#2,494 |
| 82. | Zayante | 53.8% | 15.5%(+38.3)#83 | 16.9%(+36.9)#2,503 |
| 83. | Bret Harte | 53.8% | 15.5%(+38.3)#84 | 16.9%(+36.9)#2,514 |
| 84. | Weaverville | 53.6% | 15.5%(+38.1)#85 | 16.9%(+36.7)#2,529 |
| 85. | Talmage | 53.3% | 15.5%(+37.8)#86 | 16.9%(+36.4)#2,550 |
| 86. | Lindsay | 52.8% | 15.5%(+37.3)#87 | 16.9%(+35.9)#2,612 |
| 87. | Firebaugh | 52.6% | 15.5%(+37.0)#88 | 16.9%(+35.7)#2,632 |
| 88. | Terra Bella | 52.3% | 15.5%(+36.8)#89 | 16.9%(+35.4)#2,659 |
| 89. | Fort Jones | 51.8% | 15.5%(+36.2)#90 | 16.9%(+34.9)#2,709 |
| 90. | Isleton | 51.4% | 15.5%(+35.8)#91 | 16.9%(+34.4)#2,757 |
| 91. | Warm Springs | 50.0% | 15.5%(+34.5)#92 | 16.9%(+33.1)#2,853 |
| 92. | East Bakersfield | 49.6% | 15.5%(+34.0)#93 | 16.9%(+32.7)#3,003 |
| 93. | Weedpatch | 49.5% | 15.5%(+33.9)#94 | 16.9%(+32.6)#3,012 |
| 94. | Covelo | 49.1% | 15.5%(+33.5)#95 | 16.9%(+32.2)#3,047 |
| 95. | Forest Meadows | 49.0% | 15.5%(+33.5)#96 | 16.9%(+32.1)#3,051 |
| 96. | Tulelake | 49.0% | 15.5%(+33.4)#97 | 16.9%(+32.1)#3,060 |
| 97. | Calipatria | 48.8% | 15.5%(+33.2)#98 | 16.9%(+31.9)#3,078 |
| 98. | Old Stine | 48.6% | 15.5%(+33.1)#99 | 16.9%(+31.7)#3,103 |
| 99. | Lamont | 48.5% | 15.5%(+32.9)#100 | 16.9%(+31.6)#3,113 |
| 100. | West Modesto | 48.4% | 15.5%(+32.9)#101 | 16.9%(+31.5)#3,119 |
Common Questions
What are the Top 10 Cities with the Highest Child Poverty Level Among Boys Under the Age of 16 in California?
Top 10 Cities with the Highest Child Poverty Level Among Boys Under the Age of 16 in California are:
#1
100.0%
#2
100.0%
#3
100.0%
#4
100.0%
#5
100.0%
#6
100.0%
#7
100.0%
#8
100.0%
#9
100.0%
#10
100.0%
What city has the Highest Child Poverty Level Among Boys Under the Age of 16 in California?
Frazier Park has the Highest Child Poverty Level Among Boys Under the Age of 16 in California with 100.0%.
What is the Poverty Level Among Boys Under the Age of 16 in the State of California?
Poverty Level Among Boys Under the Age of 16 in California is 15.5%.
What is the Poverty Level Among Boys Under the Age of 16 in the United States?
Poverty Level Among Boys Under the Age of 16 in the United States is 16.9%.