Cities with the Largest Ethiopian Community in California
RELATED REPORTS & OPTIONS
Ethiopian
California
Compare Cities
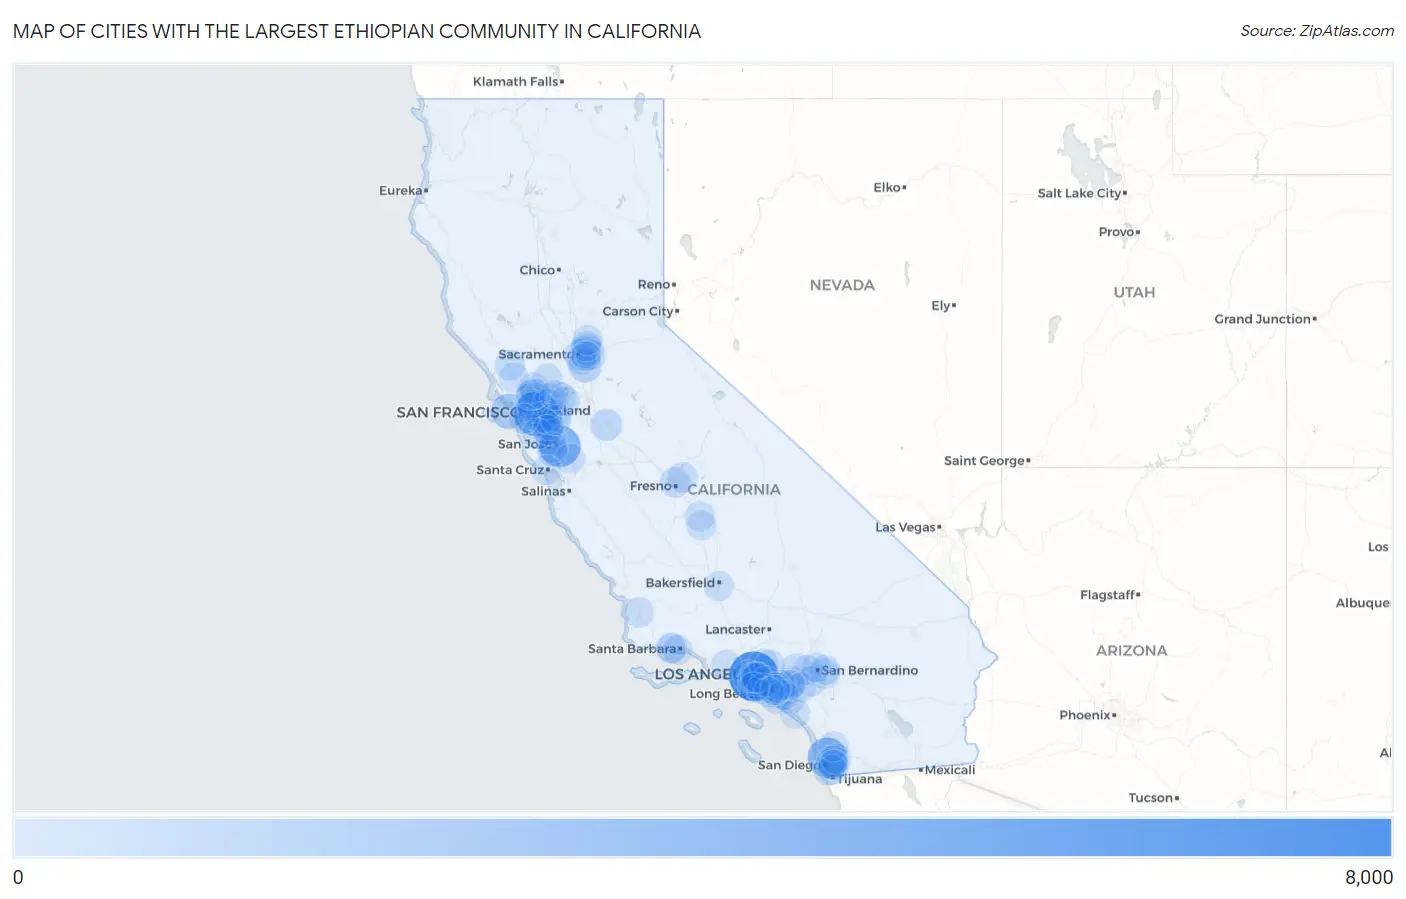
Map of Cities with the Largest Ethiopian Community in California
0
8,000
Cities with the Largest Ethiopian Community in California
| City | Ethiopian | vs State | vs National | |
| 1. | Los Angeles | 6,288 | 38,804(16.20%)#1 | 355,176(1.77%)#5 |
| 2. | Oakland | 4,707 | 38,804(12.13%)#2 | 355,176(1.33%)#9 |
| 3. | San Jose | 3,625 | 38,804(9.34%)#3 | 355,176(1.02%)#17 |
| 4. | San Diego | 3,074 | 38,804(7.92%)#4 | 355,176(0.87%)#20 |
| 5. | San Francisco | 1,671 | 38,804(4.31%)#5 | 355,176(0.47%)#36 |
| 6. | Elk Grove | 866 | 38,804(2.23%)#6 | 355,176(0.24%)#72 |
| 7. | Inglewood | 801 | 38,804(2.06%)#7 | 355,176(0.23%)#80 |
| 8. | Hawthorne | 644 | 38,804(1.66%)#8 | 355,176(0.18%)#97 |
| 9. | Modesto | 570 | 38,804(1.47%)#9 | 355,176(0.16%)#115 |
| 10. | Santa Monica | 563 | 38,804(1.45%)#10 | 355,176(0.16%)#118 |
| 11. | Alameda | 496 | 38,804(1.28%)#11 | 355,176(0.14%)#133 |
| 12. | Sacramento | 465 | 38,804(1.20%)#12 | 355,176(0.13%)#139 |
| 13. | Fremont | 403 | 38,804(1.04%)#13 | 355,176(0.11%)#158 |
| 14. | National City | 343 | 38,804(0.88%)#14 | 355,176(0.10%)#183 |
| 15. | Arden Arcade | 338 | 38,804(0.87%)#15 | 355,176(0.10%)#185 |
| 16. | Carmichael | 336 | 38,804(0.87%)#16 | 355,176(0.09%)#186 |
| 17. | Anaheim | 330 | 38,804(0.85%)#17 | 355,176(0.09%)#190 |
| 18. | La Mesa | 326 | 38,804(0.84%)#18 | 355,176(0.09%)#195 |
| 19. | Lakewood | 308 | 38,804(0.79%)#19 | 355,176(0.09%)#203 |
| 20. | Castro Valley | 301 | 38,804(0.78%)#20 | 355,176(0.08%)#207 |
| 21. | Dublin | 266 | 38,804(0.69%)#21 | 355,176(0.07%)#215 |
| 22. | Garden Grove | 253 | 38,804(0.65%)#22 | 355,176(0.07%)#227 |
| 23. | Fresno | 251 | 38,804(0.65%)#23 | 355,176(0.07%)#229 |
| 24. | Hercules | 249 | 38,804(0.64%)#24 | 355,176(0.07%)#230 |
| 25. | Santa Clara | 248 | 38,804(0.64%)#25 | 355,176(0.07%)#233 |
| 26. | Lemon Grove | 243 | 38,804(0.63%)#26 | 355,176(0.07%)#239 |
| 27. | Richmond | 242 | 38,804(0.62%)#27 | 355,176(0.07%)#240 |
| 28. | Hayward | 240 | 38,804(0.62%)#28 | 355,176(0.07%)#241 |
| 29. | Santa Rosa | 239 | 38,804(0.62%)#29 | 355,176(0.07%)#243 |
| 30. | Ashland | 235 | 38,804(0.61%)#30 | 355,176(0.07%)#246 |
| 31. | Culver City | 226 | 38,804(0.58%)#31 | 355,176(0.06%)#258 |
| 32. | Upland | 206 | 38,804(0.53%)#32 | 355,176(0.06%)#273 |
| 33. | Union City | 192 | 38,804(0.49%)#33 | 355,176(0.05%)#288 |
| 34. | Clovis | 191 | 38,804(0.49%)#34 | 355,176(0.05%)#291 |
| 35. | Parkway | 184 | 38,804(0.47%)#35 | 355,176(0.05%)#299 |
| 36. | Berkeley | 177 | 38,804(0.46%)#36 | 355,176(0.05%)#304 |
| 37. | Huntington Beach | 161 | 38,804(0.41%)#37 | 355,176(0.05%)#323 |
| 38. | Concord | 158 | 38,804(0.41%)#38 | 355,176(0.04%)#331 |
| 39. | Redlands | 157 | 38,804(0.40%)#39 | 355,176(0.04%)#334 |
| 40. | Vallejo | 152 | 38,804(0.39%)#40 | 355,176(0.04%)#343 |
| 41. | San Leandro | 150 | 38,804(0.39%)#41 | 355,176(0.04%)#350 |
| 42. | Placentia | 137 | 38,804(0.35%)#42 | 355,176(0.04%)#367 |
| 43. | Chino Hills | 136 | 38,804(0.35%)#43 | 355,176(0.04%)#368 |
| 44. | Emeryville | 136 | 38,804(0.35%)#44 | 355,176(0.04%)#369 |
| 45. | Visalia | 134 | 38,804(0.35%)#45 | 355,176(0.04%)#374 |
| 46. | Irvine | 132 | 38,804(0.34%)#46 | 355,176(0.04%)#380 |
| 47. | Fairfield | 132 | 38,804(0.34%)#47 | 355,176(0.04%)#382 |
| 48. | View Park Windsor Hills | 132 | 38,804(0.34%)#48 | 355,176(0.04%)#385 |
| 49. | Santa Maria | 128 | 38,804(0.33%)#49 | 355,176(0.04%)#394 |
| 50. | Rancho Cordova | 127 | 38,804(0.33%)#50 | 355,176(0.04%)#396 |
| 51. | Los Gatos | 126 | 38,804(0.32%)#51 | 355,176(0.04%)#398 |
| 52. | North Fair Oaks | 125 | 38,804(0.32%)#52 | 355,176(0.04%)#403 |
| 53. | Foothill Farms | 124 | 38,804(0.32%)#53 | 355,176(0.03%)#405 |
| 54. | El Cajon | 123 | 38,804(0.32%)#54 | 355,176(0.03%)#406 |
| 55. | Campbell | 122 | 38,804(0.31%)#55 | 355,176(0.03%)#408 |
| 56. | Antioch | 121 | 38,804(0.31%)#56 | 355,176(0.03%)#412 |
| 57. | Fullerton | 116 | 38,804(0.30%)#57 | 355,176(0.03%)#426 |
| 58. | Pasadena | 115 | 38,804(0.30%)#58 | 355,176(0.03%)#428 |
| 59. | Carson | 114 | 38,804(0.29%)#59 | 355,176(0.03%)#431 |
| 60. | Walnut Creek | 114 | 38,804(0.29%)#60 | 355,176(0.03%)#432 |
| 61. | Roseville | 112 | 38,804(0.29%)#61 | 355,176(0.03%)#437 |
| 62. | Riverside | 110 | 38,804(0.28%)#62 | 355,176(0.03%)#442 |
| 63. | Morgan Hill | 107 | 38,804(0.28%)#63 | 355,176(0.03%)#457 |
| 64. | Goleta | 107 | 38,804(0.28%)#64 | 355,176(0.03%)#458 |
| 65. | Highland | 105 | 38,804(0.27%)#65 | 355,176(0.03%)#460 |
| 66. | Fairview | 105 | 38,804(0.27%)#66 | 355,176(0.03%)#462 |
| 67. | Fontana | 99 | 38,804(0.26%)#67 | 355,176(0.03%)#473 |
| 68. | Tulare | 98 | 38,804(0.25%)#68 | 355,176(0.03%)#475 |
| 69. | Rodeo | 92 | 38,804(0.24%)#69 | 355,176(0.03%)#497 |
| 70. | Isla Vista | 90 | 38,804(0.23%)#70 | 355,176(0.03%)#499 |
| 71. | Newark | 89 | 38,804(0.23%)#71 | 355,176(0.03%)#502 |
| 72. | Pinole | 89 | 38,804(0.23%)#72 | 355,176(0.03%)#506 |
| 73. | South Gate | 88 | 38,804(0.23%)#73 | 355,176(0.02%)#508 |
| 74. | Santa Ana | 87 | 38,804(0.22%)#74 | 355,176(0.02%)#510 |
| 75. | Corona | 87 | 38,804(0.22%)#75 | 355,176(0.02%)#511 |
| 76. | Santa Barbara | 85 | 38,804(0.22%)#76 | 355,176(0.02%)#516 |
| 77. | Glendale | 76 | 38,804(0.20%)#77 | 355,176(0.02%)#553 |
| 78. | Chula Vista | 75 | 38,804(0.19%)#78 | 355,176(0.02%)#559 |
| 79. | Ladera Heights | 74 | 38,804(0.19%)#79 | 355,176(0.02%)#568 |
| 80. | Pleasanton | 73 | 38,804(0.19%)#80 | 355,176(0.02%)#571 |
| 81. | Pittsburg | 73 | 38,804(0.19%)#81 | 355,176(0.02%)#572 |
| 82. | Dana Point | 73 | 38,804(0.19%)#82 | 355,176(0.02%)#574 |
| 83. | Spring Valley Cdp San Diego County | 73 | 38,804(0.19%)#83 | 355,176(0.02%)#575 |
| 84. | Thousand Oaks | 71 | 38,804(0.18%)#84 | 355,176(0.02%)#580 |
| 85. | Petaluma | 70 | 38,804(0.18%)#85 | 355,176(0.02%)#590 |
| 86. | Poway | 70 | 38,804(0.18%)#86 | 355,176(0.02%)#591 |
| 87. | San Bernardino | 68 | 38,804(0.18%)#87 | 355,176(0.02%)#598 |
| 88. | Yorba Linda | 66 | 38,804(0.17%)#88 | 355,176(0.02%)#610 |
| 89. | Buena Park | 60 | 38,804(0.15%)#89 | 355,176(0.02%)#631 |
| 90. | Long Beach | 59 | 38,804(0.15%)#90 | 355,176(0.02%)#636 |
| 91. | Camp Pendleton Mainside | 59 | 38,804(0.15%)#91 | 355,176(0.02%)#642 |
| 92. | Daly City | 58 | 38,804(0.15%)#92 | 355,176(0.02%)#647 |
| 93. | Santa Cruz | 58 | 38,804(0.15%)#93 | 355,176(0.02%)#650 |
| 94. | Cypress | 58 | 38,804(0.15%)#94 | 355,176(0.02%)#651 |
| 95. | La Presa | 56 | 38,804(0.14%)#95 | 355,176(0.02%)#663 |
| 96. | Eastern Goleta Valley | 56 | 38,804(0.14%)#96 | 355,176(0.02%)#664 |
| 97. | Hermosa Beach | 54 | 38,804(0.14%)#97 | 355,176(0.02%)#679 |
| 98. | Bakersfield | 53 | 38,804(0.14%)#98 | 355,176(0.01%)#681 |
| 99. | Brentwood | 52 | 38,804(0.13%)#99 | 355,176(0.01%)#688 |
| 100. | Rosemont | 50 | 38,804(0.13%)#100 | 355,176(0.01%)#701 |
Common Questions
What are the Top 10 Cities with the Largest Ethiopian Community in California?
Top 10 Cities with the Largest Ethiopian Community in California are:
#1
6,288
#2
4,707
#3
3,625
#4
3,074
#5
1,671
#6
866
#7
801
#8
644
#9
570
#10
563
What city has the Largest Ethiopian Community in California?
Los Angeles has the Largest Ethiopian Community in California with 6,288.
What is the Total Ethiopian Population in the State of California?
Total Ethiopian Population in California is 38,804.
What is the Total Ethiopian Population in the United States?
Total Ethiopian Population in the United States is 355,176.