Trinity Center, CA Map & Demographics
Trinity Center Map
Trinity Center Overview
$40,126
PER CAPITA INCOME
$44,250
AVG FAMILY INCOME
$36,875
AVG HOUSEHOLD INCOME
0.35
INEQUALITY / GINI INDEX
250
TOTAL POPULATION
127
MALE POPULATION
123
FEMALE POPULATION
103.25
MALES / 100 FEMALES
96.85
FEMALES / 100 MALES
74.8
MEDIAN AGE
2.3
AVG FAMILY SIZE
1.9
AVG HOUSEHOLD SIZE
55
LABOR FORCE [ PEOPLE ]
22.0%
PERCENT IN LABOR FORCE
25.5%
UNEMPLOYMENT RATE
Trinity Center Zip Codes
Trinity Center Area Codes
Income in Trinity Center
Income Overview in Trinity Center
Per Capita Income in Trinity Center is $40,126, while median incomes of families and households are $44,250 and $36,875 respectively.
| Characteristic | Number | Measure |
| Per Capita Income | 250 | $40,126 |
| Median Family Income | 50 | $44,250 |
| Mean Family Income | 50 | $50,726 |
| Median Household Income | 135 | $36,875 |
| Mean Household Income | 135 | $43,655 |
| Income Deficit | 50 | $0 |
| Wage / Income Gap (%) | 250 | 0.00% |
| Wage / Income Gap ($) | 250 | 100.00¢ per $1 |
| Gini / Inequality Index | 250 | 0.35 |
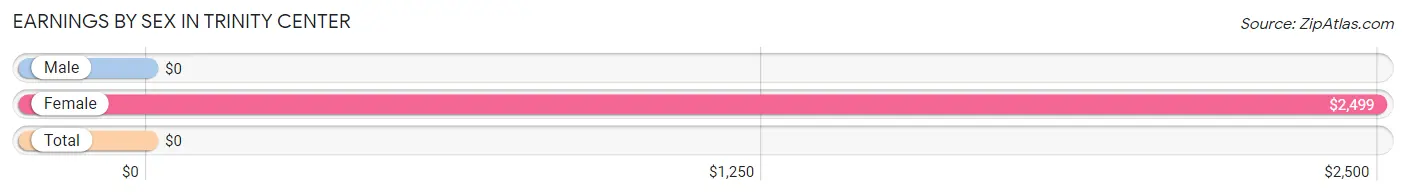
Earnings by Sex in Trinity Center
| Sex | Number | Average Earnings |
| Male | 22 (43.1%) | $0 |
| Female | 29 (56.9%) | $2,499 |
| Total | 51 (100.0%) | $0 |
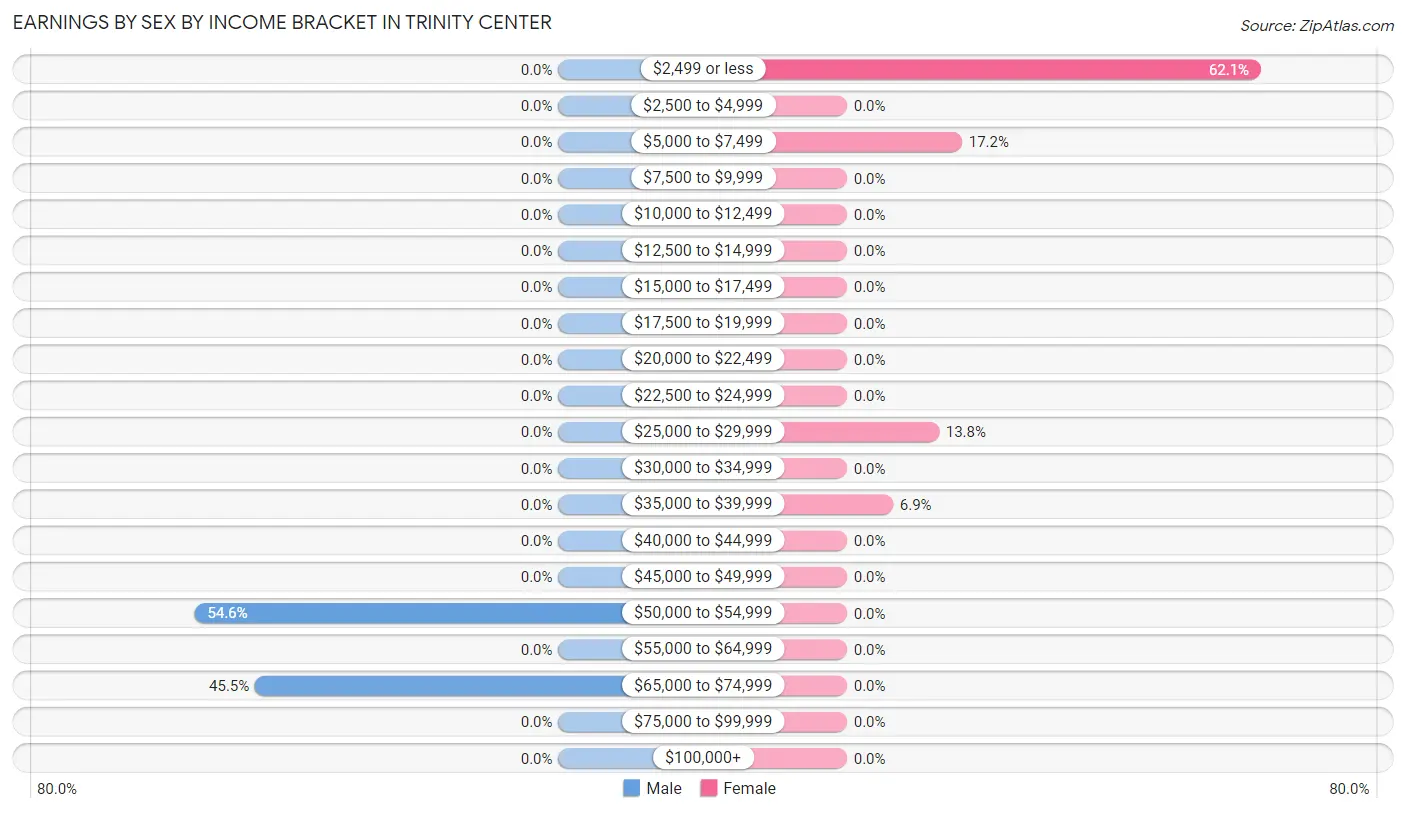
Earnings by Sex by Income Bracket in Trinity Center
The most common earnings brackets in Trinity Center are $50,000 to $54,999 for men (12 | 54.5%) and $2,499 or less for women (18 | 62.1%).
| Income | Male | Female |
| $2,499 or less | 0 (0.0%) | 18 (62.1%) |
| $2,500 to $4,999 | 0 (0.0%) | 0 (0.0%) |
| $5,000 to $7,499 | 0 (0.0%) | 5 (17.2%) |
| $7,500 to $9,999 | 0 (0.0%) | 0 (0.0%) |
| $10,000 to $12,499 | 0 (0.0%) | 0 (0.0%) |
| $12,500 to $14,999 | 0 (0.0%) | 0 (0.0%) |
| $15,000 to $17,499 | 0 (0.0%) | 0 (0.0%) |
| $17,500 to $19,999 | 0 (0.0%) | 0 (0.0%) |
| $20,000 to $22,499 | 0 (0.0%) | 0 (0.0%) |
| $22,500 to $24,999 | 0 (0.0%) | 0 (0.0%) |
| $25,000 to $29,999 | 0 (0.0%) | 4 (13.8%) |
| $30,000 to $34,999 | 0 (0.0%) | 0 (0.0%) |
| $35,000 to $39,999 | 0 (0.0%) | 2 (6.9%) |
| $40,000 to $44,999 | 0 (0.0%) | 0 (0.0%) |
| $45,000 to $49,999 | 0 (0.0%) | 0 (0.0%) |
| $50,000 to $54,999 | 12 (54.5%) | 0 (0.0%) |
| $55,000 to $64,999 | 0 (0.0%) | 0 (0.0%) |
| $65,000 to $74,999 | 10 (45.5%) | 0 (0.0%) |
| $75,000 to $99,999 | 0 (0.0%) | 0 (0.0%) |
| $100,000+ | 0 (0.0%) | 0 (0.0%) |
| Total | 22 (100.0%) | 29 (100.0%) |
Earnings by Sex by Educational Attainment in Trinity Center
| Educational Attainment | Male Income | Female Income |
| Less than High School | - | - |
| High School Diploma | - | - |
| College or Associate's Degree | - | - |
| Bachelor's Degree | - | - |
| Graduate Degree | - | - |
| Total | - | - |
Family Income in Trinity Center
Family Income Brackets in Trinity Center
According to the Trinity Center family income data, there are 18 families falling into the $25,000 to $34,999 income range, which is the most common income bracket and makes up 36.0% of all families.
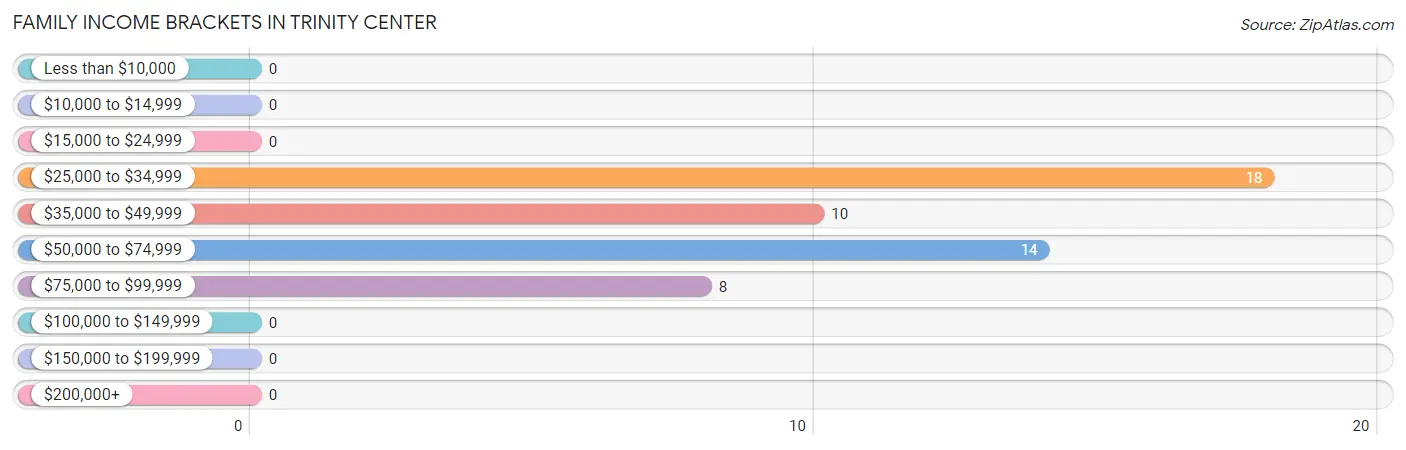
| Income Bracket | # Families | % Families |
| Less than $10,000 | 0 | 0.0% |
| $10,000 to $14,999 | 0 | 0.0% |
| $15,000 to $24,999 | 0 | 0.0% |
| $25,000 to $34,999 | 18 | 36.0% |
| $35,000 to $49,999 | 10 | 20.0% |
| $50,000 to $74,999 | 14 | 28.0% |
| $75,000 to $99,999 | 8 | 16.0% |
| $100,000 to $149,999 | 0 | 0.0% |
| $150,000 to $199,999 | 0 | 0.0% |
| $200,000+ | 0 | 0.0% |
Family Income by Famaliy Size in Trinity Center
2-person families (50 | 100.0%) account for the highest median family income in Trinity Center with $44,250 per family, while 2-person families (50 | 100.0%) have the highest median income of $22,125 per family member.
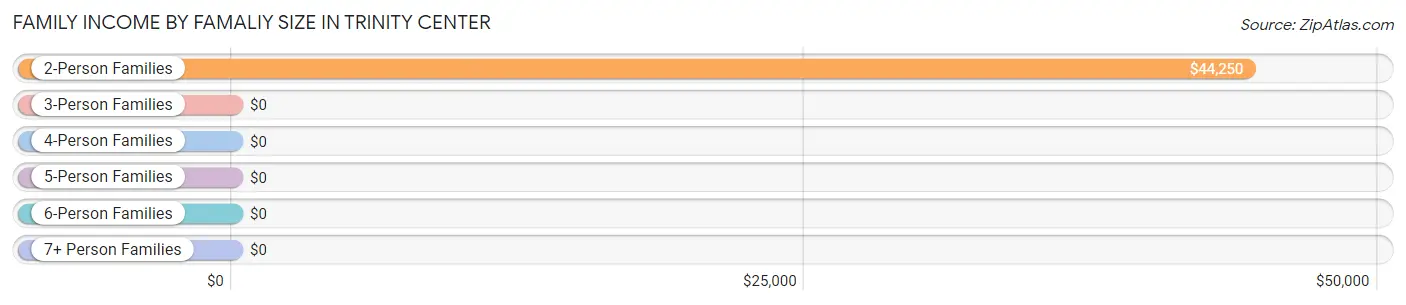
| Income Bracket | # Families | Median Income |
| 2-Person Families | 50 (100.0%) | $44,250 |
| 3-Person Families | 0 (0.0%) | $0 |
| 4-Person Families | 0 (0.0%) | $0 |
| 5-Person Families | 0 (0.0%) | $0 |
| 6-Person Families | 0 (0.0%) | $0 |
| 7+ Person Families | 0 (0.0%) | $0 |
| Total | 50 (100.0%) | $44,250 |
Family Income by Number of Earners in Trinity Center
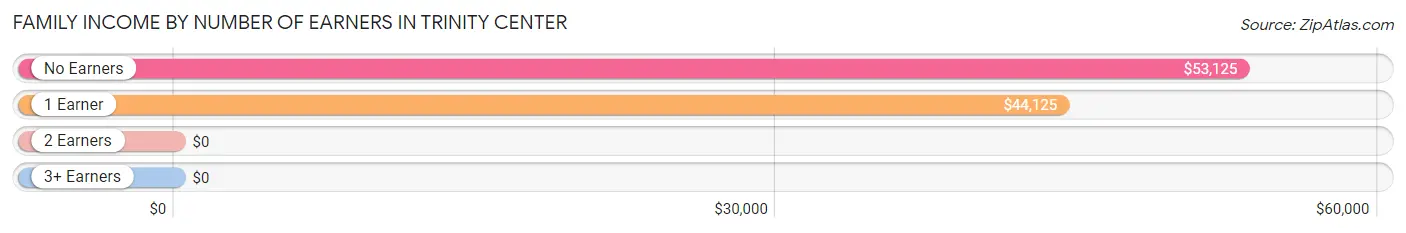
| Number of Earners | # Families | Median Income |
| No Earners | 27 (54.0%) | $53,125 |
| 1 Earner | 23 (46.0%) | $44,125 |
| 2 Earners | 0 (0.0%) | $0 |
| 3+ Earners | 0 (0.0%) | $0 |
| Total | 50 (100.0%) | $44,250 |
Household Income in Trinity Center
Household Income Brackets in Trinity Center
With 37 households falling in the category, the $25,000 to $34,999 income range is the most frequent in Trinity Center, accounting for 27.4% of all households.
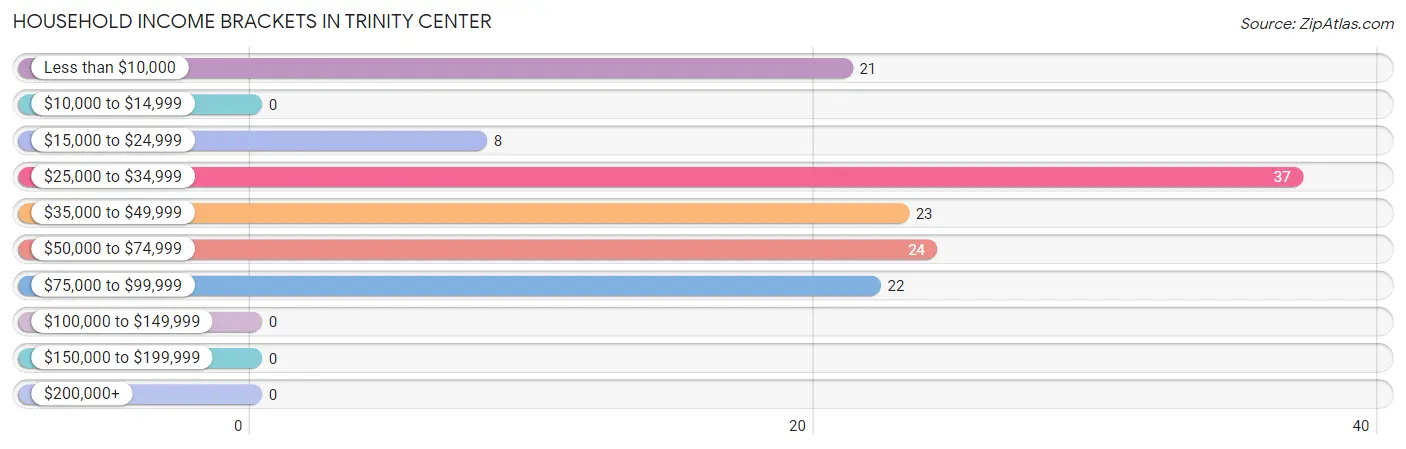
| Income Bracket | # Households | % Households |
| Less than $10,000 | 21 | 15.6% |
| $10,000 to $14,999 | 0 | 0.0% |
| $15,000 to $24,999 | 8 | 5.9% |
| $25,000 to $34,999 | 37 | 27.4% |
| $35,000 to $49,999 | 23 | 17.0% |
| $50,000 to $74,999 | 24 | 17.8% |
| $75,000 to $99,999 | 22 | 16.3% |
| $100,000 to $149,999 | 0 | 0.0% |
| $150,000 to $199,999 | 0 | 0.0% |
| $200,000+ | 0 | 0.0% |
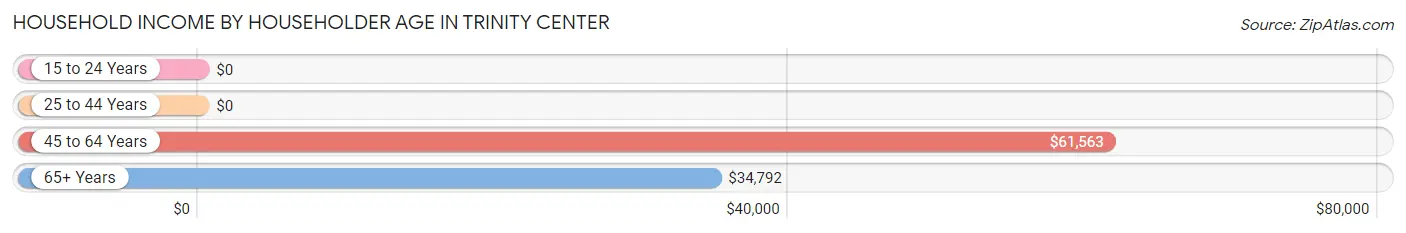
Household Income by Householder Age in Trinity Center
The median household income in Trinity Center is $36,875, with the highest median household income of $61,563 found in the 45 to 64 years age bracket for the primary householder. A total of 15 households (11.1%) fall into this category.
| Income Bracket | # Households | Median Income |
| 15 to 24 Years | 0 (0.0%) | $0 |
| 25 to 44 Years | 2 (1.5%) | $0 |
| 45 to 64 Years | 15 (11.1%) | $61,563 |
| 65+ Years | 118 (87.4%) | $34,792 |
| Total | 135 (100.0%) | $36,875 |
Poverty in Trinity Center
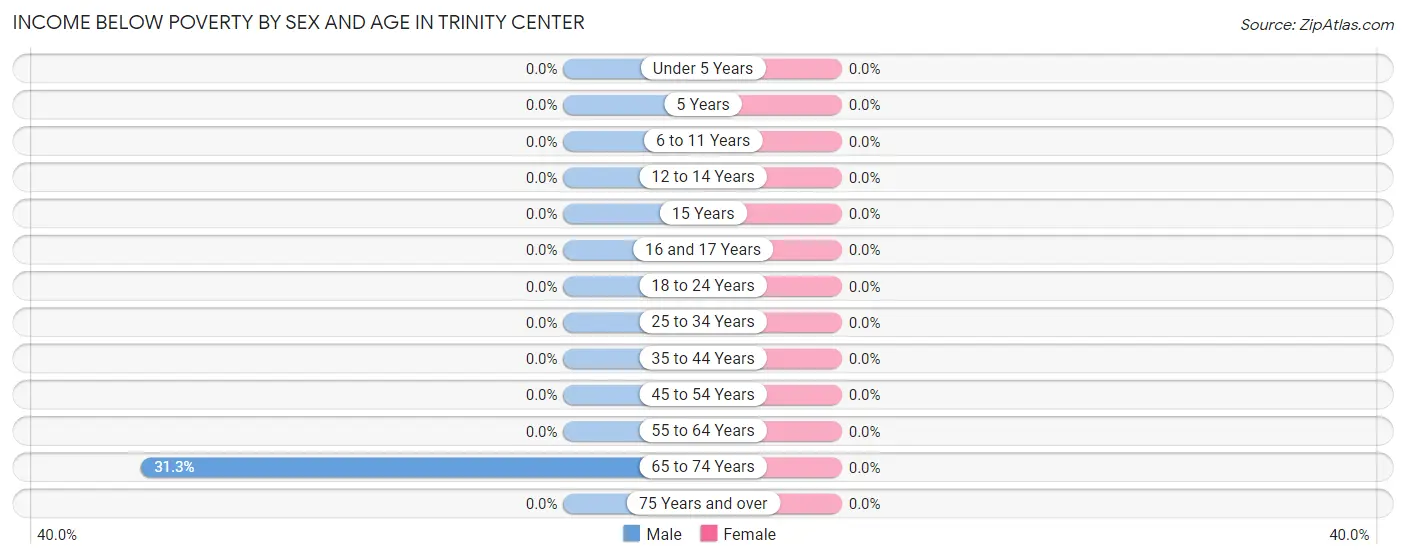
Income Below Poverty by Sex and Age in Trinity Center
| Age Bracket | Male | Female |
| Under 5 Years | 0 (0.0%) | 0 (0.0%) |
| 5 Years | 0 (0.0%) | 0 (0.0%) |
| 6 to 11 Years | 0 (0.0%) | 0 (0.0%) |
| 12 to 14 Years | 0 (0.0%) | 0 (0.0%) |
| 15 Years | 0 (0.0%) | 0 (0.0%) |
| 16 and 17 Years | 0 (0.0%) | 0 (0.0%) |
| 18 to 24 Years | 0 (0.0%) | 0 (0.0%) |
| 25 to 34 Years | 0 (0.0%) | 0 (0.0%) |
| 35 to 44 Years | 0 (0.0%) | 0 (0.0%) |
| 45 to 54 Years | 0 (0.0%) | 0 (0.0%) |
| 55 to 64 Years | 0 (0.0%) | 0 (0.0%) |
| 65 to 74 Years | 21 (31.3%) | 0 (0.0%) |
| 75 Years and over | 0 (0.0%) | 0 (0.0%) |
| Total | 21 (16.5%) | 0 (0.0%) |
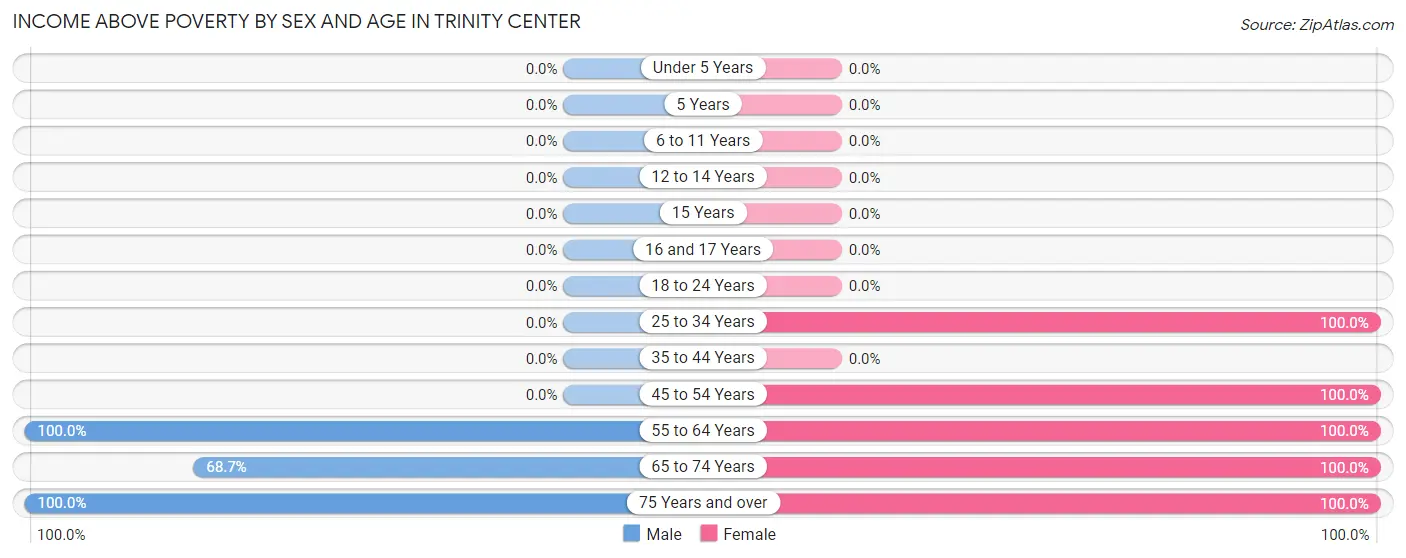
Income Above Poverty by Sex and Age in Trinity Center
According to the poverty statistics in Trinity Center, males aged 55 to 64 years and females aged 25 to 34 years are the age groups that are most secure financially, with 100.0% of males and 100.0% of females in these age groups living above the poverty line.
| Age Bracket | Male | Female |
| Under 5 Years | 0 (0.0%) | 0 (0.0%) |
| 5 Years | 0 (0.0%) | 0 (0.0%) |
| 6 to 11 Years | 0 (0.0%) | 0 (0.0%) |
| 12 to 14 Years | 0 (0.0%) | 0 (0.0%) |
| 15 Years | 0 (0.0%) | 0 (0.0%) |
| 16 and 17 Years | 0 (0.0%) | 0 (0.0%) |
| 18 to 24 Years | 0 (0.0%) | 0 (0.0%) |
| 25 to 34 Years | 0 (0.0%) | 2 (100.0%) |
| 35 to 44 Years | 0 (0.0%) | 0 (0.0%) |
| 45 to 54 Years | 0 (0.0%) | 5 (100.0%) |
| 55 to 64 Years | 18 (100.0%) | 4 (100.0%) |
| 65 to 74 Years | 46 (68.7%) | 32 (100.0%) |
| 75 Years and over | 42 (100.0%) | 80 (100.0%) |
| Total | 106 (83.5%) | 123 (100.0%) |
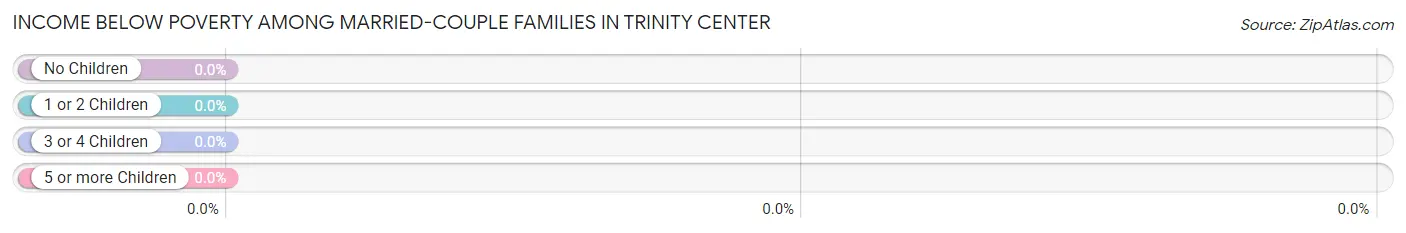
Income Below Poverty Among Married-Couple Families in Trinity Center
| Children | Above Poverty | Below Poverty |
| No Children | 50 (100.0%) | 0 (0.0%) |
| 1 or 2 Children | 0 (0.0%) | 0 (0.0%) |
| 3 or 4 Children | 0 (0.0%) | 0 (0.0%) |
| 5 or more Children | 0 (0.0%) | 0 (0.0%) |
| Total | 50 (100.0%) | 0 (0.0%) |
Income Below Poverty Among Single-Parent Households in Trinity Center
| Children | Single Father | Single Mother |
| No Children | 0 (0.0%) | 0 (0.0%) |
| 1 or 2 Children | 0 (0.0%) | 0 (0.0%) |
| 3 or 4 Children | 0 (0.0%) | 0 (0.0%) |
| 5 or more Children | 0 (0.0%) | 0 (0.0%) |
| Total | 0 (0.0%) | 0 (0.0%) |
Income Below Poverty Among Married-Couple vs Single-Parent Households in Trinity Center
| Children | Married-Couple Families | Single-Parent Households |
| No Children | 0 (0.0%) | 0 (0.0%) |
| 1 or 2 Children | 0 (0.0%) | 0 (0.0%) |
| 3 or 4 Children | 0 (0.0%) | 0 (0.0%) |
| 5 or more Children | 0 (0.0%) | 0 (0.0%) |
| Total | 0 (0.0%) | 0 (0.0%) |
Race in Trinity Center
The most populous races in Trinity Center are White / Caucasian (240 | 96.0%), Hispanic or Latino (5 | 2.0%), and Native / Alaskan (5 | 2.0%).
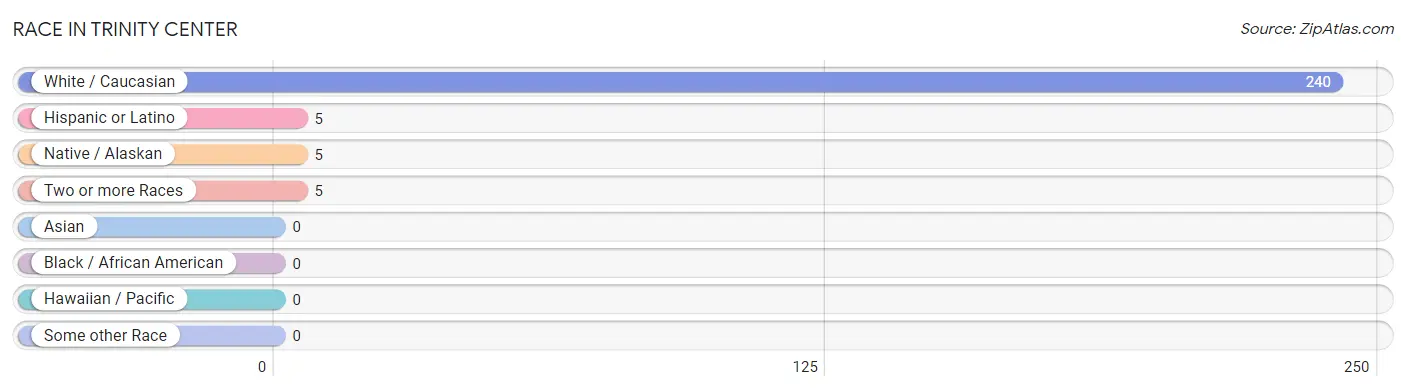
| Race | # Population | % Population |
| Asian | 0 | 0.0% |
| Black / African American | 0 | 0.0% |
| Hawaiian / Pacific | 0 | 0.0% |
| Hispanic or Latino | 5 | 2.0% |
| Native / Alaskan | 5 | 2.0% |
| White / Caucasian | 240 | 96.0% |
| Two or more Races | 5 | 2.0% |
| Some other Race | 0 | 0.0% |
| Total | 250 | 100.0% |
Ancestry in Trinity Center
The most populous ancestries reported in Trinity Center are American (67 | 26.8%), Irish (35 | 14.0%), English (26 | 10.4%), Greek (18 | 7.2%), and Norwegian (17 | 6.8%), together accounting for 65.2% of all Trinity Center residents.
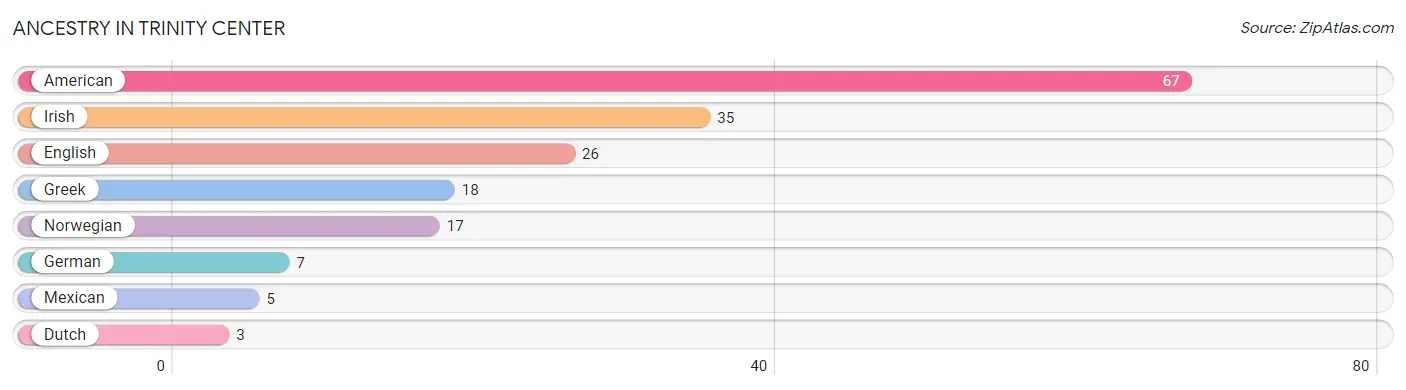
| Ancestry | # Population | % Population |
| American | 67 | 26.8% |
| Dutch | 3 | 1.2% |
| English | 26 | 10.4% |
| German | 7 | 2.8% |
| Greek | 18 | 7.2% |
| Irish | 35 | 14.0% |
| Mexican | 5 | 2.0% |
| Norwegian | 17 | 6.8% | View All 8 Rows |
Immigrants in Trinity Center

| Immigration Origin | # Population | % Population | View All 0 Rows |
Sex and Age in Trinity Center
Sex and Age in Trinity Center
The most populous age groups in Trinity Center are 65 to 69 Years (36 | 28.3%) for men and 75 to 79 Years (66 | 53.7%) for women.
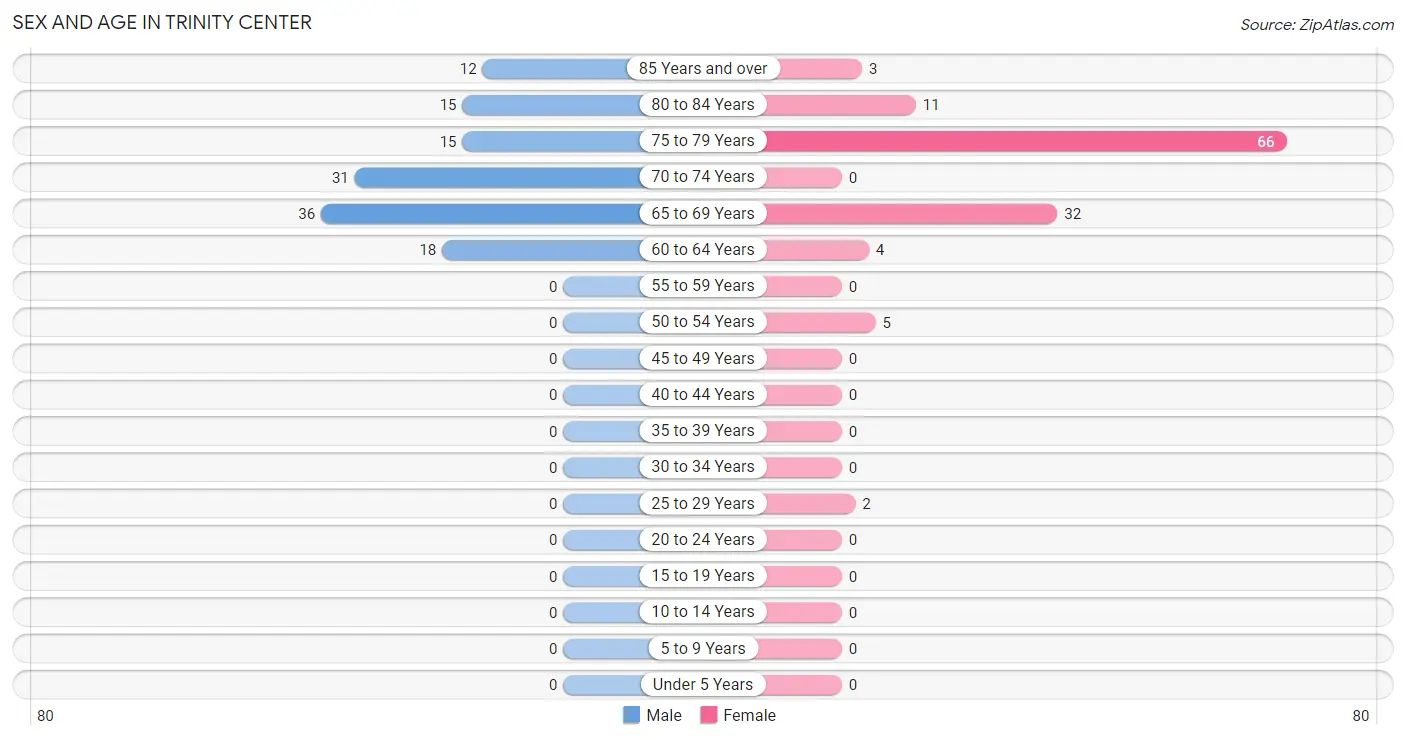
| Age Bracket | Male | Female |
| Under 5 Years | 0 (0.0%) | 0 (0.0%) |
| 5 to 9 Years | 0 (0.0%) | 0 (0.0%) |
| 10 to 14 Years | 0 (0.0%) | 0 (0.0%) |
| 15 to 19 Years | 0 (0.0%) | 0 (0.0%) |
| 20 to 24 Years | 0 (0.0%) | 0 (0.0%) |
| 25 to 29 Years | 0 (0.0%) | 2 (1.6%) |
| 30 to 34 Years | 0 (0.0%) | 0 (0.0%) |
| 35 to 39 Years | 0 (0.0%) | 0 (0.0%) |
| 40 to 44 Years | 0 (0.0%) | 0 (0.0%) |
| 45 to 49 Years | 0 (0.0%) | 0 (0.0%) |
| 50 to 54 Years | 0 (0.0%) | 5 (4.1%) |
| 55 to 59 Years | 0 (0.0%) | 0 (0.0%) |
| 60 to 64 Years | 18 (14.2%) | 4 (3.3%) |
| 65 to 69 Years | 36 (28.3%) | 32 (26.0%) |
| 70 to 74 Years | 31 (24.4%) | 0 (0.0%) |
| 75 to 79 Years | 15 (11.8%) | 66 (53.7%) |
| 80 to 84 Years | 15 (11.8%) | 11 (8.9%) |
| 85 Years and over | 12 (9.5%) | 3 (2.4%) |
| Total | 127 (100.0%) | 123 (100.0%) |
Families and Households in Trinity Center
Median Family Size in Trinity Center
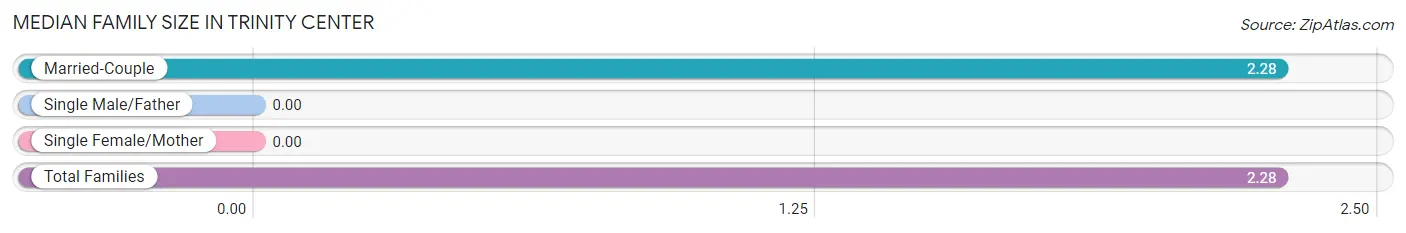
| Family Type | # Families | Family Size |
| Married-Couple | 50 (100.0%) | 2.28 |
| Single Male/Father | 0 (0.0%) | - |
| Single Female/Mother | 0 (0.0%) | - |
| Total Families | 50 (100.0%) | 2.28 |
Median Household Size in Trinity Center
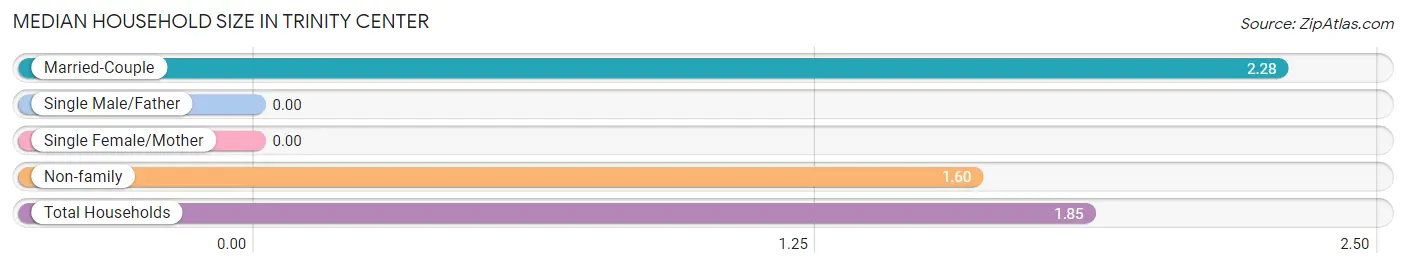
| Household Type | # Households | Household Size |
| Married-Couple | 50 (37.0%) | 2.28 |
| Single Male/Father | 0 (0.0%) | - |
| Single Female/Mother | 0 (0.0%) | - |
| Non-family | 85 (63.0%) | 1.60 |
| Total Households | 135 (100.0%) | 1.85 |
Household Size by Marriage Status in Trinity Center
Out of a total of 135 households in Trinity Center, 50 (37.0%) are family households, while 85 (63.0%) are nonfamily households. The most numerous type of family households are 2-person households, comprising 50, and the most common type of nonfamily households are 1-person households, comprising 77.
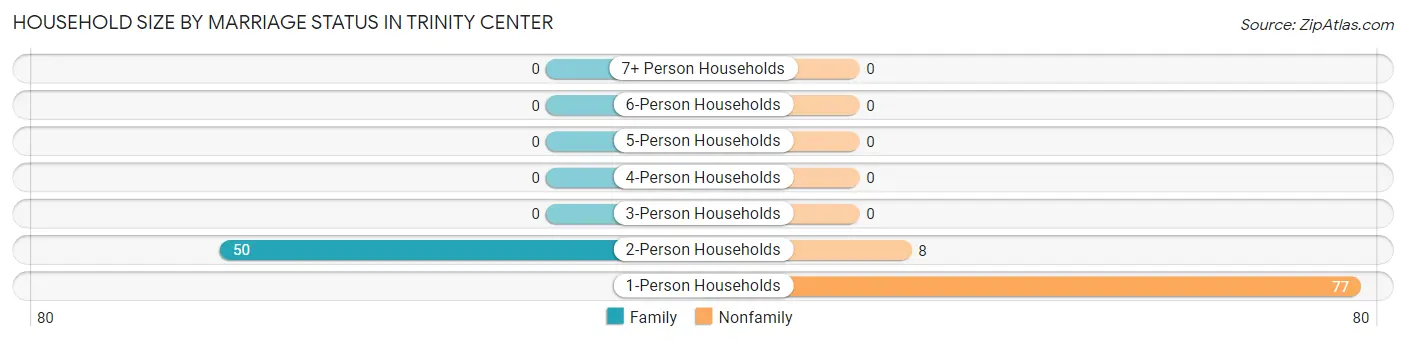
| Household Size | Family Households | Nonfamily Households |
| 1-Person Households | - | 77 (57.0%) |
| 2-Person Households | 50 (37.0%) | 8 (5.9%) |
| 3-Person Households | 0 (0.0%) | 0 (0.0%) |
| 4-Person Households | 0 (0.0%) | 0 (0.0%) |
| 5-Person Households | 0 (0.0%) | 0 (0.0%) |
| 6-Person Households | 0 (0.0%) | 0 (0.0%) |
| 7+ Person Households | 0 (0.0%) | 0 (0.0%) |
| Total | 50 (37.0%) | 85 (63.0%) |
Female Fertility in Trinity Center
Fertility by Age in Trinity Center
| Age Bracket | Women with Births | Births / 1,000 Women |
| 15 to 19 years | 0 (0.0%) | 0.0 |
| 20 to 34 years | 0 (0.0%) | 0.0 |
| 35 to 50 years | 0 (0.0%) | 0.0 |
| Total | 0 (0.0%) | 0.0 |
Fertility by Age by Marriage Status in Trinity Center
| Age Bracket | Married | Unmarried |
| 15 to 19 years | 0 (0.0%) | 0 (0.0%) |
| 20 to 34 years | 0 (0.0%) | 0 (0.0%) |
| 35 to 50 years | 0 (0.0%) | 0 (0.0%) |
| Total | 0 (0.0%) | 0 (0.0%) |
Fertility by Education in Trinity Center
| Educational Attainment | Women with Births | Births / 1,000 Women |
| Less than High School | 0 (0.0%) | 0.0 |
| High School Diploma | 0 (0.0%) | 0.0 |
| College or Associate's Degree | 0 (0.0%) | 0.0 |
| Bachelor's Degree | 0 (0.0%) | 0.0 |
| Graduate Degree | 0 (0.0%) | 0.0 |
| Total | 0 (0.0%) | 0.0 |
Fertility by Education by Marriage Status in Trinity Center
| Educational Attainment | Married | Unmarried |
| Less than High School | 0 (0.0%) | 0 (0.0%) |
| High School Diploma | 0 (0.0%) | 0 (0.0%) |
| College or Associate's Degree | 0 (0.0%) | 0 (0.0%) |
| Bachelor's Degree | 0 (0.0%) | 0 (0.0%) |
| Graduate Degree | 0 (0.0%) | 0 (0.0%) |
| Total | 0 (0.0%) | 0 (0.0%) |
Employment Characteristics in Trinity Center
Employment by Class of Employer in Trinity Center
Among the 41 employed individuals in Trinity Center, local government employees (20 | 48.8%), private company employees (11 | 26.8%), and self-employed (not incorporated) (10 | 24.4%) make up the most common classes of employment.
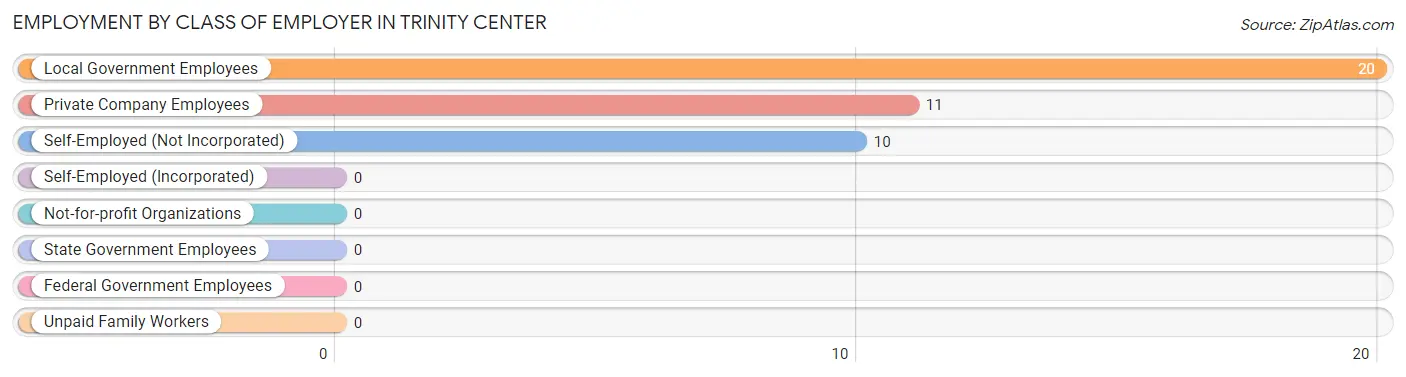
| Employer Class | # Employees | % Employees |
| Private Company Employees | 11 | 26.8% |
| Self-Employed (Incorporated) | 0 | 0.0% |
| Self-Employed (Not Incorporated) | 10 | 24.4% |
| Not-for-profit Organizations | 0 | 0.0% |
| Local Government Employees | 20 | 48.8% |
| State Government Employees | 0 | 0.0% |
| Federal Government Employees | 0 | 0.0% |
| Unpaid Family Workers | 0 | 0.0% |
| Total | 41 | 100.0% |
Employment Status by Age in Trinity Center
According to the labor force statistics for Trinity Center, out of the total population over 16 years of age (250), 22.0% or 55 individuals are in the labor force, with 25.5% or 14 of them unemployed. The age group with the highest labor force participation rate is 25 to 29 years, with 100.0% or 2 individuals in the labor force. Within the labor force, the 65 to 74 years age range has the highest percentage of unemployed individuals, with 31.3% or 10 of them being unemployed.
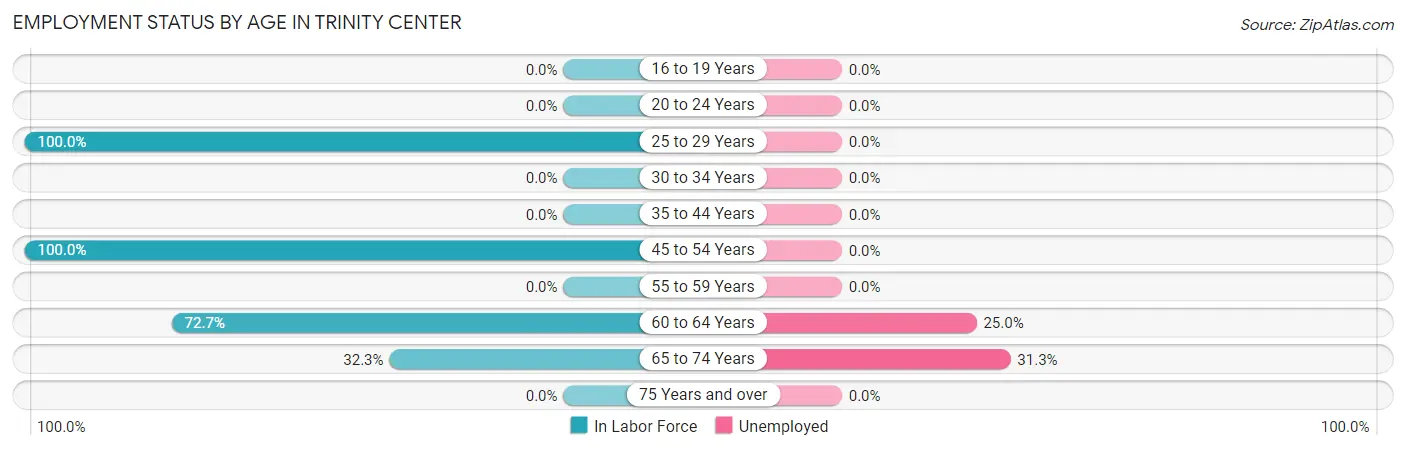
| Age Bracket | In Labor Force | Unemployed |
| 16 to 19 Years | 0 (0.0%) | 0 (0.0%) |
| 20 to 24 Years | 0 (0.0%) | 0 (0.0%) |
| 25 to 29 Years | 2 (100.0%) | 0 (0.0%) |
| 30 to 34 Years | 0 (0.0%) | 0 (0.0%) |
| 35 to 44 Years | 0 (0.0%) | 0 (0.0%) |
| 45 to 54 Years | 5 (100.0%) | 0 (0.0%) |
| 55 to 59 Years | 0 (0.0%) | 0 (0.0%) |
| 60 to 64 Years | 16 (72.7%) | 4 (25.0%) |
| 65 to 74 Years | 32 (32.3%) | 10 (31.3%) |
| 75 Years and over | 0 (0.0%) | 0 (0.0%) |
| Total | 55 (22.0%) | 14 (25.5%) |
Employment Status by Educational Attainment in Trinity Center
According to labor force statistics for Trinity Center, 79.3% of individuals (23) out of the total population between 25 and 64 years of age (29) are in the labor force, with 17.4% or 4 of them being unemployed. The group with the highest labor force participation rate are those with the educational attainment of high school diploma, with 100.0% or 16 individuals in the labor force. Within the labor force, individuals with high school diploma education have the highest percentage of unemployment, with 25.0% or 4 of them being unemployed.
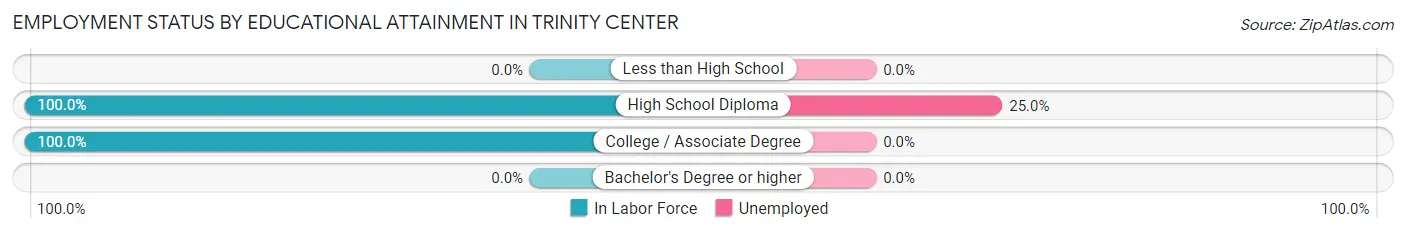
| Educational Attainment | In Labor Force | Unemployed |
| Less than High School | 0 (0.0%) | 0 (0.0%) |
| High School Diploma | 16 (100.0%) | 4 (25.0%) |
| College / Associate Degree | 7 (100.0%) | 0 (0.0%) |
| Bachelor's Degree or higher | 0 (0.0%) | 0 (0.0%) |
| Total | 23 (79.3%) | 5 (17.4%) |
Employment Occupations by Sex in Trinity Center
Management, Business, Science and Arts Occupations
The most common Management, Business, Science and Arts occupations in Trinity Center are , and Business & Financial (2 | 4.9%).
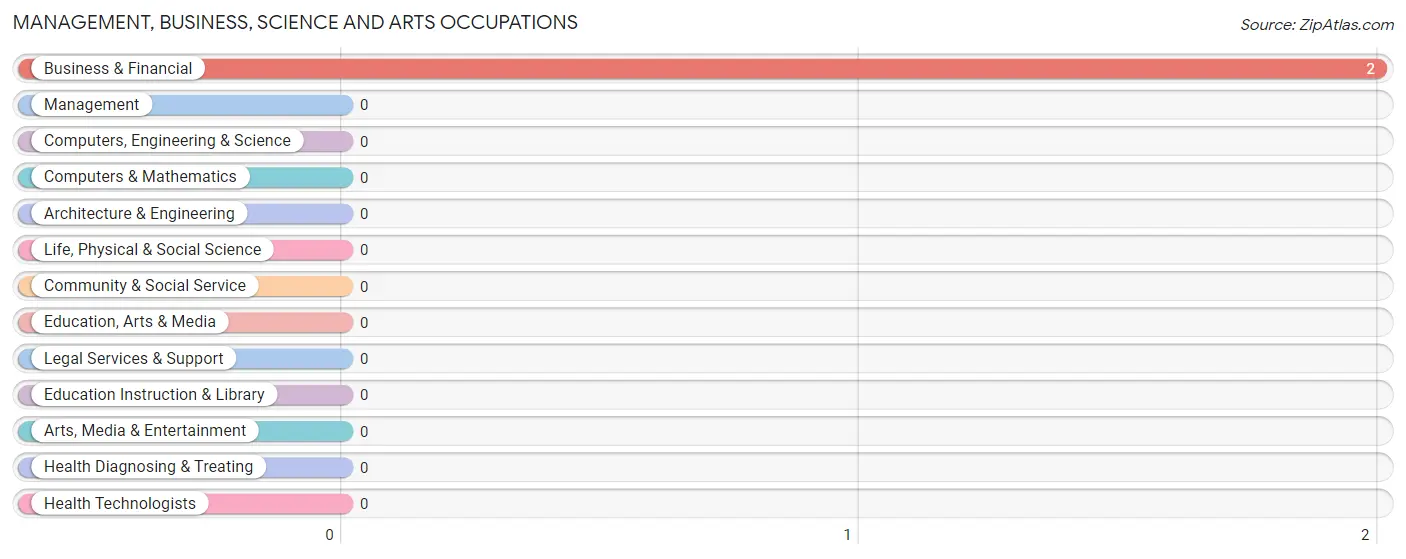
Management, Business, Science and Arts Occupations by Sex
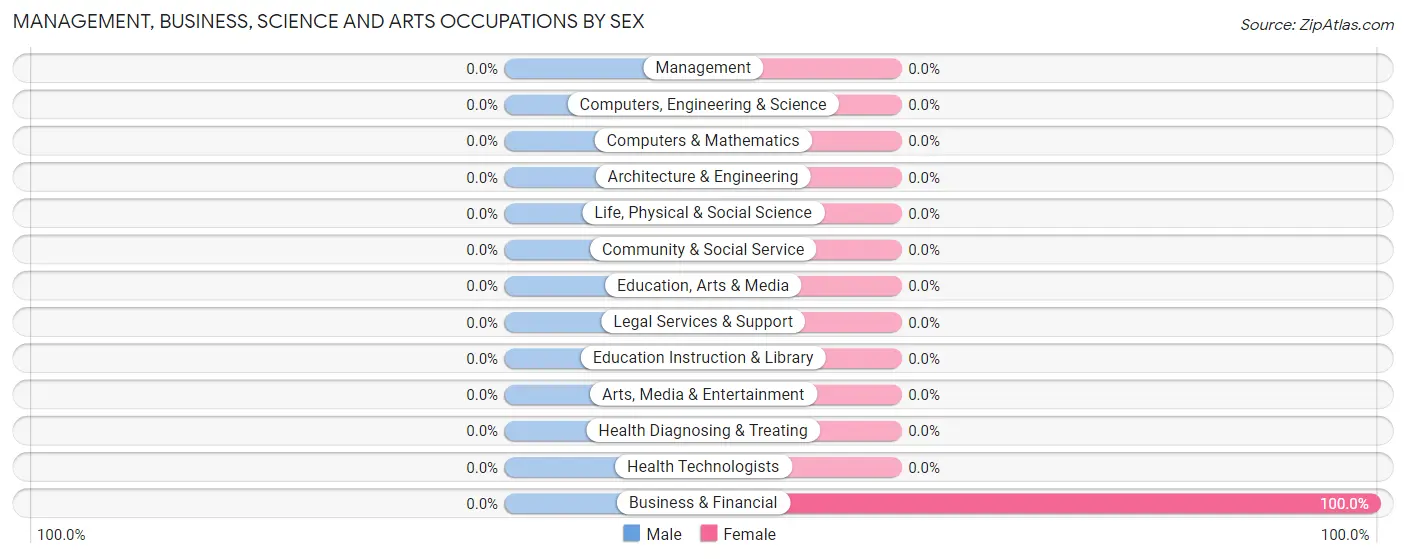
| Occupation | Male | Female |
| Management | 0 (0.0%) | 0 (0.0%) |
| Business & Financial | 0 (0.0%) | 2 (100.0%) |
| Computers, Engineering & Science | 0 (0.0%) | 0 (0.0%) |
| Computers & Mathematics | 0 (0.0%) | 0 (0.0%) |
| Architecture & Engineering | 0 (0.0%) | 0 (0.0%) |
| Life, Physical & Social Science | 0 (0.0%) | 0 (0.0%) |
| Community & Social Service | 0 (0.0%) | 0 (0.0%) |
| Education, Arts & Media | 0 (0.0%) | 0 (0.0%) |
| Legal Services & Support | 0 (0.0%) | 0 (0.0%) |
| Education Instruction & Library | 0 (0.0%) | 0 (0.0%) |
| Arts, Media & Entertainment | 0 (0.0%) | 0 (0.0%) |
| Health Diagnosing & Treating | 0 (0.0%) | 0 (0.0%) |
| Health Technologists | 0 (0.0%) | 0 (0.0%) |
| Total (Category) | 0 (0.0%) | 2 (100.0%) |
| Total (Overall) | 22 (53.7%) | 19 (46.3%) |
Services Occupations
The most common Services occupations in Trinity Center are , and Food Preparation & Serving (5 | 12.2%).
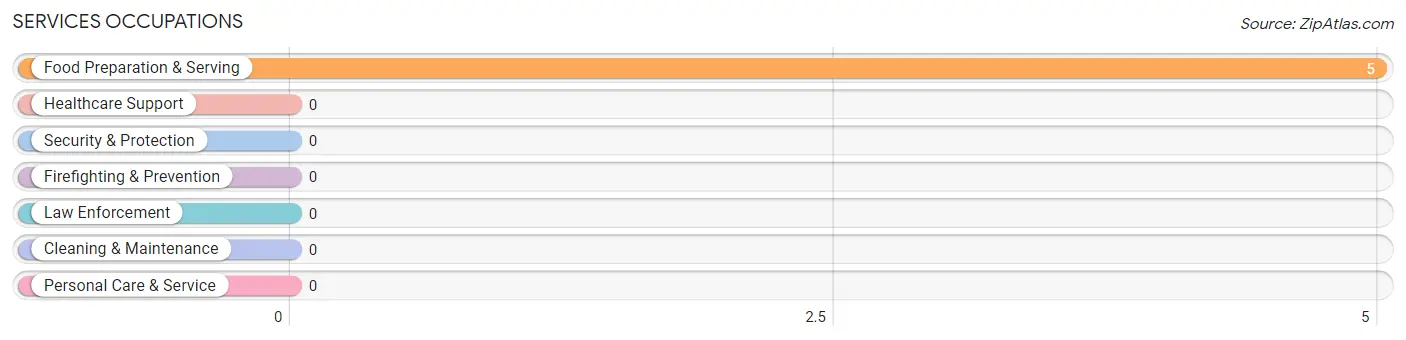
Services Occupations by Sex
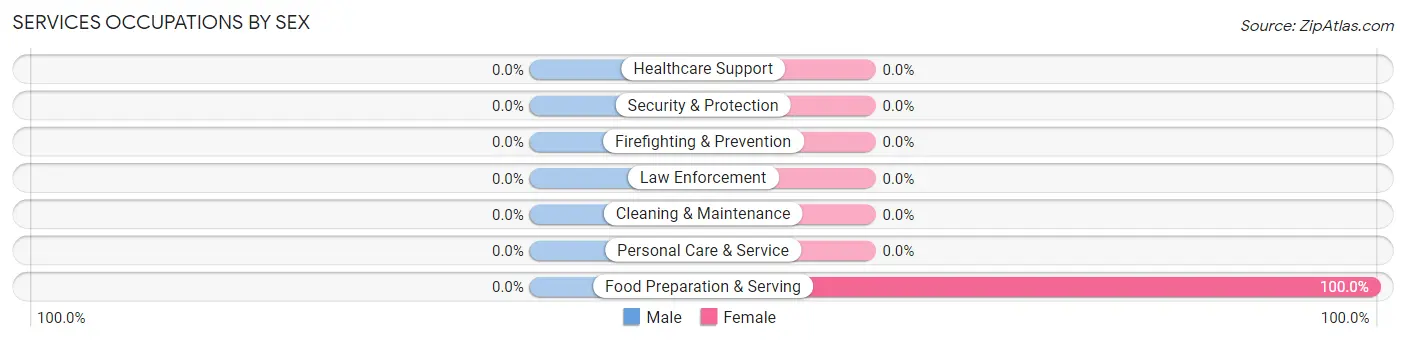
| Occupation | Male | Female |
| Healthcare Support | 0 (0.0%) | 0 (0.0%) |
| Security & Protection | 0 (0.0%) | 0 (0.0%) |
| Firefighting & Prevention | 0 (0.0%) | 0 (0.0%) |
| Law Enforcement | 0 (0.0%) | 0 (0.0%) |
| Food Preparation & Serving | 0 (0.0%) | 5 (100.0%) |
| Cleaning & Maintenance | 0 (0.0%) | 0 (0.0%) |
| Personal Care & Service | 0 (0.0%) | 0 (0.0%) |
| Total (Category) | 0 (0.0%) | 5 (100.0%) |
| Total (Overall) | 22 (53.7%) | 19 (46.3%) |
Sales and Office Occupations
The most common Sales and Office occupations in Trinity Center are Sales & Related (8 | 19.5%), and Office & Administration (4 | 9.8%).
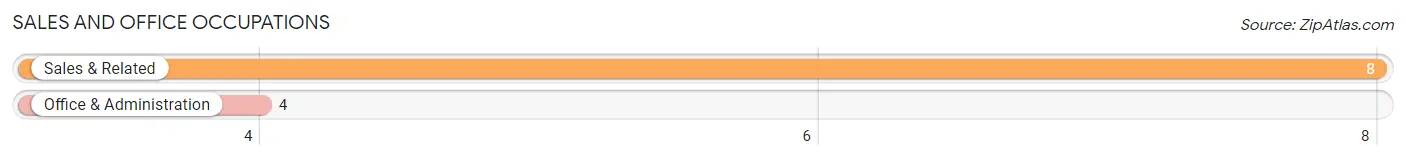
Sales and Office Occupations by Sex
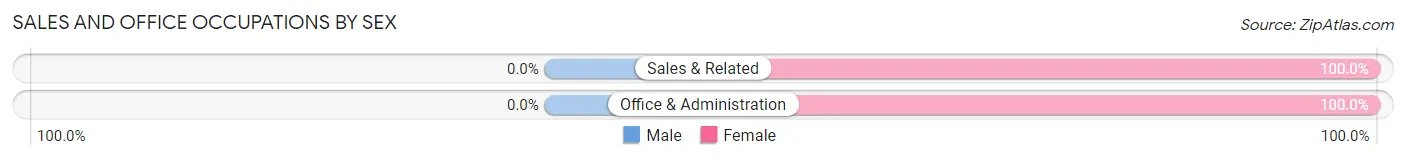
| Occupation | Male | Female |
| Sales & Related | 0 (0.0%) | 8 (100.0%) |
| Office & Administration | 0 (0.0%) | 4 (100.0%) |
| Total (Category) | 0 (0.0%) | 12 (100.0%) |
| Total (Overall) | 22 (53.7%) | 19 (46.3%) |
Natural Resources, Construction and Maintenance Occupations
The most common Natural Resources, Construction and Maintenance occupations in Trinity Center are Installation, Maintenance & Repair (12 | 29.3%), and Construction & Extraction (10 | 24.4%).
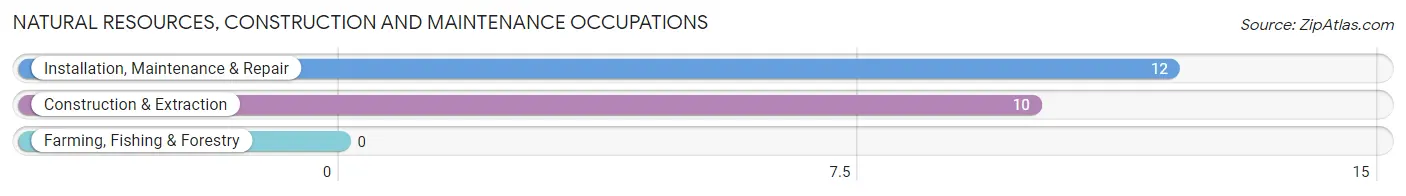
Natural Resources, Construction and Maintenance Occupations by Sex
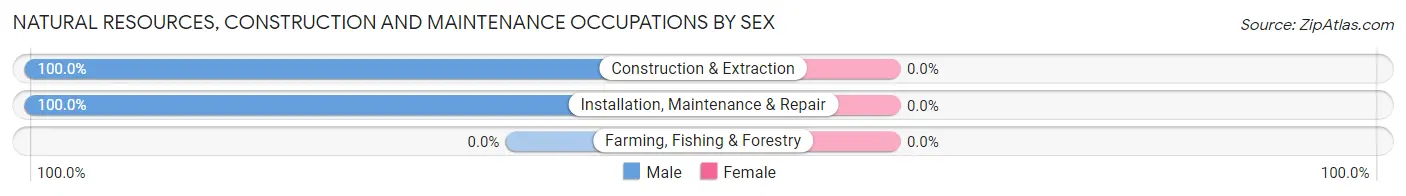
| Occupation | Male | Female |
| Farming, Fishing & Forestry | 0 (0.0%) | 0 (0.0%) |
| Construction & Extraction | 10 (100.0%) | 0 (0.0%) |
| Installation, Maintenance & Repair | 12 (100.0%) | 0 (0.0%) |
| Total (Category) | 22 (100.0%) | 0 (0.0%) |
| Total (Overall) | 22 (53.7%) | 19 (46.3%) |
Production, Transportation and Moving Occupations
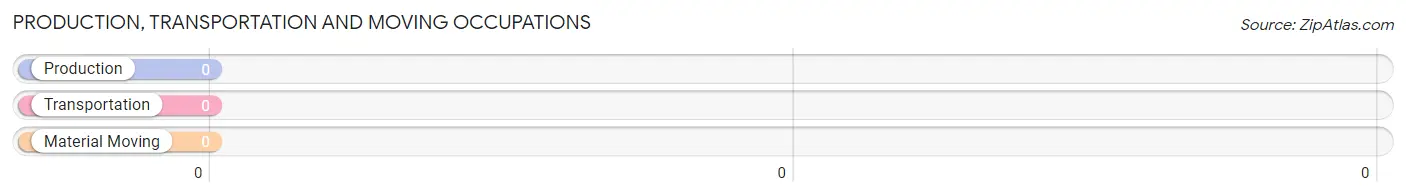
Production, Transportation and Moving Occupations by Sex
| Occupation | Male | Female |
| Production | 0 (0.0%) | 0 (0.0%) |
| Transportation | 0 (0.0%) | 0 (0.0%) |
| Material Moving | 0 (0.0%) | 0 (0.0%) |
| Total (Category) | 0 (0.0%) | 0 (0.0%) |
| Total (Overall) | 22 (53.7%) | 19 (46.3%) |
Employment Industries by Sex in Trinity Center
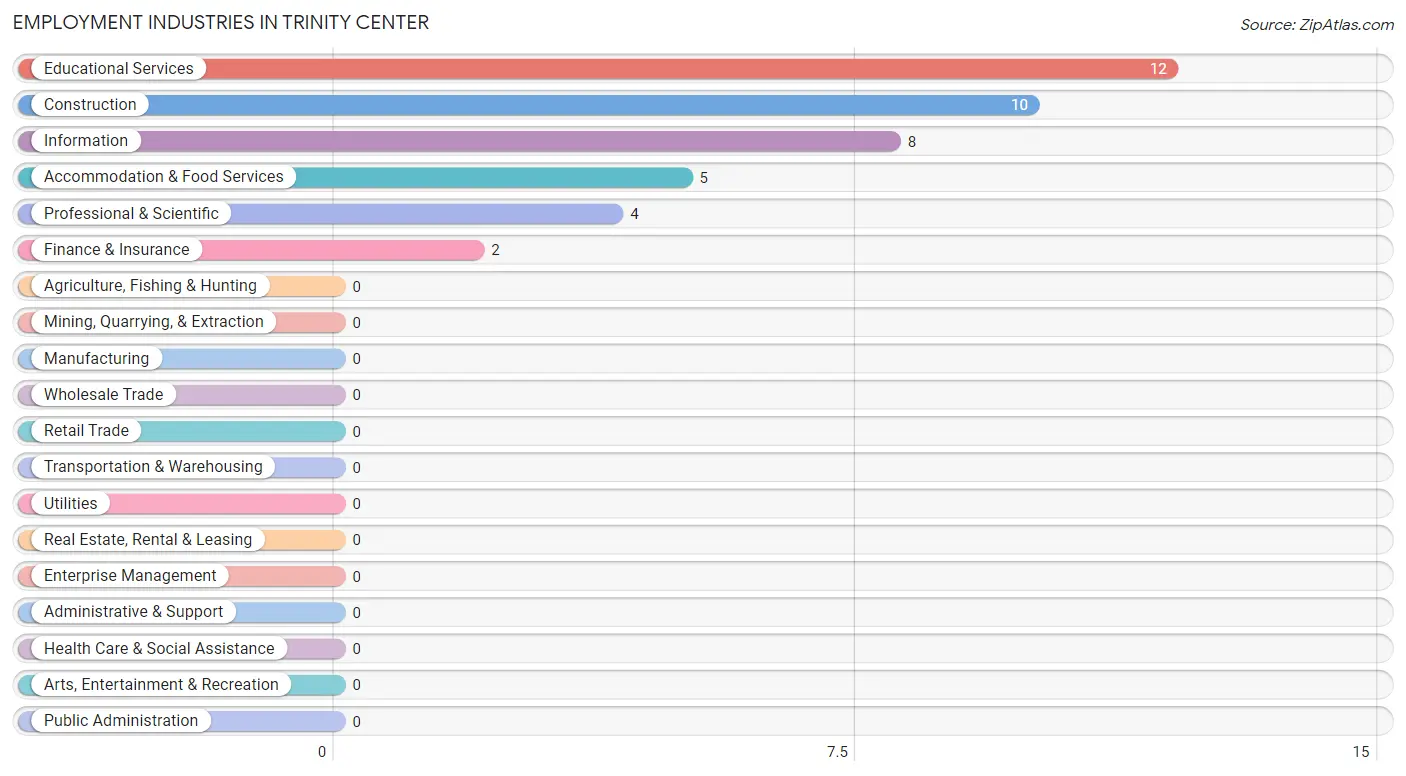
Employment Industries in Trinity Center
The major employment industries in Trinity Center include Educational Services (12 | 29.3%), Construction (10 | 24.4%), Information (8 | 19.5%), Accommodation & Food Services (5 | 12.2%), and Professional & Scientific (4 | 9.8%).
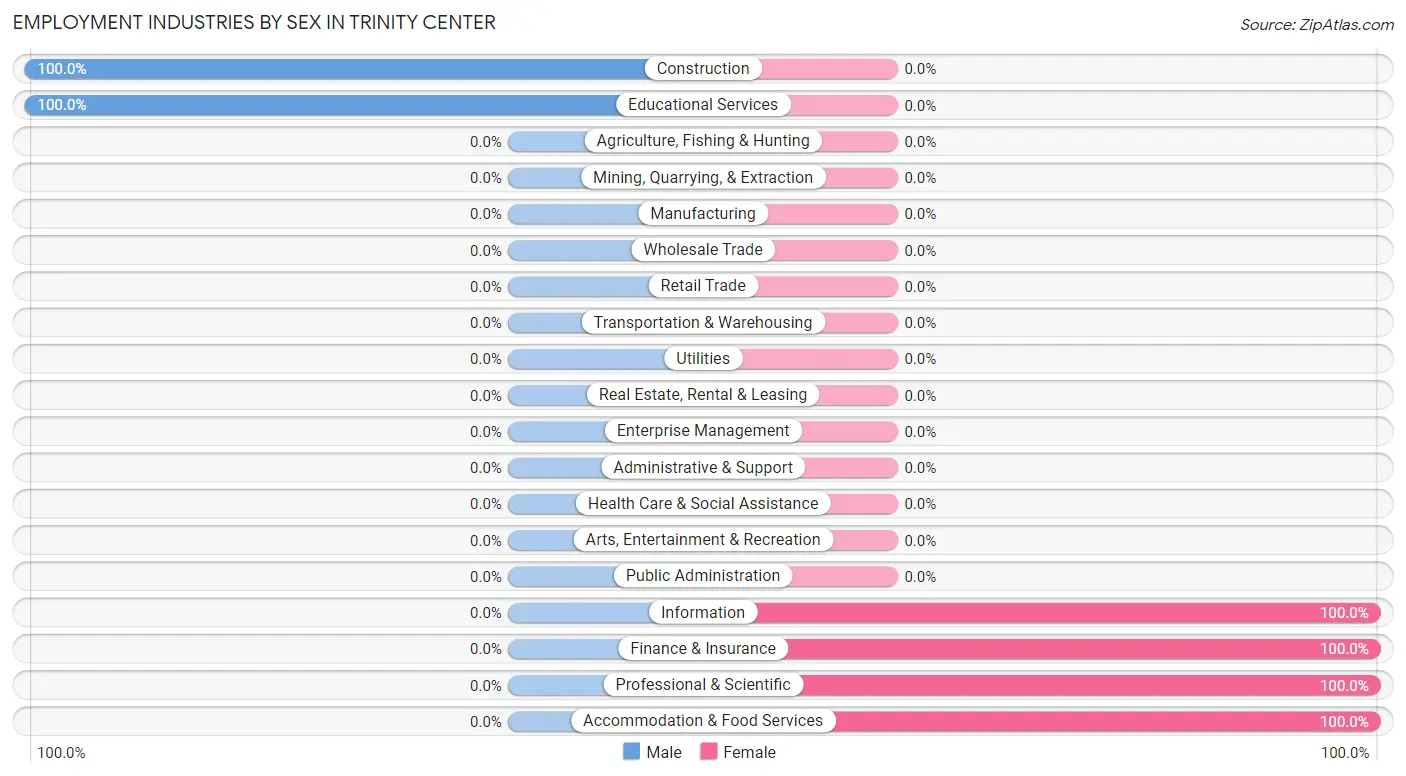
Employment Industries by Sex in Trinity Center
The Trinity Center industries that see more men than women are Construction (100.0%), and Educational Services (100.0%), whereas the industries that tend to have a higher number of women are Information (100.0%), Finance & Insurance (100.0%), and Professional & Scientific (100.0%).
| Industry | Male | Female |
| Agriculture, Fishing & Hunting | 0 (0.0%) | 0 (0.0%) |
| Mining, Quarrying, & Extraction | 0 (0.0%) | 0 (0.0%) |
| Construction | 10 (100.0%) | 0 (0.0%) |
| Manufacturing | 0 (0.0%) | 0 (0.0%) |
| Wholesale Trade | 0 (0.0%) | 0 (0.0%) |
| Retail Trade | 0 (0.0%) | 0 (0.0%) |
| Transportation & Warehousing | 0 (0.0%) | 0 (0.0%) |
| Utilities | 0 (0.0%) | 0 (0.0%) |
| Information | 0 (0.0%) | 8 (100.0%) |
| Finance & Insurance | 0 (0.0%) | 2 (100.0%) |
| Real Estate, Rental & Leasing | 0 (0.0%) | 0 (0.0%) |
| Professional & Scientific | 0 (0.0%) | 4 (100.0%) |
| Enterprise Management | 0 (0.0%) | 0 (0.0%) |
| Administrative & Support | 0 (0.0%) | 0 (0.0%) |
| Educational Services | 12 (100.0%) | 0 (0.0%) |
| Health Care & Social Assistance | 0 (0.0%) | 0 (0.0%) |
| Arts, Entertainment & Recreation | 0 (0.0%) | 0 (0.0%) |
| Accommodation & Food Services | 0 (0.0%) | 5 (100.0%) |
| Public Administration | 0 (0.0%) | 0 (0.0%) |
| Total | 22 (53.7%) | 19 (46.3%) |
Education in Trinity Center
School Enrollment in Trinity Center
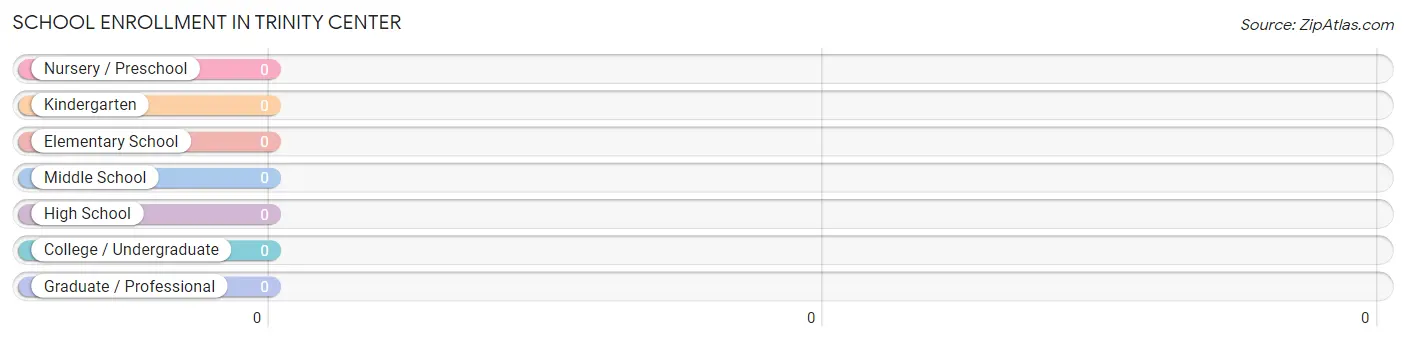
| School Level | # Students | % Students |
| Nursery / Preschool | 0 | 0.0% |
| Kindergarten | 0 | 0.0% |
| Elementary School | 0 | 0.0% |
| Middle School | 0 | 0.0% |
| High School | 0 | 0.0% |
| College / Undergraduate | 0 | 0.0% |
| Graduate / Professional | 0 | 0.0% |
| Total | 0 | 0.0% |
School Enrollment by Age by Funding Source in Trinity Center
| Age Bracket | Public School | Private School |
| 3 to 4 Year Olds | 0 (0.0%) | 0 (0.0%) |
| 5 to 9 Year Old | 0 (0.0%) | 0 (0.0%) |
| 10 to 14 Year Olds | 0 (0.0%) | 0 (0.0%) |
| 15 to 17 Year Olds | 0 (0.0%) | 0 (0.0%) |
| 18 to 19 Year Olds | 0 (0.0%) | 0 (0.0%) |
| 20 to 24 Year Olds | 0 (0.0%) | 0 (0.0%) |
| 25 to 34 Year Olds | 0 (0.0%) | 0 (0.0%) |
| 35 Years and over | 0 (0.0%) | 0 (0.0%) |
| Total | 0 (0.0%) | 0 (0.0%) |
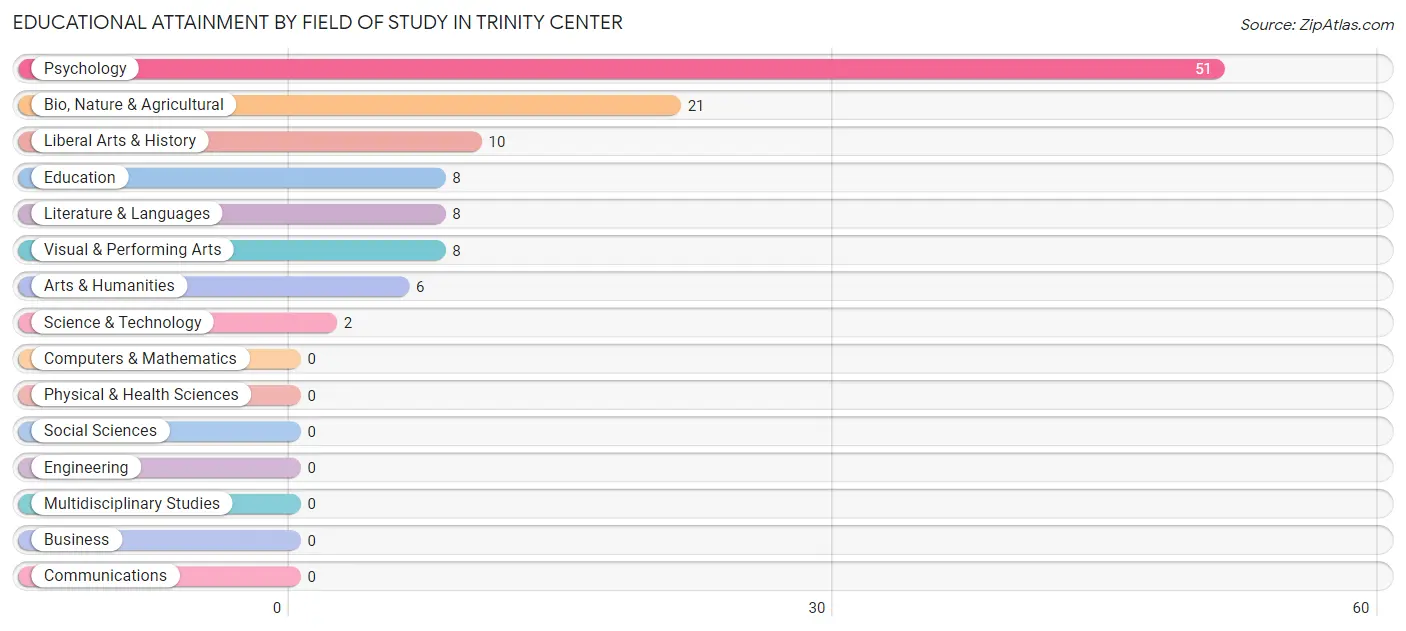
Educational Attainment by Field of Study in Trinity Center
Psychology (51 | 44.7%), bio, nature & agricultural (21 | 18.4%), liberal arts & history (10 | 8.8%), education (8 | 7.0%), and literature & languages (8 | 7.0%) are the most common fields of study among 114 individuals in Trinity Center who have obtained a bachelor's degree or higher.
| Field of Study | # Graduates | % Graduates |
| Computers & Mathematics | 0 | 0.0% |
| Bio, Nature & Agricultural | 21 | 18.4% |
| Physical & Health Sciences | 0 | 0.0% |
| Psychology | 51 | 44.7% |
| Social Sciences | 0 | 0.0% |
| Engineering | 0 | 0.0% |
| Multidisciplinary Studies | 0 | 0.0% |
| Science & Technology | 2 | 1.8% |
| Business | 0 | 0.0% |
| Education | 8 | 7.0% |
| Literature & Languages | 8 | 7.0% |
| Liberal Arts & History | 10 | 8.8% |
| Visual & Performing Arts | 8 | 7.0% |
| Communications | 0 | 0.0% |
| Arts & Humanities | 6 | 5.3% |
| Total | 114 | 100.0% |
Transportation & Commute in Trinity Center
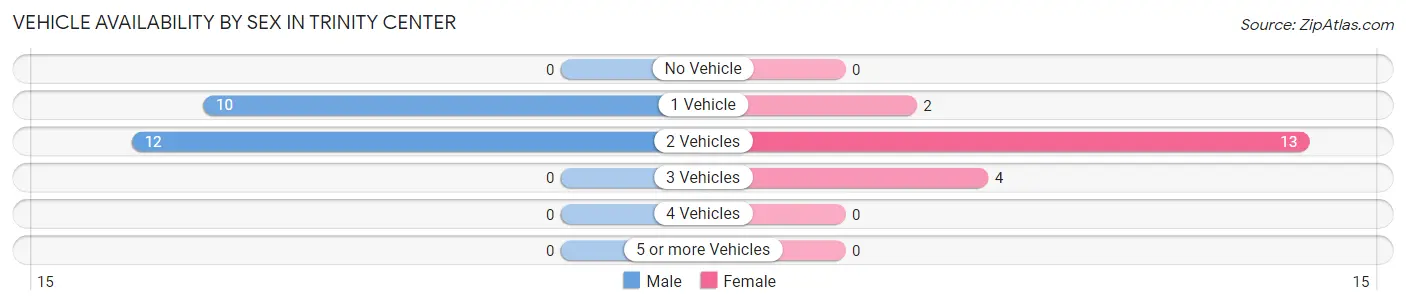
Vehicle Availability by Sex in Trinity Center
The most prevalent vehicle ownership categories in Trinity Center are males with 2 vehicles (12, accounting for 54.5%) and females with 2 vehicles (13, making up 63.2%).
| Vehicles Available | Male | Female |
| No Vehicle | 0 (0.0%) | 0 (0.0%) |
| 1 Vehicle | 10 (45.5%) | 2 (10.5%) |
| 2 Vehicles | 12 (54.5%) | 13 (68.4%) |
| 3 Vehicles | 0 (0.0%) | 4 (21.0%) |
| 4 Vehicles | 0 (0.0%) | 0 (0.0%) |
| 5 or more Vehicles | 0 (0.0%) | 0 (0.0%) |
| Total | 22 (100.0%) | 19 (100.0%) |
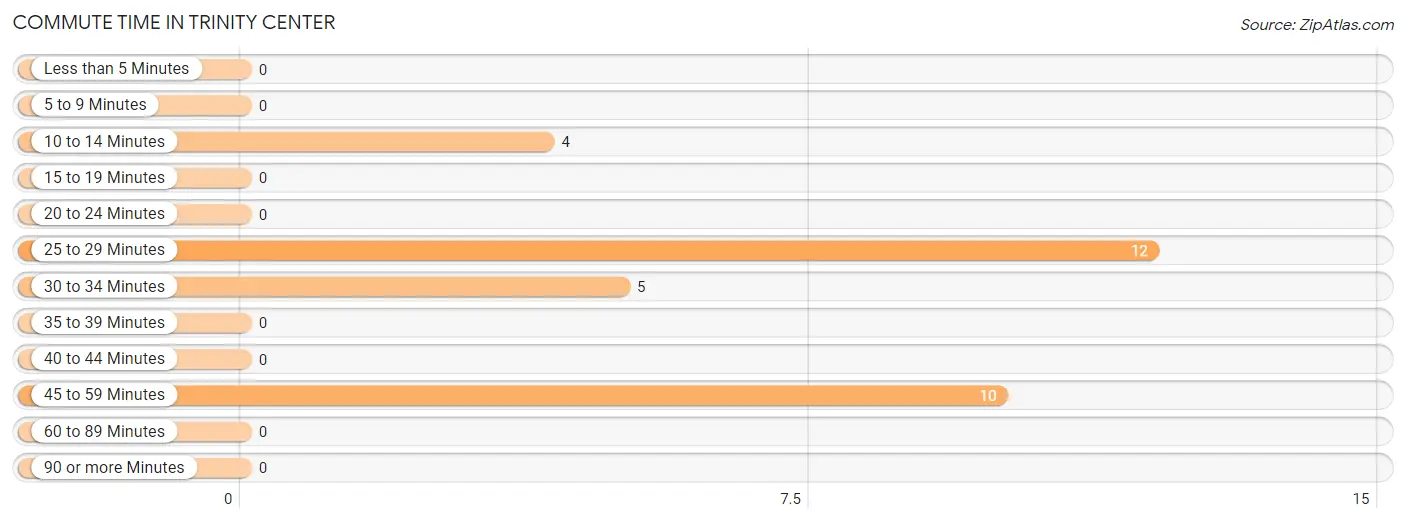
Commute Time in Trinity Center
The most frequently occuring commute durations in Trinity Center are 25 to 29 minutes (12 commuters, 38.7%), 45 to 59 minutes (10 commuters, 32.3%), and 30 to 34 minutes (5 commuters, 16.1%).
| Commute Time | # Commuters | % Commuters |
| Less than 5 Minutes | 0 | 0.0% |
| 5 to 9 Minutes | 0 | 0.0% |
| 10 to 14 Minutes | 4 | 12.9% |
| 15 to 19 Minutes | 0 | 0.0% |
| 20 to 24 Minutes | 0 | 0.0% |
| 25 to 29 Minutes | 12 | 38.7% |
| 30 to 34 Minutes | 5 | 16.1% |
| 35 to 39 Minutes | 0 | 0.0% |
| 40 to 44 Minutes | 0 | 0.0% |
| 45 to 59 Minutes | 10 | 32.3% |
| 60 to 89 Minutes | 0 | 0.0% |
| 90 or more Minutes | 0 | 0.0% |
Commute Time by Sex in Trinity Center
The most common commute times in Trinity Center are 25 to 29 minutes (12 commuters, 100.0%) for males and 45 to 59 minutes (10 commuters, 52.6%) for females.
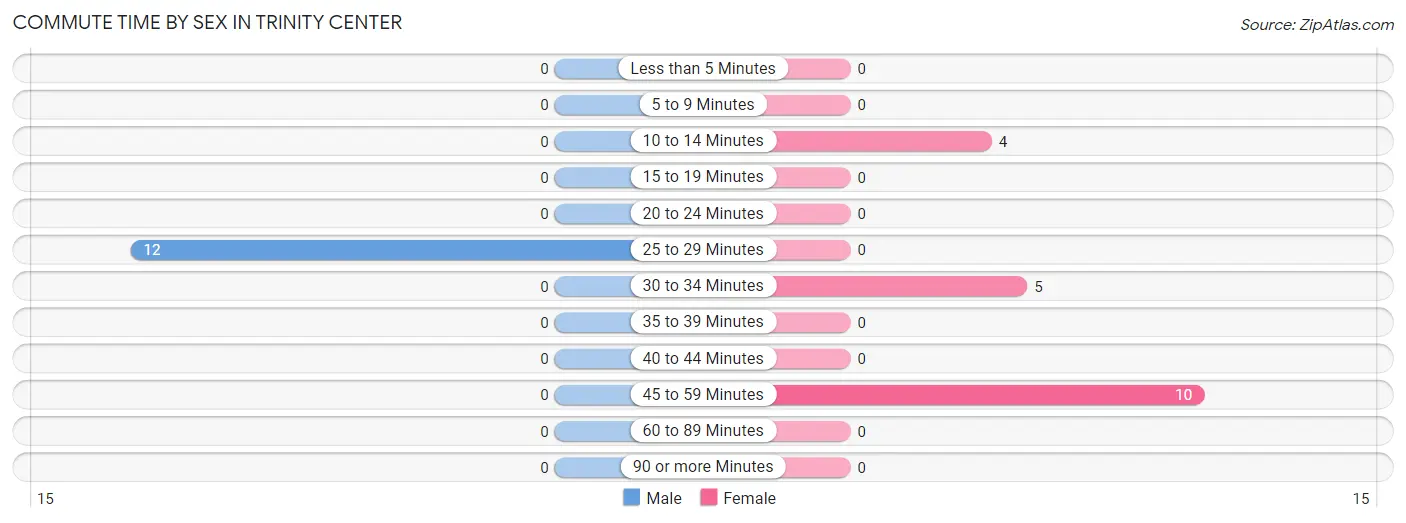
| Commute Time | Male | Female |
| Less than 5 Minutes | 0 (0.0%) | 0 (0.0%) |
| 5 to 9 Minutes | 0 (0.0%) | 0 (0.0%) |
| 10 to 14 Minutes | 0 (0.0%) | 4 (21.0%) |
| 15 to 19 Minutes | 0 (0.0%) | 0 (0.0%) |
| 20 to 24 Minutes | 0 (0.0%) | 0 (0.0%) |
| 25 to 29 Minutes | 12 (100.0%) | 0 (0.0%) |
| 30 to 34 Minutes | 0 (0.0%) | 5 (26.3%) |
| 35 to 39 Minutes | 0 (0.0%) | 0 (0.0%) |
| 40 to 44 Minutes | 0 (0.0%) | 0 (0.0%) |
| 45 to 59 Minutes | 0 (0.0%) | 10 (52.6%) |
| 60 to 89 Minutes | 0 (0.0%) | 0 (0.0%) |
| 90 or more Minutes | 0 (0.0%) | 0 (0.0%) |
Time of Departure to Work by Sex in Trinity Center
The most frequent times of departure to work in Trinity Center are 9:00 AM to 9:59 AM (12, 100.0%) for males and 6:00 AM to 6:29 AM (8, 42.1%) for females.
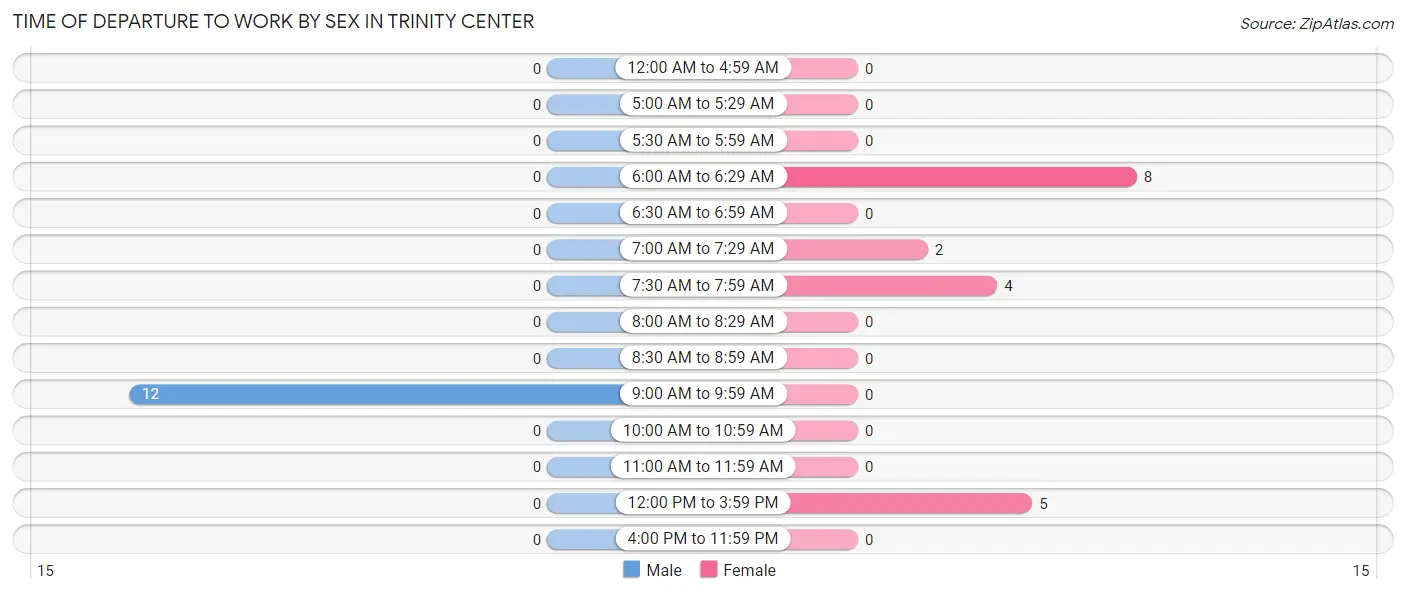
| Time of Departure | Male | Female |
| 12:00 AM to 4:59 AM | 0 (0.0%) | 0 (0.0%) |
| 5:00 AM to 5:29 AM | 0 (0.0%) | 0 (0.0%) |
| 5:30 AM to 5:59 AM | 0 (0.0%) | 0 (0.0%) |
| 6:00 AM to 6:29 AM | 0 (0.0%) | 8 (42.1%) |
| 6:30 AM to 6:59 AM | 0 (0.0%) | 0 (0.0%) |
| 7:00 AM to 7:29 AM | 0 (0.0%) | 2 (10.5%) |
| 7:30 AM to 7:59 AM | 0 (0.0%) | 4 (21.0%) |
| 8:00 AM to 8:29 AM | 0 (0.0%) | 0 (0.0%) |
| 8:30 AM to 8:59 AM | 0 (0.0%) | 0 (0.0%) |
| 9:00 AM to 9:59 AM | 12 (100.0%) | 0 (0.0%) |
| 10:00 AM to 10:59 AM | 0 (0.0%) | 0 (0.0%) |
| 11:00 AM to 11:59 AM | 0 (0.0%) | 0 (0.0%) |
| 12:00 PM to 3:59 PM | 0 (0.0%) | 5 (26.3%) |
| 4:00 PM to 11:59 PM | 0 (0.0%) | 0 (0.0%) |
| Total | 12 (100.0%) | 19 (100.0%) |
Housing Occupancy in Trinity Center
Occupancy by Ownership in Trinity Center
Of the total 135 dwellings in Trinity Center, owner-occupied units account for 127 (94.1%), while renter-occupied units make up 8 (5.9%).
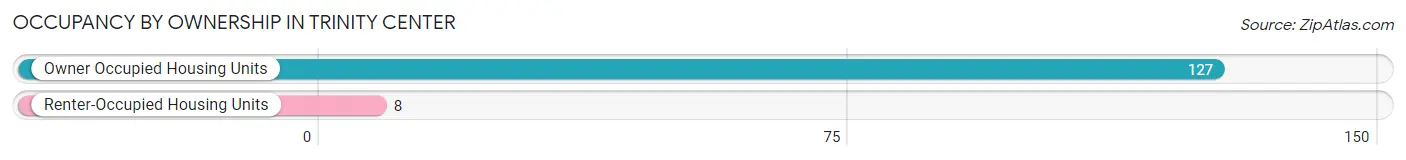
| Occupancy | # Housing Units | % Housing Units |
| Owner Occupied Housing Units | 127 | 94.1% |
| Renter-Occupied Housing Units | 8 | 5.9% |
| Total Occupied Housing Units | 135 | 100.0% |
Occupancy by Household Size in Trinity Center
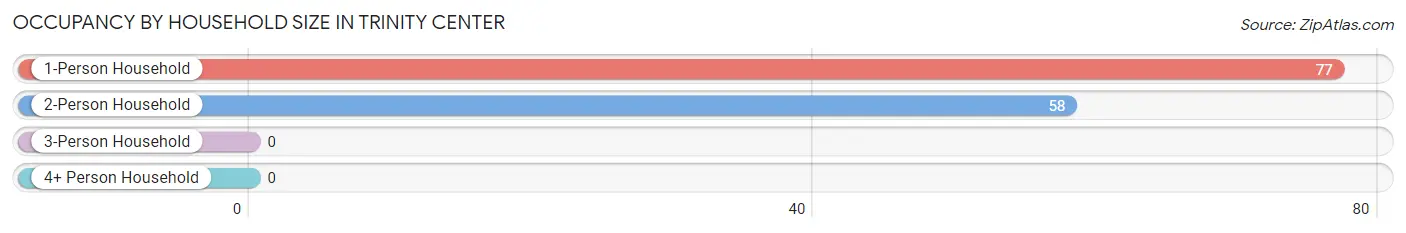
| Household Size | # Housing Units | % Housing Units |
| 1-Person Household | 77 | 57.0% |
| 2-Person Household | 58 | 43.0% |
| 3-Person Household | 0 | 0.0% |
| 4+ Person Household | 0 | 0.0% |
| Total Housing Units | 135 | 100.0% |
Occupancy by Ownership by Household Size in Trinity Center
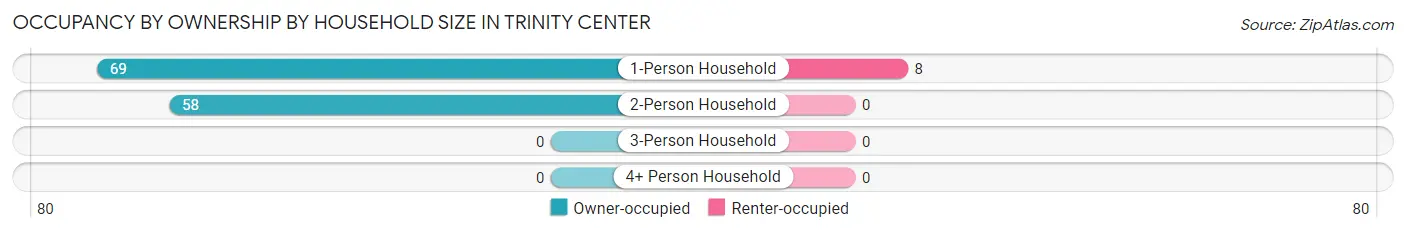
| Household Size | Owner-occupied | Renter-occupied |
| 1-Person Household | 69 (89.6%) | 8 (10.4%) |
| 2-Person Household | 58 (100.0%) | 0 (0.0%) |
| 3-Person Household | 0 (0.0%) | 0 (0.0%) |
| 4+ Person Household | 0 (0.0%) | 0 (0.0%) |
| Total Housing Units | 127 (94.1%) | 8 (5.9%) |
Occupancy by Educational Attainment in Trinity Center
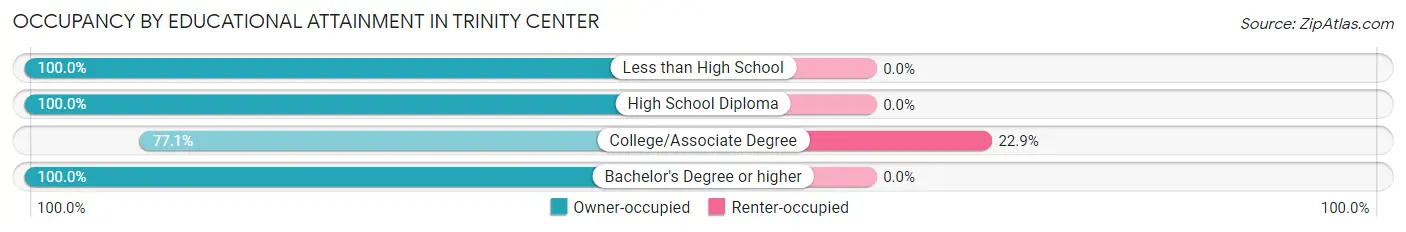
| Household Size | Owner-occupied | Renter-occupied |
| Less than High School | 2 (100.0%) | 0 (0.0%) |
| High School Diploma | 50 (100.0%) | 0 (0.0%) |
| College/Associate Degree | 27 (77.1%) | 8 (22.9%) |
| Bachelor's Degree or higher | 48 (100.0%) | 0 (0.0%) |
Occupancy by Age of Householder in Trinity Center
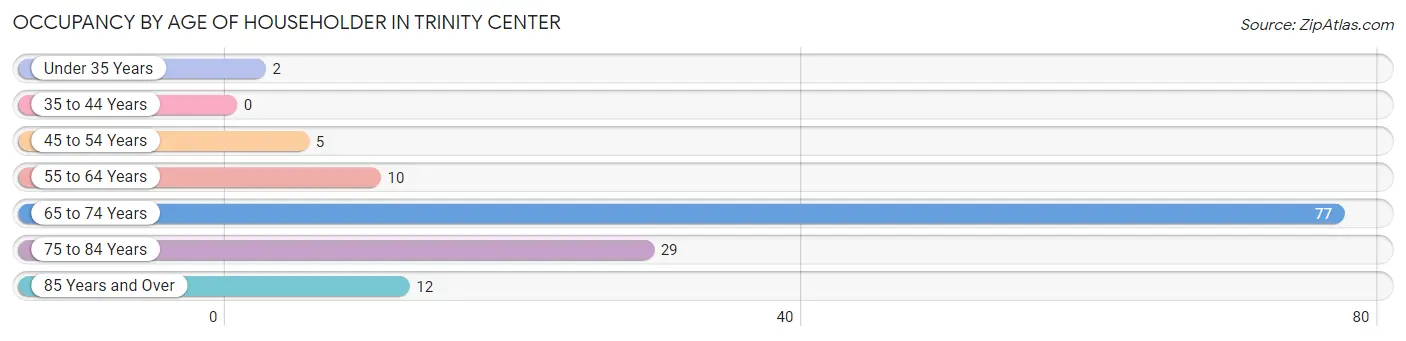
| Age Bracket | # Households | % Households |
| Under 35 Years | 2 | 1.5% |
| 35 to 44 Years | 0 | 0.0% |
| 45 to 54 Years | 5 | 3.7% |
| 55 to 64 Years | 10 | 7.4% |
| 65 to 74 Years | 77 | 57.0% |
| 75 to 84 Years | 29 | 21.5% |
| 85 Years and Over | 12 | 8.9% |
| Total | 135 | 100.0% |
Housing Finances in Trinity Center
Median Income by Occupancy in Trinity Center
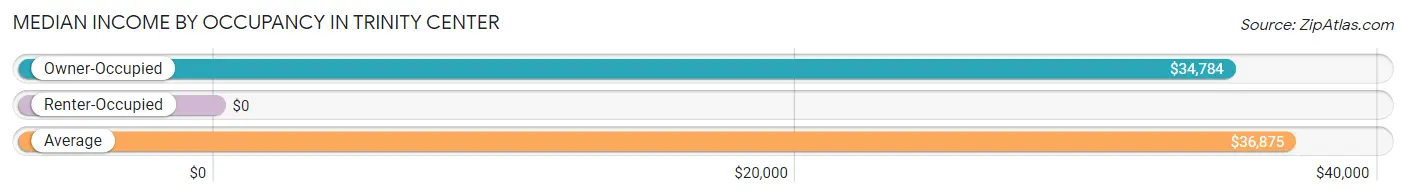
| Occupancy Type | # Households | Median Income |
| Owner-Occupied | 127 (94.1%) | $34,784 |
| Renter-Occupied | 8 (5.9%) | $0 |
| Average | 135 (100.0%) | $36,875 |
Occupancy by Householder Income Bracket in Trinity Center
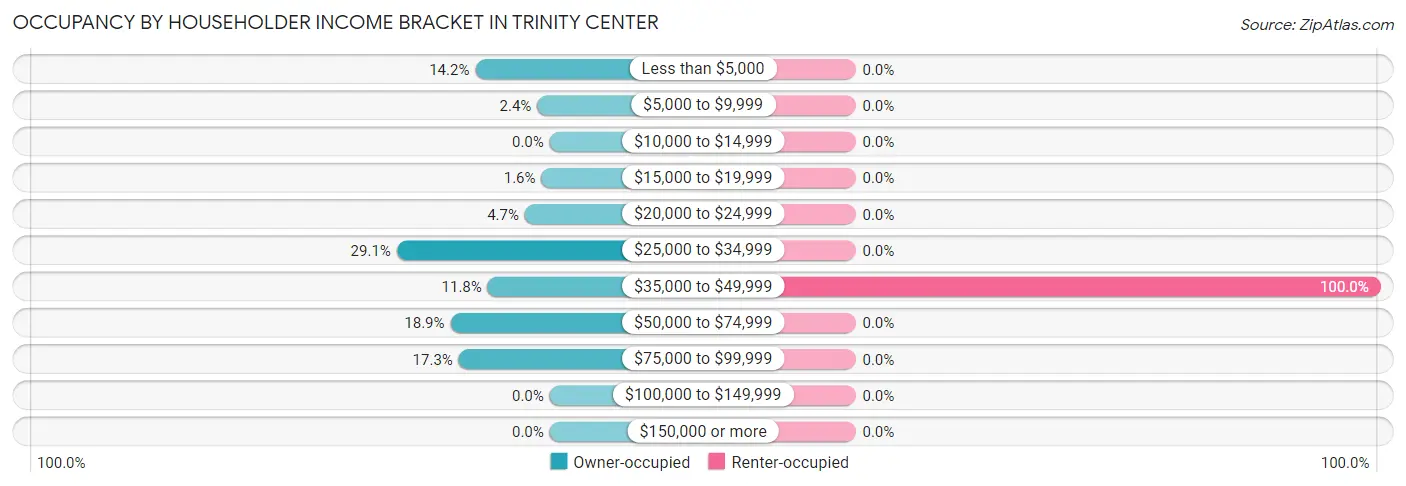
| Income Bracket | Owner-occupied | Renter-occupied |
| Less than $5,000 | 18 (14.2%) | 0 (0.0%) |
| $5,000 to $9,999 | 3 (2.4%) | 0 (0.0%) |
| $10,000 to $14,999 | 0 (0.0%) | 0 (0.0%) |
| $15,000 to $19,999 | 2 (1.6%) | 0 (0.0%) |
| $20,000 to $24,999 | 6 (4.7%) | 0 (0.0%) |
| $25,000 to $34,999 | 37 (29.1%) | 0 (0.0%) |
| $35,000 to $49,999 | 15 (11.8%) | 8 (100.0%) |
| $50,000 to $74,999 | 24 (18.9%) | 0 (0.0%) |
| $75,000 to $99,999 | 22 (17.3%) | 0 (0.0%) |
| $100,000 to $149,999 | 0 (0.0%) | 0 (0.0%) |
| $150,000 or more | 0 (0.0%) | 0 (0.0%) |
| Total | 127 (100.0%) | 8 (100.0%) |
Monthly Housing Cost Tiers in Trinity Center
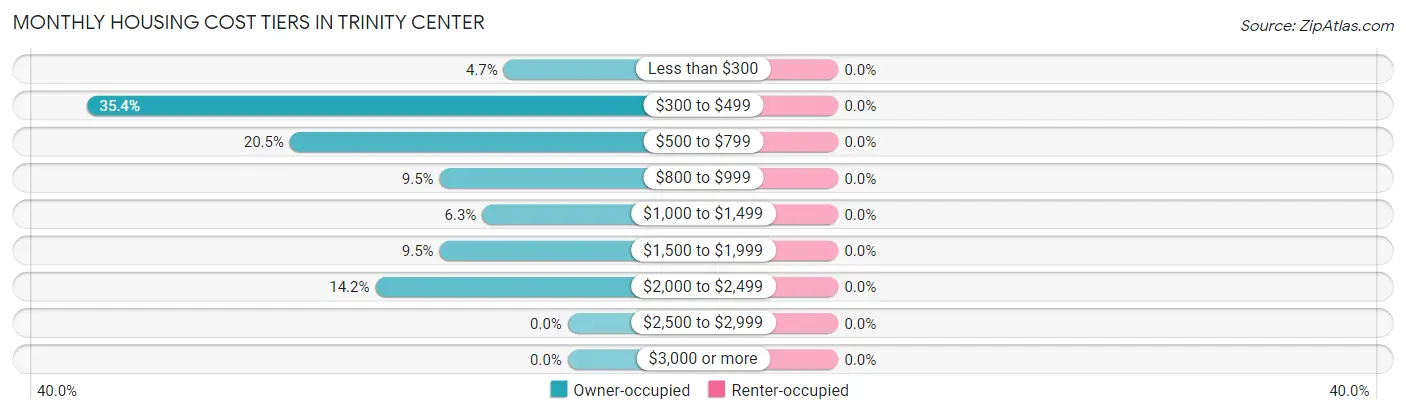
| Monthly Cost | Owner-occupied | Renter-occupied |
| Less than $300 | 6 (4.7%) | 0 (0.0%) |
| $300 to $499 | 45 (35.4%) | 0 (0.0%) |
| $500 to $799 | 26 (20.5%) | 0 (0.0%) |
| $800 to $999 | 12 (9.5%) | 0 (0.0%) |
| $1,000 to $1,499 | 8 (6.3%) | 0 (0.0%) |
| $1,500 to $1,999 | 12 (9.5%) | 0 (0.0%) |
| $2,000 to $2,499 | 18 (14.2%) | 0 (0.0%) |
| $2,500 to $2,999 | 0 (0.0%) | 0 (0.0%) |
| $3,000 or more | 0 (0.0%) | 0 (0.0%) |
| Total | 127 (100.0%) | 8 (100.0%) |
Physical Housing Characteristics in Trinity Center
Housing Structures in Trinity Center
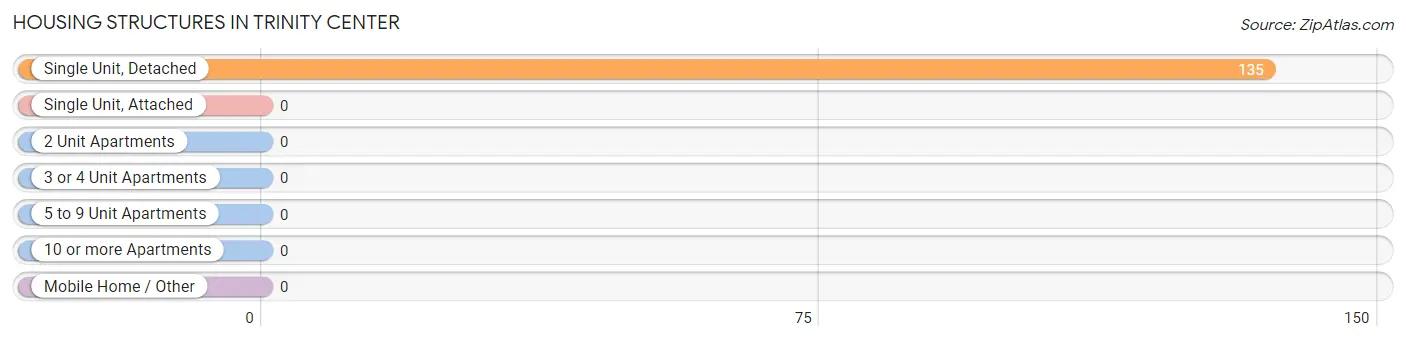
| Structure Type | # Housing Units | % Housing Units |
| Single Unit, Detached | 135 | 100.0% |
| Single Unit, Attached | 0 | 0.0% |
| 2 Unit Apartments | 0 | 0.0% |
| 3 or 4 Unit Apartments | 0 | 0.0% |
| 5 to 9 Unit Apartments | 0 | 0.0% |
| 10 or more Apartments | 0 | 0.0% |
| Mobile Home / Other | 0 | 0.0% |
| Total | 135 | 100.0% |
Housing Structures by Occupancy in Trinity Center
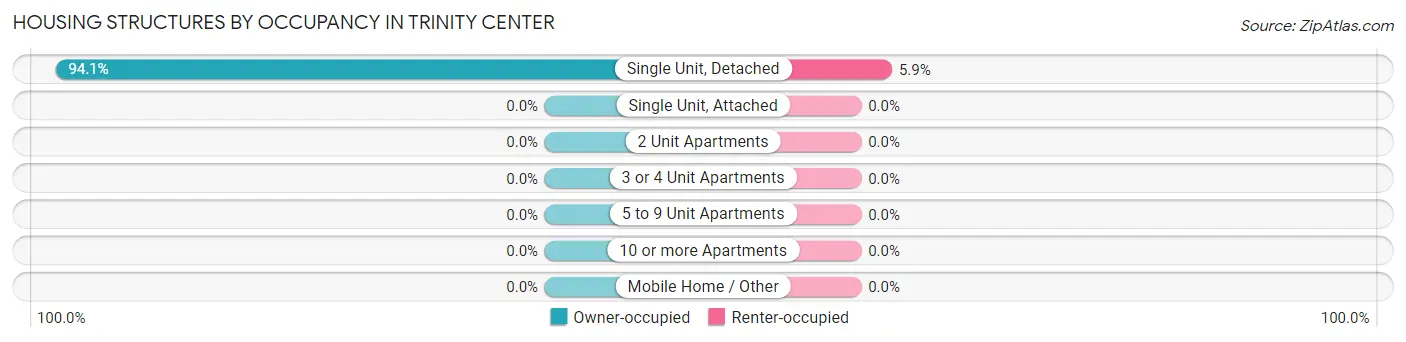
| Structure Type | Owner-occupied | Renter-occupied |
| Single Unit, Detached | 127 (94.1%) | 8 (5.9%) |
| Single Unit, Attached | 0 (0.0%) | 0 (0.0%) |
| 2 Unit Apartments | 0 (0.0%) | 0 (0.0%) |
| 3 or 4 Unit Apartments | 0 (0.0%) | 0 (0.0%) |
| 5 to 9 Unit Apartments | 0 (0.0%) | 0 (0.0%) |
| 10 or more Apartments | 0 (0.0%) | 0 (0.0%) |
| Mobile Home / Other | 0 (0.0%) | 0 (0.0%) |
| Total | 127 (94.1%) | 8 (5.9%) |
Housing Structures by Number of Rooms in Trinity Center
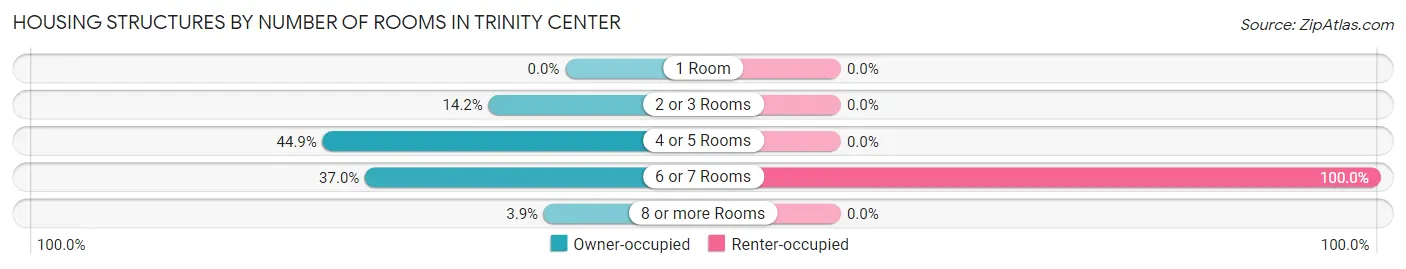
| Number of Rooms | Owner-occupied | Renter-occupied |
| 1 Room | 0 (0.0%) | 0 (0.0%) |
| 2 or 3 Rooms | 18 (14.2%) | 0 (0.0%) |
| 4 or 5 Rooms | 57 (44.9%) | 0 (0.0%) |
| 6 or 7 Rooms | 47 (37.0%) | 8 (100.0%) |
| 8 or more Rooms | 5 (3.9%) | 0 (0.0%) |
| Total | 127 (100.0%) | 8 (100.0%) |
Housing Structure by Heating Type in Trinity Center
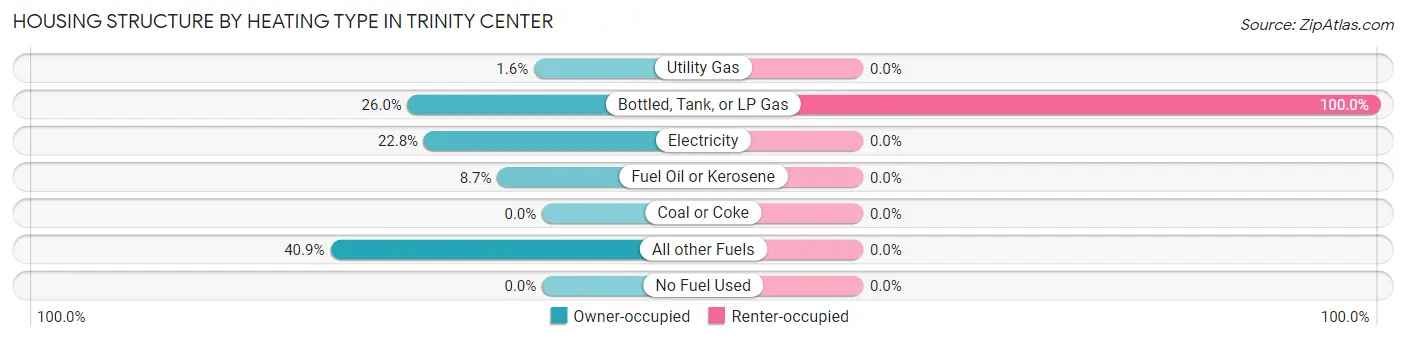
| Heating Type | Owner-occupied | Renter-occupied |
| Utility Gas | 2 (1.6%) | 0 (0.0%) |
| Bottled, Tank, or LP Gas | 33 (26.0%) | 8 (100.0%) |
| Electricity | 29 (22.8%) | 0 (0.0%) |
| Fuel Oil or Kerosene | 11 (8.7%) | 0 (0.0%) |
| Coal or Coke | 0 (0.0%) | 0 (0.0%) |
| All other Fuels | 52 (40.9%) | 0 (0.0%) |
| No Fuel Used | 0 (0.0%) | 0 (0.0%) |
| Total | 127 (100.0%) | 8 (100.0%) |
Household Vehicle Usage in Trinity Center
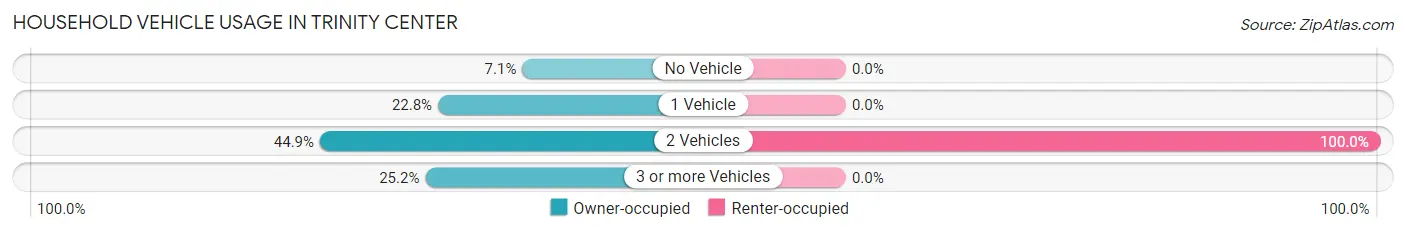
| Vehicles per Household | Owner-occupied | Renter-occupied |
| No Vehicle | 9 (7.1%) | 0 (0.0%) |
| 1 Vehicle | 29 (22.8%) | 0 (0.0%) |
| 2 Vehicles | 57 (44.9%) | 8 (100.0%) |
| 3 or more Vehicles | 32 (25.2%) | 0 (0.0%) |
| Total | 127 (100.0%) | 8 (100.0%) |
Real Estate & Mortgages in Trinity Center
Real Estate and Mortgage Overview in Trinity Center
| Characteristic | Without Mortgage | With Mortgage |
| Housing Units | 92 | 35 |
| Median Property Value | $252,900 | $336,700 |
| Median Household Income | $33,438 | $0 |
| Monthly Housing Costs | $486 | $0 |
| Real Estate Taxes | $1,667 | $0 |
Property Value by Mortgage Status in Trinity Center
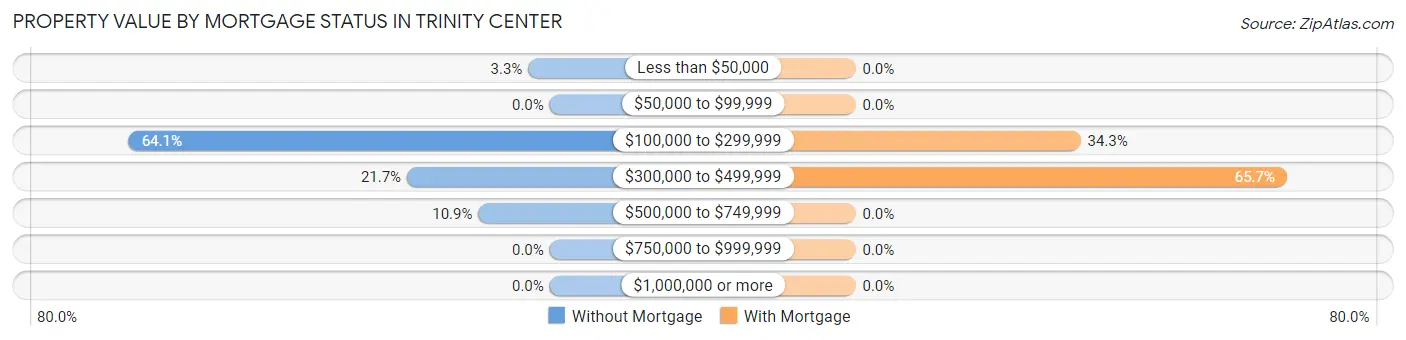
| Property Value | Without Mortgage | With Mortgage |
| Less than $50,000 | 3 (3.3%) | 0 (0.0%) |
| $50,000 to $99,999 | 0 (0.0%) | 0 (0.0%) |
| $100,000 to $299,999 | 59 (64.1%) | 12 (34.3%) |
| $300,000 to $499,999 | 20 (21.7%) | 23 (65.7%) |
| $500,000 to $749,999 | 10 (10.9%) | 0 (0.0%) |
| $750,000 to $999,999 | 0 (0.0%) | 0 (0.0%) |
| $1,000,000 or more | 0 (0.0%) | 0 (0.0%) |
| Total | 92 (100.0%) | 35 (100.0%) |
Household Income by Mortgage Status in Trinity Center
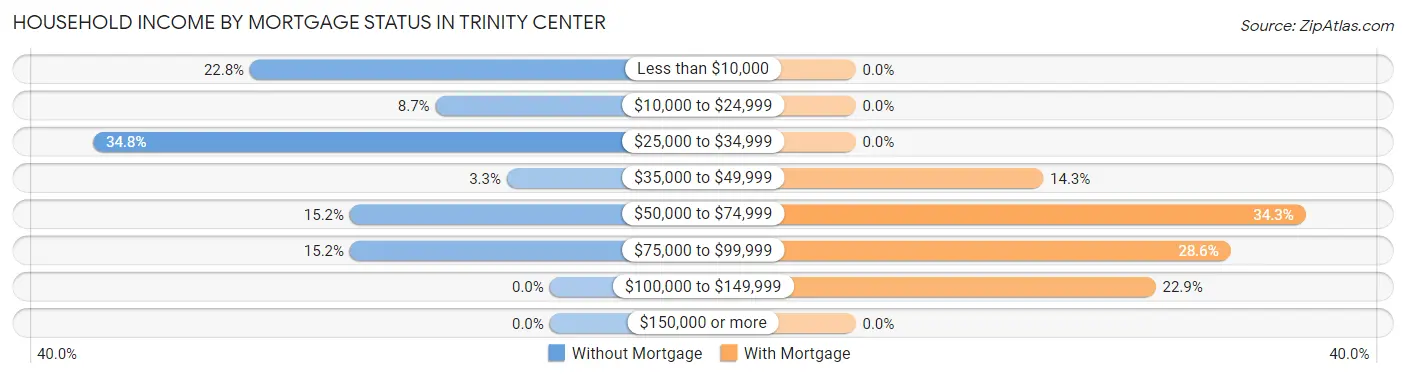
| Household Income | Without Mortgage | With Mortgage |
| Less than $10,000 | 21 (22.8%) | 0 (0.0%) |
| $10,000 to $24,999 | 8 (8.7%) | 0 (0.0%) |
| $25,000 to $34,999 | 32 (34.8%) | 0 (0.0%) |
| $35,000 to $49,999 | 3 (3.3%) | 5 (14.3%) |
| $50,000 to $74,999 | 14 (15.2%) | 12 (34.3%) |
| $75,000 to $99,999 | 14 (15.2%) | 10 (28.6%) |
| $100,000 to $149,999 | 0 (0.0%) | 8 (22.9%) |
| $150,000 or more | 0 (0.0%) | 0 (0.0%) |
| Total | 92 (100.0%) | 35 (100.0%) |
Property Value to Household Income Ratio in Trinity Center
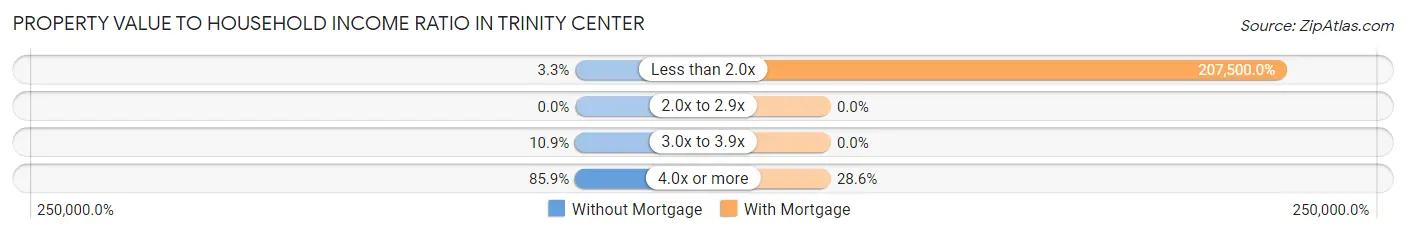
| Value-to-Income Ratio | Without Mortgage | With Mortgage |
| Less than 2.0x | 3 (3.3%) | 72,625 (207,500.0%) |
| 2.0x to 2.9x | 0 (0.0%) | 0 (0.0%) |
| 3.0x to 3.9x | 10 (10.9%) | 0 (0.0%) |
| 4.0x or more | 79 (85.9%) | 10 (28.6%) |
| Total | 92 (100.0%) | 35 (100.0%) |
Real Estate Taxes by Mortgage Status in Trinity Center
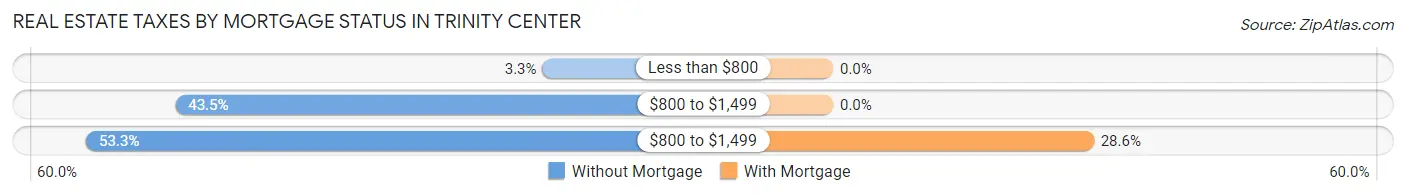
| Property Taxes | Without Mortgage | With Mortgage |
| Less than $800 | 3 (3.3%) | 0 (0.0%) |
| $800 to $1,499 | 40 (43.5%) | 0 (0.0%) |
| $800 to $1,499 | 49 (53.3%) | 10 (28.6%) |
| Total | 92 (100.0%) | 35 (100.0%) |
Health & Disability in Trinity Center
Health Insurance Coverage by Age in Trinity Center
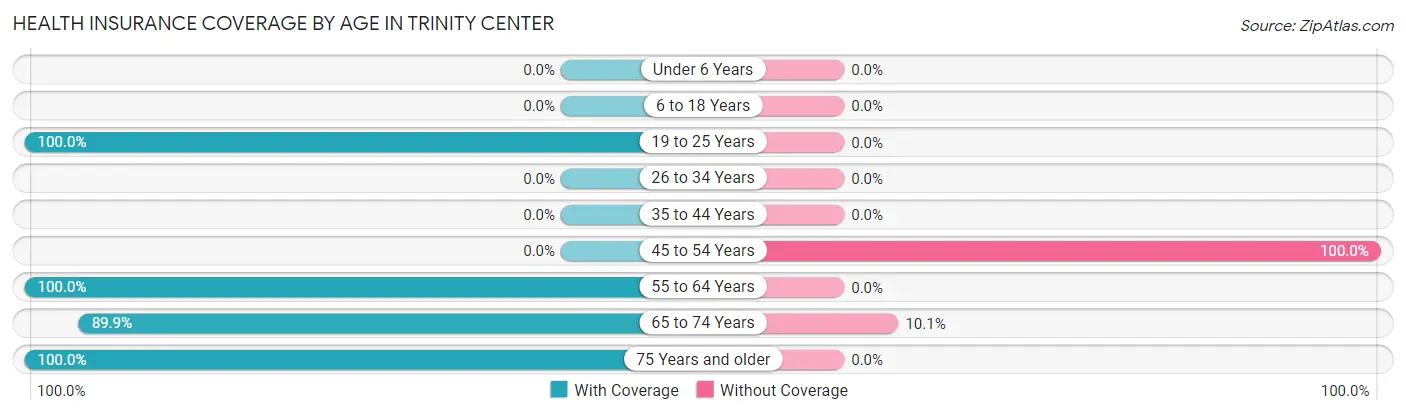
| Age Bracket | With Coverage | Without Coverage |
| Under 6 Years | 0 (0.0%) | 0 (0.0%) |
| 6 to 18 Years | 0 (0.0%) | 0 (0.0%) |
| 19 to 25 Years | 2 (100.0%) | 0 (0.0%) |
| 26 to 34 Years | 0 (0.0%) | 0 (0.0%) |
| 35 to 44 Years | 0 (0.0%) | 0 (0.0%) |
| 45 to 54 Years | 0 (0.0%) | 5 (100.0%) |
| 55 to 64 Years | 22 (100.0%) | 0 (0.0%) |
| 65 to 74 Years | 89 (89.9%) | 10 (10.1%) |
| 75 Years and older | 122 (100.0%) | 0 (0.0%) |
| Total | 235 (94.0%) | 15 (6.0%) |
Health Insurance Coverage by Citizenship Status in Trinity Center
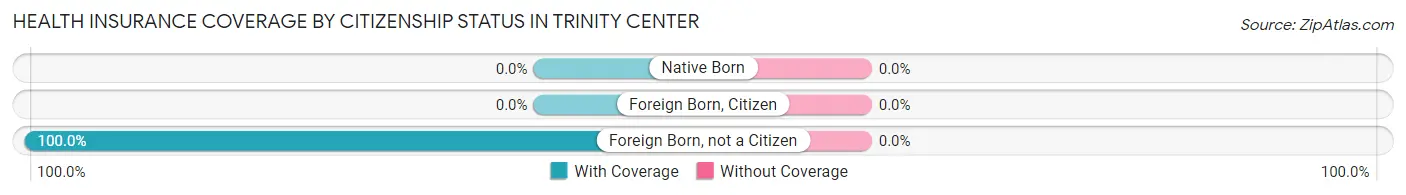
| Citizenship Status | With Coverage | Without Coverage |
| Native Born | 0 (0.0%) | 0 (0.0%) |
| Foreign Born, Citizen | 0 (0.0%) | 0 (0.0%) |
| Foreign Born, not a Citizen | 2 (100.0%) | 0 (0.0%) |
Health Insurance Coverage by Household Income in Trinity Center
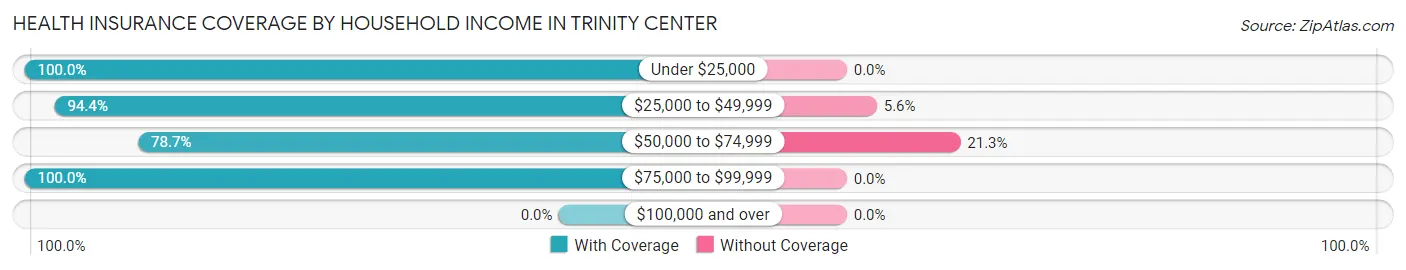
| Household Income | With Coverage | Without Coverage |
| Under $25,000 | 29 (100.0%) | 0 (0.0%) |
| $25,000 to $49,999 | 84 (94.4%) | 5 (5.6%) |
| $50,000 to $74,999 | 37 (78.7%) | 10 (21.3%) |
| $75,000 to $99,999 | 85 (100.0%) | 0 (0.0%) |
| $100,000 and over | 0 (0.0%) | 0 (0.0%) |
Public vs Private Health Insurance Coverage by Age in Trinity Center
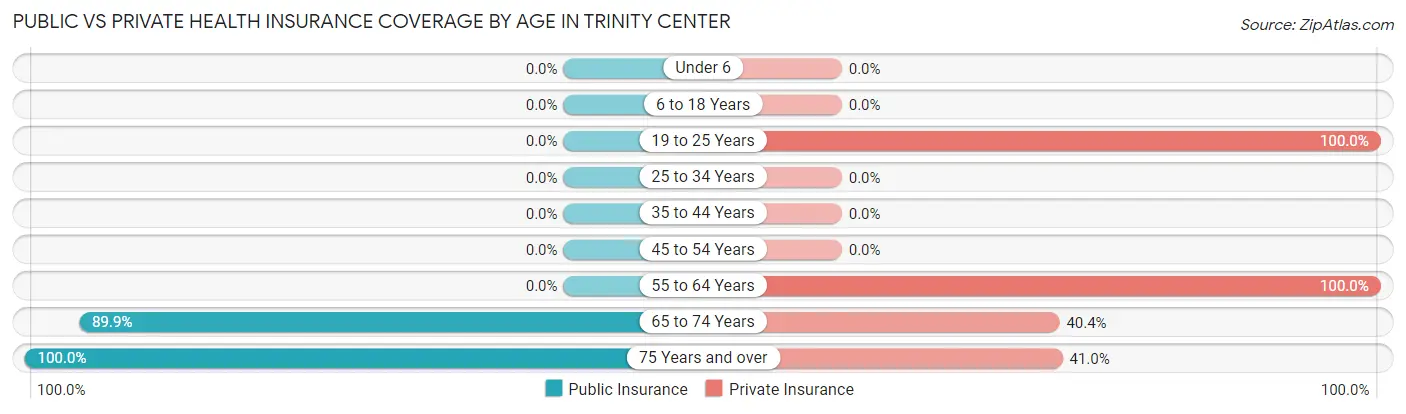
| Age Bracket | Public Insurance | Private Insurance |
| Under 6 | 0 (0.0%) | 0 (0.0%) |
| 6 to 18 Years | 0 (0.0%) | 0 (0.0%) |
| 19 to 25 Years | 0 (0.0%) | 2 (100.0%) |
| 25 to 34 Years | 0 (0.0%) | 0 (0.0%) |
| 35 to 44 Years | 0 (0.0%) | 0 (0.0%) |
| 45 to 54 Years | 0 (0.0%) | 0 (0.0%) |
| 55 to 64 Years | 0 (0.0%) | 22 (100.0%) |
| 65 to 74 Years | 89 (89.9%) | 40 (40.4%) |
| 75 Years and over | 122 (100.0%) | 50 (41.0%) |
| Total | 211 (84.4%) | 114 (45.6%) |
Disability Status by Sex by Age in Trinity Center
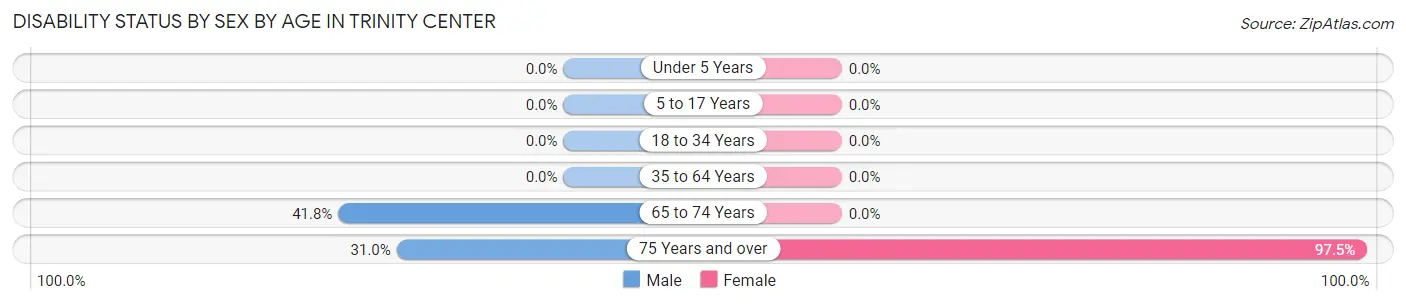
| Age Bracket | Male | Female |
| Under 5 Years | 0 (0.0%) | 0 (0.0%) |
| 5 to 17 Years | 0 (0.0%) | 0 (0.0%) |
| 18 to 34 Years | 0 (0.0%) | 0 (0.0%) |
| 35 to 64 Years | 0 (0.0%) | 0 (0.0%) |
| 65 to 74 Years | 28 (41.8%) | 0 (0.0%) |
| 75 Years and over | 13 (30.9%) | 78 (97.5%) |
Disability Class by Sex by Age in Trinity Center
Disability Class: Hearing Difficulty
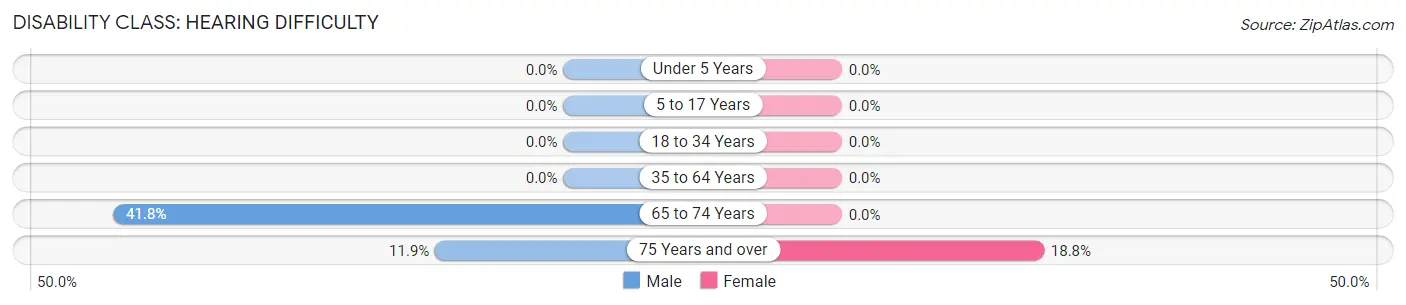
| Age Bracket | Male | Female |
| Under 5 Years | 0 (0.0%) | 0 (0.0%) |
| 5 to 17 Years | 0 (0.0%) | 0 (0.0%) |
| 18 to 34 Years | 0 (0.0%) | 0 (0.0%) |
| 35 to 64 Years | 0 (0.0%) | 0 (0.0%) |
| 65 to 74 Years | 28 (41.8%) | 0 (0.0%) |
| 75 Years and over | 5 (11.9%) | 15 (18.8%) |
Disability Class: Vision Difficulty
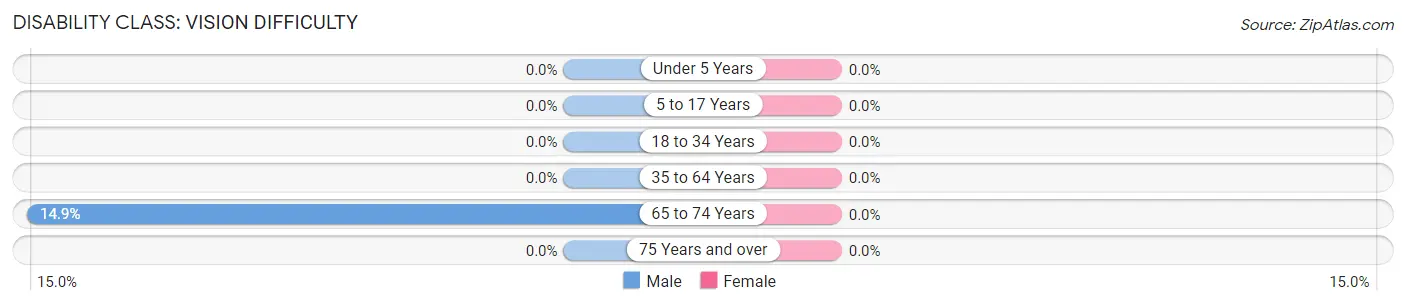
| Age Bracket | Male | Female |
| Under 5 Years | 0 (0.0%) | 0 (0.0%) |
| 5 to 17 Years | 0 (0.0%) | 0 (0.0%) |
| 18 to 34 Years | 0 (0.0%) | 0 (0.0%) |
| 35 to 64 Years | 0 (0.0%) | 0 (0.0%) |
| 65 to 74 Years | 10 (14.9%) | 0 (0.0%) |
| 75 Years and over | 0 (0.0%) | 0 (0.0%) |
Disability Class: Cognitive Difficulty
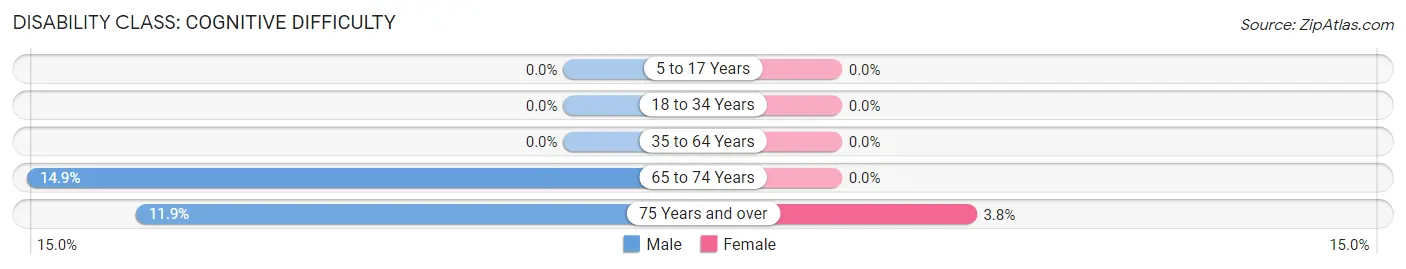
| Age Bracket | Male | Female |
| 5 to 17 Years | 0 (0.0%) | 0 (0.0%) |
| 18 to 34 Years | 0 (0.0%) | 0 (0.0%) |
| 35 to 64 Years | 0 (0.0%) | 0 (0.0%) |
| 65 to 74 Years | 10 (14.9%) | 0 (0.0%) |
| 75 Years and over | 5 (11.9%) | 3 (3.7%) |
Disability Class: Ambulatory Difficulty
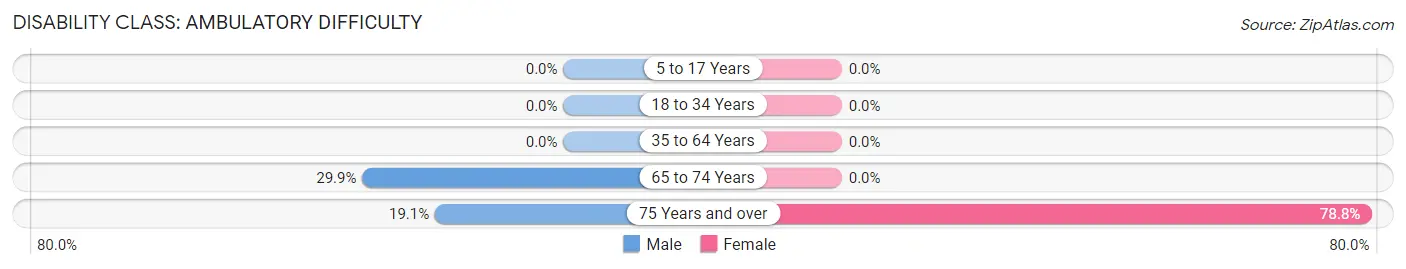
| Age Bracket | Male | Female |
| 5 to 17 Years | 0 (0.0%) | 0 (0.0%) |
| 18 to 34 Years | 0 (0.0%) | 0 (0.0%) |
| 35 to 64 Years | 0 (0.0%) | 0 (0.0%) |
| 65 to 74 Years | 20 (29.8%) | 0 (0.0%) |
| 75 Years and over | 8 (19.1%) | 63 (78.7%) |
Disability Class: Self-Care Difficulty
| Age Bracket | Male | Female |
| 5 to 17 Years | 0 (0.0%) | 0 (0.0%) |
| 18 to 34 Years | 0 (0.0%) | 0 (0.0%) |
| 35 to 64 Years | 0 (0.0%) | 0 (0.0%) |
| 65 to 74 Years | 0 (0.0%) | 0 (0.0%) |
| 75 Years and over | 0 (0.0%) | 0 (0.0%) |
Technology Access in Trinity Center
Computing Device Access in Trinity Center
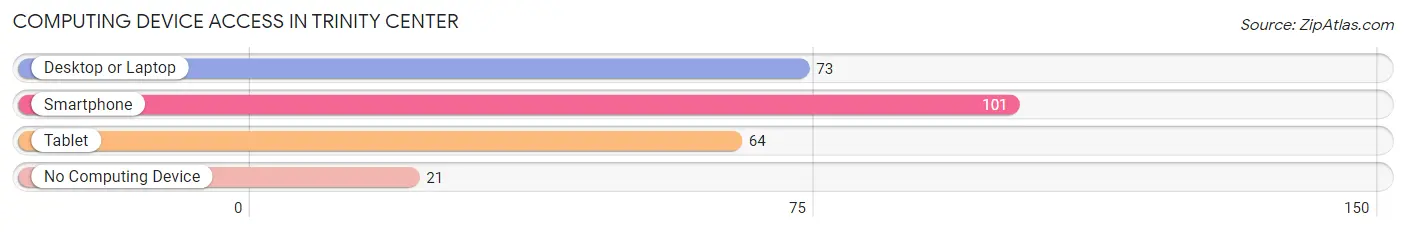
| Device Type | # Households | % Households |
| Desktop or Laptop | 73 | 54.1% |
| Smartphone | 101 | 74.8% |
| Tablet | 64 | 47.4% |
| No Computing Device | 21 | 15.6% |
| Total | 135 | 100.0% |
Internet Access in Trinity Center
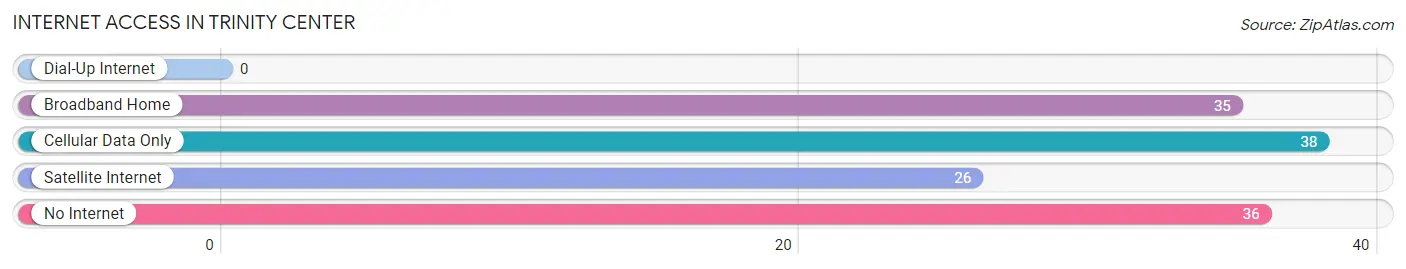
| Internet Type | # Households | % Households |
| Dial-Up Internet | 0 | 0.0% |
| Broadband Home | 35 | 25.9% |
| Cellular Data Only | 38 | 28.1% |
| Satellite Internet | 26 | 19.3% |
| No Internet | 36 | 26.7% |
| Total | 135 | 100.0% |
Trinity Center Summary
Trinity Center is a small unincorporated community located in Trinity County, California. It is situated on the Trinity River, approximately 25 miles northeast of Weaverville, the county seat. The population of Trinity Center was estimated to be around 200 in 2020.
History
Trinity Center was originally inhabited by the Wintu Native American tribe. The first non-native settlers arrived in the area in the 1850s, and the town was officially established in 1854. The town was named after the Trinity River, which runs through the area.
Trinity Center was an important stop on the stagecoach route between Weaverville and Eureka. The town was also a popular destination for gold miners during the California Gold Rush. In the late 19th century, the town was home to a number of businesses, including a hotel, saloon, general store, and blacksmith shop.
In the early 20th century, Trinity Center was a popular destination for tourists. The town was home to a number of resorts, including the Trinity Center Hotel, which was built in 1910. The hotel was destroyed by a fire in the 1950s.
Geography
Trinity Center is located in the Trinity Alps of Northern California. The town is situated on the Trinity River, which flows through the area. The town is surrounded by mountains, including the Trinity Alps, the Trinity Divide, and the Trinity National Forest.
The climate in Trinity Center is mild and temperate. The average high temperature in the summer is around 80 degrees Fahrenheit, and the average low temperature in the winter is around 40 degrees Fahrenheit.
Economy
Trinity Center is a small, rural community with a limited economy. The town is home to a few small businesses, including a general store, a gas station, and a few restaurants. The town is also home to a number of recreational activities, including fishing, camping, and hiking.
Demographics
Trinity Center is a small, rural community with a population of around 200 people. The town is predominantly white, with a small Hispanic population. The median household income in Trinity Center is around $30,000, and the median home value is around $150,000. The town has a high poverty rate, with around 25% of the population living below the poverty line.
Common Questions
What is Per Capita Income in Trinity Center?
Per Capita income in Trinity Center is $40,126.
What is the Median Family Income in Trinity Center?
Median Family Income in Trinity Center is $44,250.
What is the Median Household income in Trinity Center?
Median Household Income in Trinity Center is $36,875.
What is Inequality or Gini Index in Trinity Center?
Inequality or Gini Index in Trinity Center is 0.35.
What is the Total Population of Trinity Center?
Total Population of Trinity Center is 250.
What is the Total Male Population of Trinity Center?
Total Male Population of Trinity Center is 127.
What is the Total Female Population of Trinity Center?
Total Female Population of Trinity Center is 123.
What is the Ratio of Males per 100 Females in Trinity Center?
There are 103.25 Males per 100 Females in Trinity Center.
What is the Ratio of Females per 100 Males in Trinity Center?
There are 96.85 Females per 100 Males in Trinity Center.
What is the Median Population Age in Trinity Center?
Median Population Age in Trinity Center is 74.8 Years.
What is the Average Family Size in Trinity Center
Average Family Size in Trinity Center is 2.3 People.
What is the Average Household Size in Trinity Center
Average Household Size in Trinity Center is 1.9 People.
How Large is the Labor Force in Trinity Center?
There are 55 People in the Labor Forcein in Trinity Center.
What is the Percentage of People in the Labor Force in Trinity Center?
22.0% of People are in the Labor Force in Trinity Center.
What is the Unemployment Rate in Trinity Center?
Unemployment Rate in Trinity Center is 25.5%.