Cities with the Highest Percentage of Population Employed in Finance & Insurance in California
RELATED REPORTS & OPTIONS
Finance & Insurance
California
Compare Cities
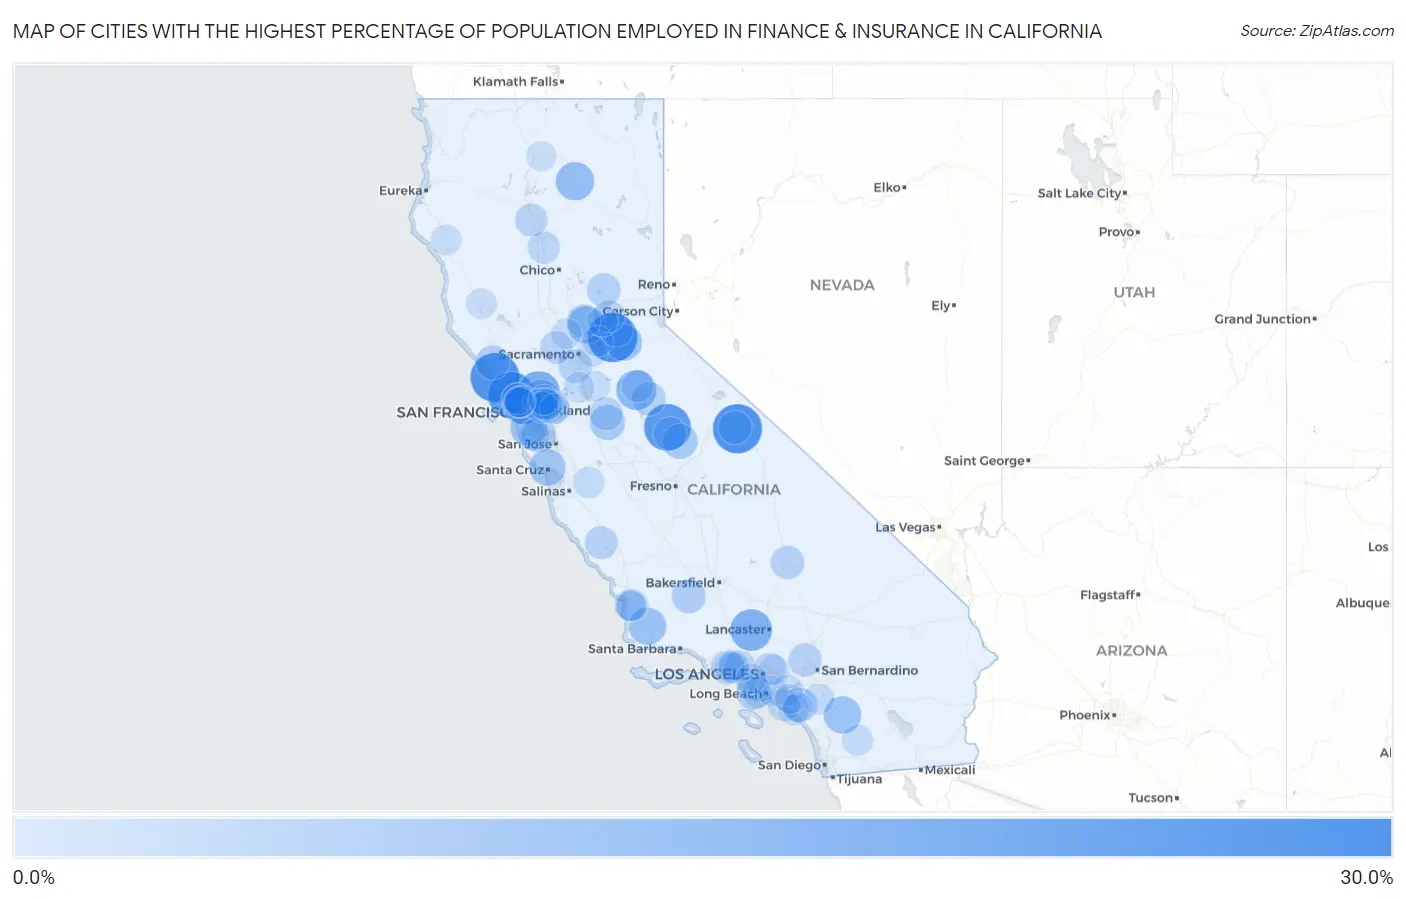
Map of Cities with the Highest Percentage of Population Employed in Finance & Insurance in California
0.0%
30.0%
Cities with the Highest Percentage of Population Employed in Finance & Insurance in California
| City | % Employed | vs State | vs National | |
| 1. | Coloma | 27.3% | 3.7%(+23.6)#1 | 4.8%(+22.5)#187 |
| 2. | Aspen Springs | 26.9% | 3.7%(+23.2)#2 | 4.8%(+22.1)#193 |
| 3. | Dillon Beach | 26.8% | 3.7%(+23.1)#3 | 4.8%(+22.0)#194 |
| 4. | Midpines | 24.6% | 3.7%(+20.9)#4 | 4.8%(+19.8)#228 |
| 5. | San Geronimo | 24.3% | 3.7%(+20.6)#5 | 4.8%(+19.6)#231 |
| 6. | Port Costa | 20.3% | 3.7%(+16.6)#6 | 4.8%(+15.5)#352 |
| 7. | Modjeska | 19.7% | 3.7%(+16.0)#7 | 4.8%(+14.9)#386 |
| 8. | Harmony Grove | 19.5% | 3.7%(+15.8)#8 | 4.8%(+14.8)#395 |
| 9. | Lake Hughes | 19.4% | 3.7%(+15.7)#9 | 4.8%(+14.7)#400 |
| 10. | Vallecito | 17.7% | 3.7%(+14.0)#10 | 4.8%(+12.9)#486 |
| 11. | Belvedere | 16.5% | 3.7%(+12.8)#11 | 4.8%(+11.8)#553 |
| 12. | Cassel | 16.3% | 3.7%(+12.6)#12 | 4.8%(+11.5)#570 |
| 13. | Tiburon | 16.0% | 3.7%(+12.3)#13 | 4.8%(+11.3)#593 |
| 14. | Whitmore | 15.9% | 3.7%(+12.2)#14 | 4.8%(+11.1)#607 |
| 15. | El Centro Naval Air Facility | 15.8% | 3.7%(+12.1)#15 | 4.8%(+11.0)#613 |
| 16. | Alhambra Valley | 15.4% | 3.7%(+11.7)#16 | 4.8%(+10.6)#653 |
| 17. | Sheridan | 15.2% | 3.7%(+11.5)#17 | 4.8%(+10.4)#672 |
| 18. | Los Alamos | 15.2% | 3.7%(+11.5)#18 | 4.8%(+10.4)#674 |
| 19. | Aguanga | 15.2% | 3.7%(+11.5)#19 | 4.8%(+10.4)#677 |
| 20. | Hillsborough | 14.6% | 3.7%(+10.9)#20 | 4.8%(+9.82)#743 |
| 21. | Paradise Park | 14.3% | 3.7%(+10.6)#21 | 4.8%(+9.52)#775 |
| 22. | Camino | 14.2% | 3.7%(+10.5)#22 | 4.8%(+9.45)#802 |
| 23. | Ahwahnee | 13.1% | 3.7%(+9.45)#23 | 4.8%(+8.38)#968 |
| 24. | Airport | 13.1% | 3.7%(+9.35)#24 | 4.8%(+8.29)#984 |
| 25. | Atherton | 12.9% | 3.7%(+9.18)#25 | 4.8%(+8.11)#1,020 |
| 26. | Palos Verdes Estates | 12.6% | 3.7%(+8.88)#26 | 4.8%(+7.81)#1,082 |
| 27. | Coto De Caza | 12.4% | 3.7%(+8.75)#27 | 4.8%(+7.68)#1,114 |
| 28. | Kentfield | 12.3% | 3.7%(+8.63)#28 | 4.8%(+7.57)#1,147 |
| 29. | San Miguel Cdp Contra Costa County | 12.1% | 3.7%(+8.38)#29 | 4.8%(+7.31)#1,210 |
| 30. | Monte Rio | 12.0% | 3.7%(+8.31)#30 | 4.8%(+7.24)#1,230 |
| 31. | Fellows | 12.0% | 3.7%(+8.30)#31 | 4.8%(+7.23)#1,236 |
| 32. | Edison | 12.0% | 3.7%(+8.28)#32 | 4.8%(+7.21)#1,242 |
| 33. | Tuolumne City | 11.8% | 3.7%(+8.09)#33 | 4.8%(+7.02)#1,289 |
| 34. | Camptonville | 11.7% | 3.7%(+7.97)#34 | 4.8%(+6.90)#1,318 |
| 35. | Lake Sherwood | 11.6% | 3.7%(+7.92)#35 | 4.8%(+6.85)#1,334 |
| 36. | Clarksburg | 11.6% | 3.7%(+7.89)#36 | 4.8%(+6.83)#1,342 |
| 37. | Inyokern | 11.6% | 3.7%(+7.87)#37 | 4.8%(+6.80)#1,347 |
| 38. | Wheatland | 11.5% | 3.7%(+7.79)#38 | 4.8%(+6.72)#1,364 |
| 39. | Diablo | 11.4% | 3.7%(+7.73)#39 | 4.8%(+6.66)#1,392 |
| 40. | Crowley Lake | 11.4% | 3.7%(+7.70)#40 | 4.8%(+6.63)#1,399 |
| 41. | Lytle Creek | 11.3% | 3.7%(+7.61)#41 | 4.8%(+6.54)#1,430 |
| 42. | Del Rio | 11.1% | 3.7%(+7.41)#42 | 4.8%(+6.34)#1,486 |
| 43. | Bootjack | 11.0% | 3.7%(+7.35)#43 | 4.8%(+6.28)#1,515 |
| 44. | Lockwood | 11.0% | 3.7%(+7.34)#44 | 4.8%(+6.27)#1,519 |
| 45. | Georgetown | 11.0% | 3.7%(+7.33)#45 | 4.8%(+6.26)#1,522 |
| 46. | Green Valley Cdp Solano County | 10.8% | 3.7%(+7.12)#46 | 4.8%(+6.05)#1,592 |
| 47. | Monument Hills | 10.8% | 3.7%(+7.07)#47 | 4.8%(+6.00)#1,614 |
| 48. | Cottonwood | 10.8% | 3.7%(+7.07)#48 | 4.8%(+6.00)#1,615 |
| 49. | Alamo | 10.6% | 3.7%(+6.93)#49 | 4.8%(+5.86)#1,660 |
| 50. | Rancho Mission Viejo | 10.6% | 3.7%(+6.89)#50 | 4.8%(+5.82)#1,670 |
| 51. | Los Molinos | 10.4% | 3.7%(+6.69)#51 | 4.8%(+5.62)#1,737 |
| 52. | Newport Beach | 10.2% | 3.7%(+6.55)#52 | 4.8%(+5.48)#1,798 |
| 53. | San Marino | 10.2% | 3.7%(+6.55)#53 | 4.8%(+5.48)#1,800 |
| 54. | Silverado | 10.1% | 3.7%(+6.41)#54 | 4.8%(+5.34)#1,863 |
| 55. | Colfax | 10.1% | 3.7%(+6.40)#55 | 4.8%(+5.34)#1,864 |
| 56. | Orinda | 10.0% | 3.7%(+6.29)#56 | 4.8%(+5.23)#1,926 |
| 57. | Blacklake | 9.9% | 3.7%(+6.23)#57 | 4.8%(+5.16)#1,945 |
| 58. | Murphys | 9.9% | 3.7%(+6.18)#58 | 4.8%(+5.11)#1,970 |
| 59. | Callender | 9.8% | 3.7%(+6.07)#59 | 4.8%(+5.00)#2,030 |
| 60. | Manhattan Beach | 9.7% | 3.7%(+6.02)#60 | 4.8%(+4.95)#2,049 |
| 61. | Saranap | 9.7% | 3.7%(+5.97)#61 | 4.8%(+4.91)#2,076 |
| 62. | Tres Pinos | 9.6% | 3.7%(+5.89)#62 | 4.8%(+4.82)#2,121 |
| 63. | Lafayette | 9.5% | 3.7%(+5.84)#63 | 4.8%(+4.78)#2,152 |
| 64. | Walnut Creek | 9.5% | 3.7%(+5.79)#64 | 4.8%(+4.72)#2,200 |
| 65. | Castle Hill | 9.5% | 3.7%(+5.78)#65 | 4.8%(+4.71)#2,203 |
| 66. | La Canada Flintridge | 9.5% | 3.7%(+5.77)#66 | 4.8%(+4.70)#2,209 |
| 67. | Moraga | 9.4% | 3.7%(+5.74)#67 | 4.8%(+4.67)#2,230 |
| 68. | Julian | 9.4% | 3.7%(+5.73)#68 | 4.8%(+4.66)#2,237 |
| 69. | Emerald Lake Hills | 9.3% | 3.7%(+5.62)#69 | 4.8%(+4.55)#2,290 |
| 70. | Canyon Lake | 9.3% | 3.7%(+5.60)#70 | 4.8%(+4.53)#2,304 |
| 71. | Hidden Hills | 9.1% | 3.7%(+5.44)#71 | 4.8%(+4.37)#2,391 |
| 72. | Redwood Valley | 9.1% | 3.7%(+5.40)#72 | 4.8%(+4.33)#2,411 |
| 73. | Redway | 9.1% | 3.7%(+5.38)#73 | 4.8%(+4.31)#2,434 |
| 74. | Villa Park | 9.1% | 3.7%(+5.38)#74 | 4.8%(+4.31)#2,435 |
| 75. | Gold River | 9.1% | 3.7%(+5.36)#75 | 4.8%(+4.30)#2,443 |
| 76. | Victor | 9.1% | 3.7%(+5.36)#76 | 4.8%(+4.29)#2,447 |
| 77. | Westlake Village | 9.0% | 3.7%(+5.33)#77 | 4.8%(+4.26)#2,464 |
| 78. | Agoura Hills | 9.0% | 3.7%(+5.27)#78 | 4.8%(+4.20)#2,506 |
| 79. | Mill Valley | 9.0% | 3.7%(+5.25)#79 | 4.8%(+4.19)#2,518 |
| 80. | Corte Madera | 8.9% | 3.7%(+5.22)#80 | 4.8%(+4.15)#2,531 |
| 81. | Robbins | 8.9% | 3.7%(+5.20)#81 | 4.8%(+4.14)#2,550 |
| 82. | Woodlands | 8.9% | 3.7%(+5.19)#82 | 4.8%(+4.13)#2,557 |
| 83. | Terminous | 8.9% | 3.7%(+5.18)#83 | 4.8%(+4.11)#2,566 |
| 84. | Laguna Niguel | 8.9% | 3.7%(+5.17)#84 | 4.8%(+4.10)#2,570 |
| 85. | Granite Bay | 8.8% | 3.7%(+5.15)#85 | 4.8%(+4.08)#2,589 |
| 86. | Oak Park | 8.8% | 3.7%(+5.14)#86 | 4.8%(+4.07)#2,594 |
| 87. | Pinon Hills | 8.8% | 3.7%(+5.13)#87 | 4.8%(+4.06)#2,599 |
| 88. | Lake Of The Pines | 8.8% | 3.7%(+5.13)#88 | 4.8%(+4.06)#2,601 |
| 89. | Rolling Hills Estates | 8.8% | 3.7%(+5.11)#89 | 4.8%(+4.05)#2,615 |
| 90. | Woody | 8.8% | 3.7%(+5.07)#90 | 4.8%(+4.00)#2,641 |
| 91. | Ross | 8.7% | 3.7%(+5.01)#91 | 4.8%(+3.94)#2,670 |
| 92. | Rossmoor | 8.7% | 3.7%(+4.96)#92 | 4.8%(+3.90)#2,707 |
| 93. | Temple City | 8.6% | 3.7%(+4.89)#93 | 4.8%(+3.82)#2,757 |
| 94. | Marina Del Rey | 8.6% | 3.7%(+4.87)#94 | 4.8%(+3.80)#2,785 |
| 95. | Mccloud | 8.5% | 3.7%(+4.81)#95 | 4.8%(+3.74)#2,815 |
| 96. | Alto | 8.5% | 3.7%(+4.80)#96 | 4.8%(+3.74)#2,829 |
| 97. | Irvine | 8.5% | 3.7%(+4.80)#97 | 4.8%(+3.74)#2,830 |
| 98. | Blackhawk | 8.4% | 3.7%(+4.73)#98 | 4.8%(+3.66)#2,890 |
| 99. | Reliez Valley | 8.4% | 3.7%(+4.67)#99 | 4.8%(+3.60)#2,939 |
| 100. | Ladera Ranch | 8.3% | 3.7%(+4.63)#100 | 4.8%(+3.56)#2,973 |
Common Questions
What are the Top 10 Cities with the Highest Percentage of Population Employed in Finance & Insurance in California?
Top 10 Cities with the Highest Percentage of Population Employed in Finance & Insurance in California are:
#1
27.3%
#2
26.9%
#3
26.8%
#4
24.6%
#5
24.3%
#6
20.3%
#7
19.4%
#8
17.7%
#9
16.5%
#10
16.3%
What city has the Highest Percentage of Population Employed in Finance & Insurance in California?
Coloma has the Highest Percentage of Population Employed in Finance & Insurance in California with 27.3%.
What is the Percentage of Population Employed in Finance & Insurance in the State of California?
Percentage of Population Employed in Finance & Insurance in California is 3.7%.
What is the Percentage of Population Employed in Finance & Insurance in the United States?
Percentage of Population Employed in Finance & Insurance in the United States is 4.8%.