Santa Nella, CA Map & Demographics
Santa Nella Map
Santa Nella Overview
$25,125
PER CAPITA INCOME
$84,667
AVG FAMILY INCOME
$84,912
AVG HOUSEHOLD INCOME
0.30
INEQUALITY / GINI INDEX
2,055
TOTAL POPULATION
1,171
MALE POPULATION
884
FEMALE POPULATION
132.47
MALES / 100 FEMALES
75.49
FEMALES / 100 MALES
33.1
MEDIAN AGE
4.6
AVG FAMILY SIZE
3.9
AVG HOUSEHOLD SIZE
962
LABOR FORCE [ PEOPLE ]
65.6%
PERCENT IN LABOR FORCE
12.3%
UNEMPLOYMENT RATE
Santa Nella Area Codes
Income in Santa Nella
Income Overview in Santa Nella
Per Capita Income in Santa Nella is $25,125, while median incomes of families and households are $84,667 and $84,912 respectively.
| Characteristic | Number | Measure |
| Per Capita Income | 2,055 | $25,125 |
| Median Family Income | 388 | $84,667 |
| Mean Family Income | 388 | $95,290 |
| Median Household Income | 530 | $84,912 |
| Mean Household Income | 530 | $95,612 |
| Income Deficit | 388 | $0 |
| Wage / Income Gap (%) | 2,055 | 0.00% |
| Wage / Income Gap ($) | 2,055 | 100.00¢ per $1 |
| Gini / Inequality Index | 2,055 | 0.30 |
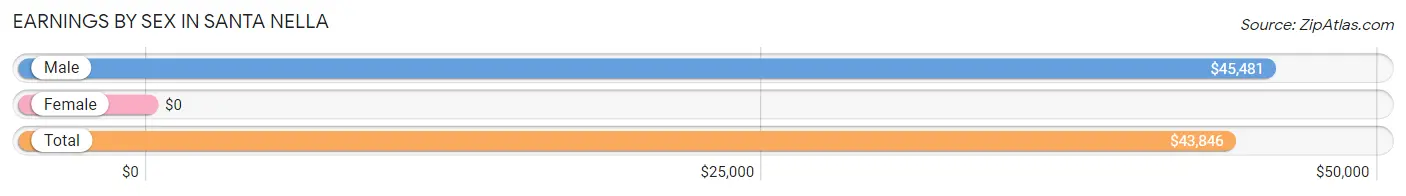
Earnings by Sex in Santa Nella
| Sex | Number | Average Earnings |
| Male | 595 (62.2%) | $45,481 |
| Female | 361 (37.8%) | $0 |
| Total | 956 (100.0%) | $43,846 |
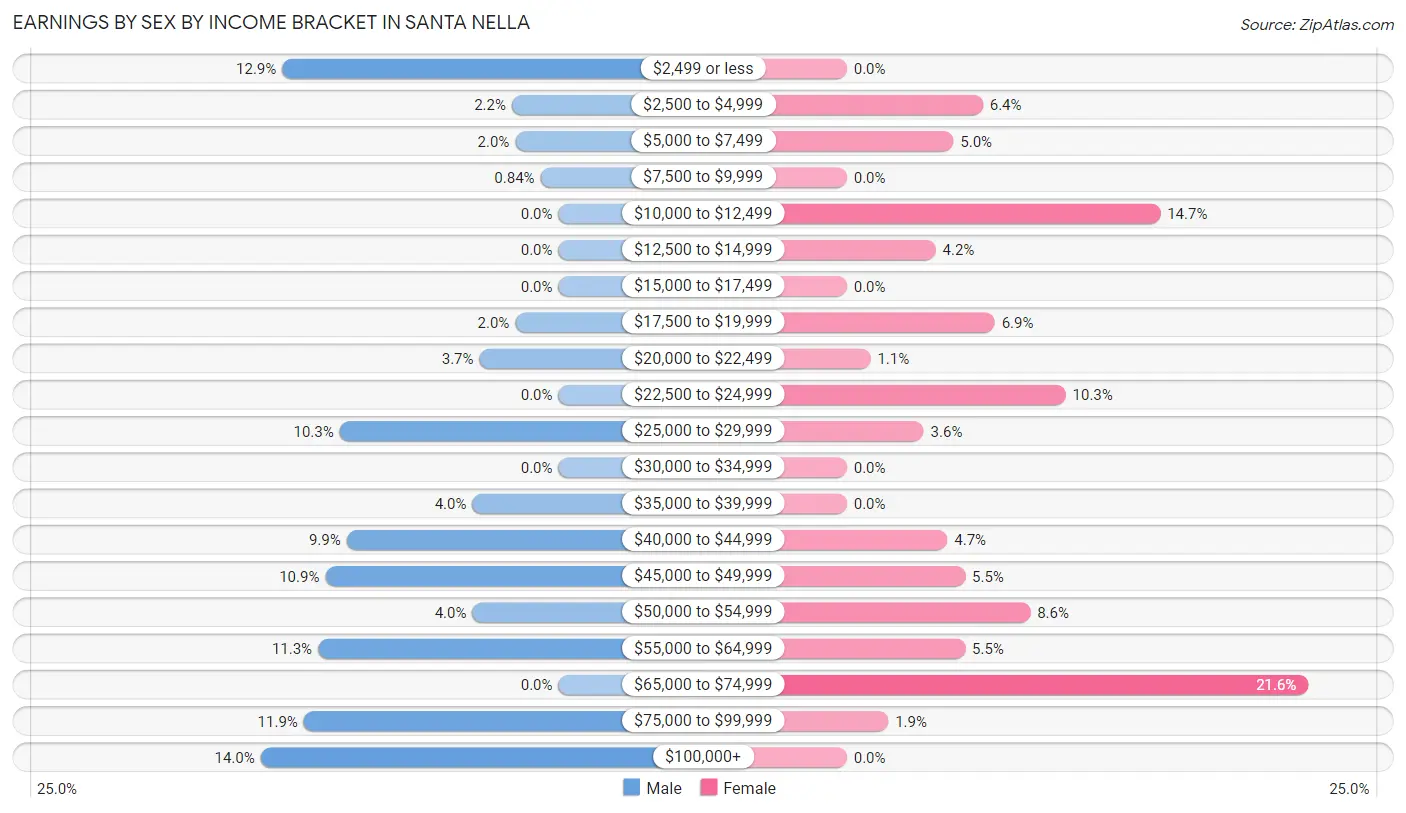
Earnings by Sex by Income Bracket in Santa Nella
The most common earnings brackets in Santa Nella are $100,000+ for men (83 | 14.0%) and $65,000 to $74,999 for women (78 | 21.6%).
| Income | Male | Female |
| $2,499 or less | 77 (12.9%) | 0 (0.0%) |
| $2,500 to $4,999 | 13 (2.2%) | 23 (6.4%) |
| $5,000 to $7,499 | 12 (2.0%) | 18 (5.0%) |
| $7,500 to $9,999 | 5 (0.8%) | 0 (0.0%) |
| $10,000 to $12,499 | 0 (0.0%) | 53 (14.7%) |
| $12,500 to $14,999 | 0 (0.0%) | 15 (4.2%) |
| $15,000 to $17,499 | 0 (0.0%) | 0 (0.0%) |
| $17,500 to $19,999 | 12 (2.0%) | 25 (6.9%) |
| $20,000 to $22,499 | 22 (3.7%) | 4 (1.1%) |
| $22,500 to $24,999 | 0 (0.0%) | 37 (10.2%) |
| $25,000 to $29,999 | 61 (10.2%) | 13 (3.6%) |
| $30,000 to $34,999 | 0 (0.0%) | 0 (0.0%) |
| $35,000 to $39,999 | 24 (4.0%) | 0 (0.0%) |
| $40,000 to $44,999 | 59 (9.9%) | 17 (4.7%) |
| $45,000 to $49,999 | 65 (10.9%) | 20 (5.5%) |
| $50,000 to $54,999 | 24 (4.0%) | 31 (8.6%) |
| $55,000 to $64,999 | 67 (11.3%) | 20 (5.5%) |
| $65,000 to $74,999 | 0 (0.0%) | 78 (21.6%) |
| $75,000 to $99,999 | 71 (11.9%) | 7 (1.9%) |
| $100,000+ | 83 (14.0%) | 0 (0.0%) |
| Total | 595 (100.0%) | 361 (100.0%) |
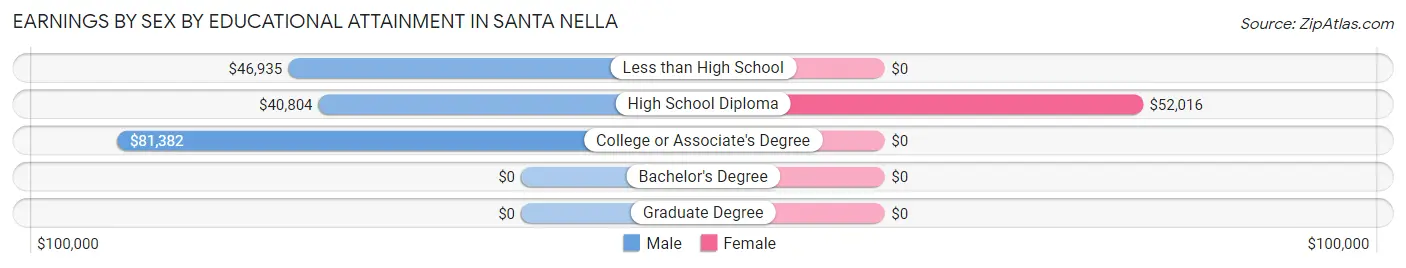
Earnings by Sex by Educational Attainment in Santa Nella
Average earnings in Santa Nella are $46,692 for men and $40,662 for women, a difference of 12.9%. Men with an educational attainment of college or associate's degree enjoy the highest average annual earnings of $81,382, while those with high school diploma education earn the least with $40,804. Women with an educational attainment of high school diploma earn the most with the average annual earnings of $52,016, while those with high school diploma education have the smallest earnings of $52,016.
| Educational Attainment | Male Income | Female Income |
| Less than High School | $46,935 | $0 |
| High School Diploma | $40,804 | $52,016 |
| College or Associate's Degree | $81,382 | $0 |
| Bachelor's Degree | - | - |
| Graduate Degree | - | - |
| Total | $46,692 | $40,662 |
Family Income in Santa Nella
Family Income Brackets in Santa Nella
According to the Santa Nella family income data, there are 97 families falling into the $100,000 to $149,999 income range, which is the most common income bracket and makes up 25.0% of all families.
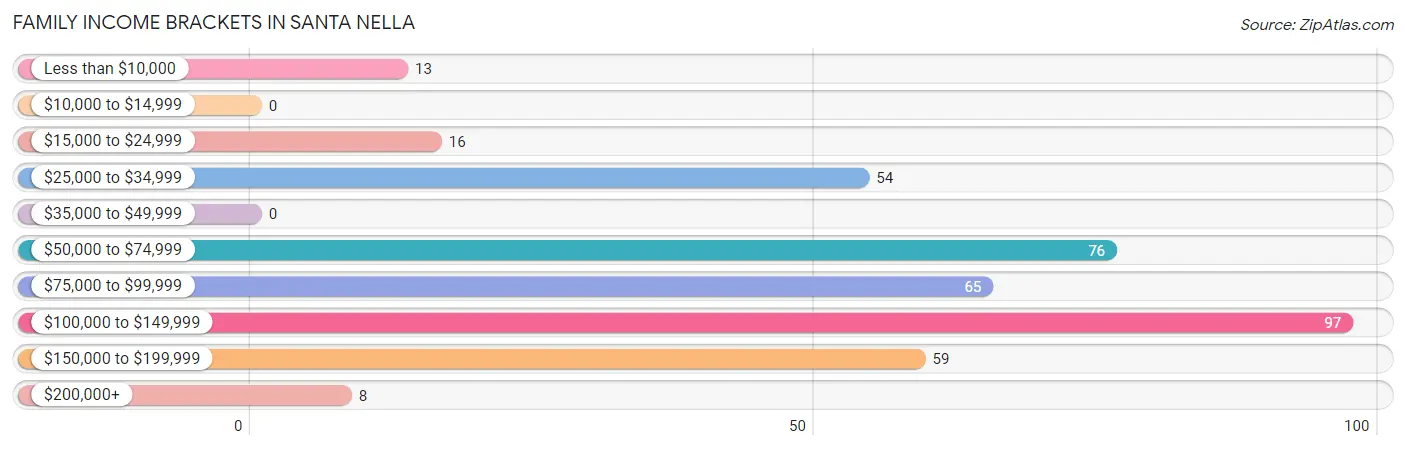
| Income Bracket | # Families | % Families |
| Less than $10,000 | 13 | 3.4% |
| $10,000 to $14,999 | 0 | 0.0% |
| $15,000 to $24,999 | 16 | 4.1% |
| $25,000 to $34,999 | 54 | 13.9% |
| $35,000 to $49,999 | 0 | 0.0% |
| $50,000 to $74,999 | 76 | 19.6% |
| $75,000 to $99,999 | 65 | 16.8% |
| $100,000 to $149,999 | 97 | 25.0% |
| $150,000 to $199,999 | 59 | 15.2% |
| $200,000+ | 8 | 2.1% |
Family Income by Famaliy Size in Santa Nella
5-person families (78 | 20.1%) account for the highest median family income in Santa Nella with $151,447 per family, while 5-person families (78 | 20.1%) have the highest median income of $30,289 per family member.
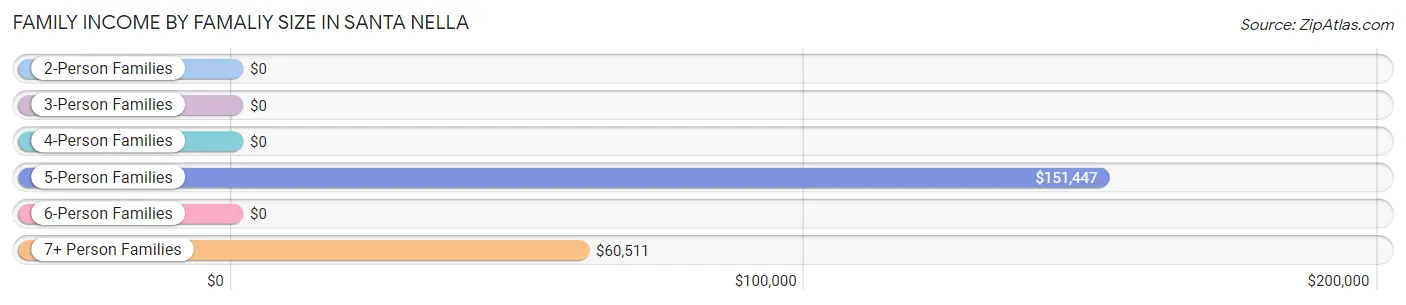
| Income Bracket | # Families | Median Income |
| 2-Person Families | 73 (18.8%) | $0 |
| 3-Person Families | 123 (31.7%) | $0 |
| 4-Person Families | 18 (4.6%) | $0 |
| 5-Person Families | 78 (20.1%) | $151,447 |
| 6-Person Families | 13 (3.4%) | $0 |
| 7+ Person Families | 83 (21.4%) | $60,511 |
| Total | 388 (100.0%) | $84,667 |
Family Income by Number of Earners in Santa Nella
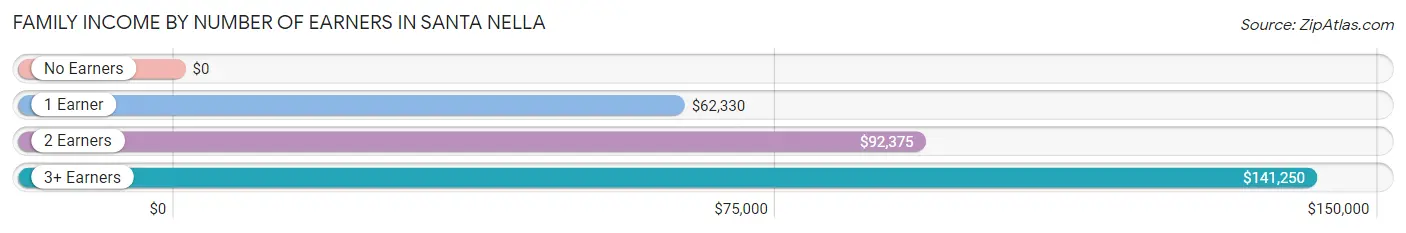
| Number of Earners | # Families | Median Income |
| No Earners | 30 (7.7%) | $0 |
| 1 Earner | 143 (36.9%) | $62,330 |
| 2 Earners | 139 (35.8%) | $92,375 |
| 3+ Earners | 76 (19.6%) | $141,250 |
| Total | 388 (100.0%) | $84,667 |
Household Income in Santa Nella
Household Income Brackets in Santa Nella
With 138 households falling in the category, the $75,000 to $99,999 income range is the most frequent in Santa Nella, accounting for 26.0% of all households.
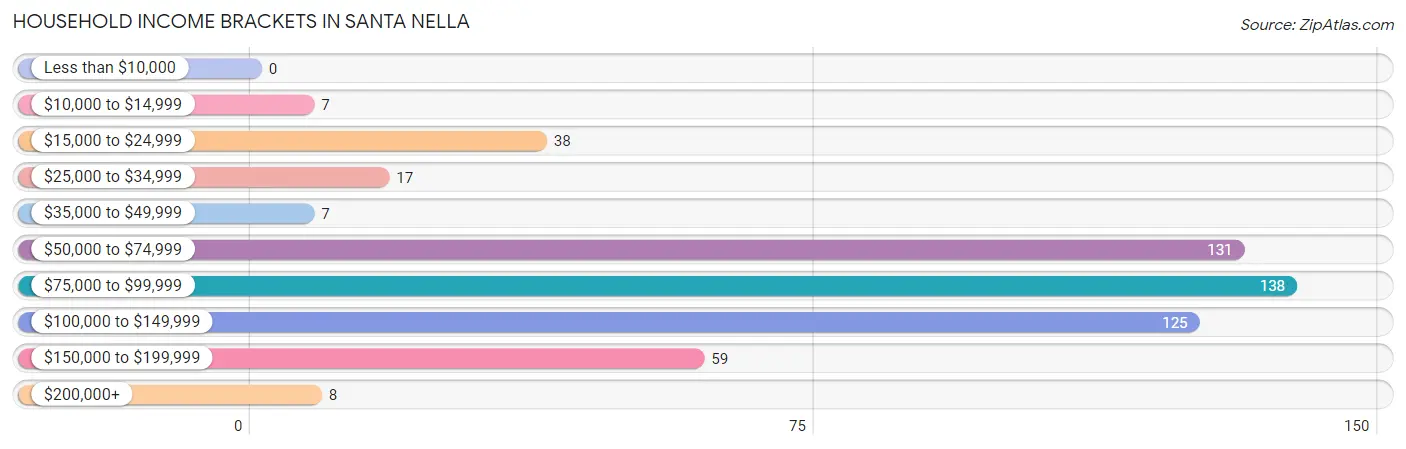
| Income Bracket | # Households | % Households |
| Less than $10,000 | 0 | 0.0% |
| $10,000 to $14,999 | 7 | 1.3% |
| $15,000 to $24,999 | 38 | 7.2% |
| $25,000 to $34,999 | 17 | 3.2% |
| $35,000 to $49,999 | 7 | 1.3% |
| $50,000 to $74,999 | 131 | 24.7% |
| $75,000 to $99,999 | 138 | 26.0% |
| $100,000 to $149,999 | 125 | 23.6% |
| $150,000 to $199,999 | 59 | 11.1% |
| $200,000+ | 8 | 1.5% |
Household Income by Householder Age in Santa Nella
The median household income in Santa Nella is $84,912, with the highest median household income of $93,721 found in the 25 to 44 years age bracket for the primary householder. A total of 276 households (52.1%) fall into this category.
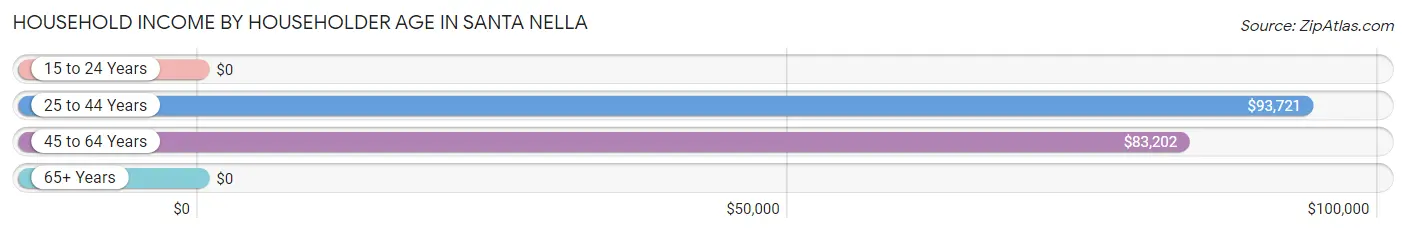
| Income Bracket | # Households | Median Income |
| 15 to 24 Years | 0 (0.0%) | $0 |
| 25 to 44 Years | 276 (52.1%) | $93,721 |
| 45 to 64 Years | 212 (40.0%) | $83,202 |
| 65+ Years | 42 (7.9%) | $0 |
| Total | 530 (100.0%) | $84,912 |
Poverty in Santa Nella
Income Below Poverty by Sex and Age in Santa Nella
With 2.4% poverty level for males and 10.0% for females among the residents of Santa Nella, 18 to 24 year old males and 65 to 74 year old females are the most vulnerable to poverty, with 13 males (20.0%) and 21 females (40.4%) in their respective age groups living below the poverty level.
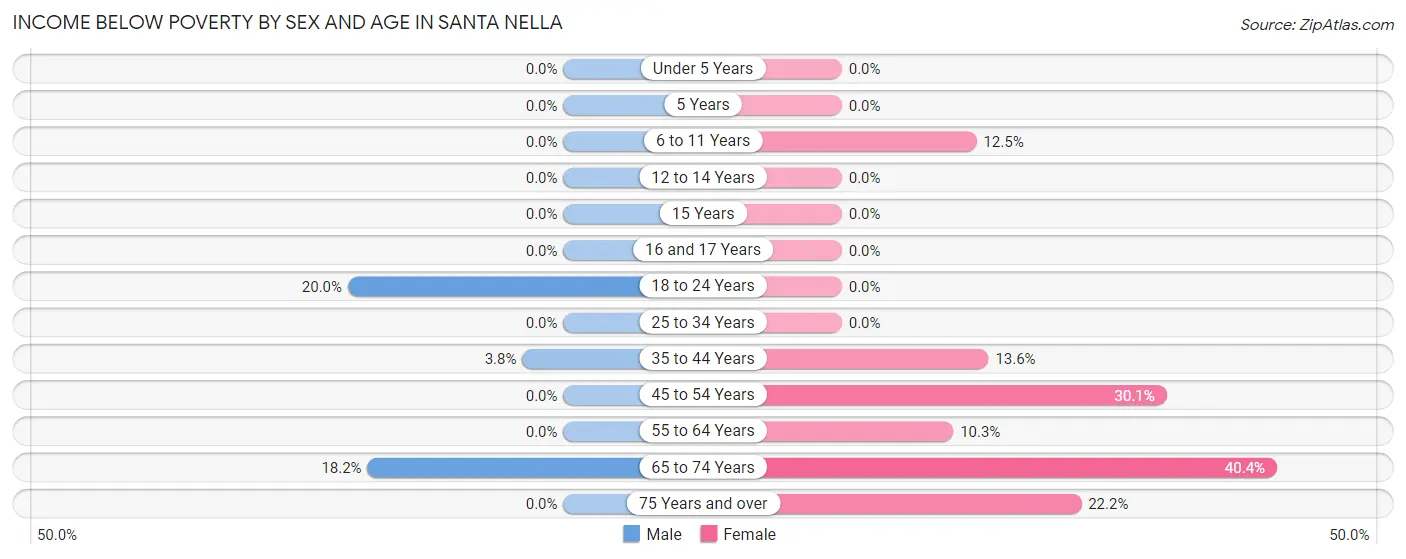
| Age Bracket | Male | Female |
| Under 5 Years | 0 (0.0%) | 0 (0.0%) |
| 5 Years | 0 (0.0%) | 0 (0.0%) |
| 6 to 11 Years | 0 (0.0%) | 10 (12.5%) |
| 12 to 14 Years | 0 (0.0%) | 0 (0.0%) |
| 15 Years | 0 (0.0%) | 0 (0.0%) |
| 16 and 17 Years | 0 (0.0%) | 0 (0.0%) |
| 18 to 24 Years | 13 (20.0%) | 0 (0.0%) |
| 25 to 34 Years | 0 (0.0%) | 0 (0.0%) |
| 35 to 44 Years | 9 (3.8%) | 23 (13.6%) |
| 45 to 54 Years | 0 (0.0%) | 22 (30.1%) |
| 55 to 64 Years | 0 (0.0%) | 6 (10.3%) |
| 65 to 74 Years | 6 (18.2%) | 21 (40.4%) |
| 75 Years and over | 0 (0.0%) | 6 (22.2%) |
| Total | 28 (2.4%) | 88 (10.0%) |
Income Above Poverty by Sex and Age in Santa Nella
According to the poverty statistics in Santa Nella, males aged under 5 years and females aged under 5 years are the age groups that are most secure financially, with 100.0% of males and 100.0% of females in these age groups living above the poverty line.
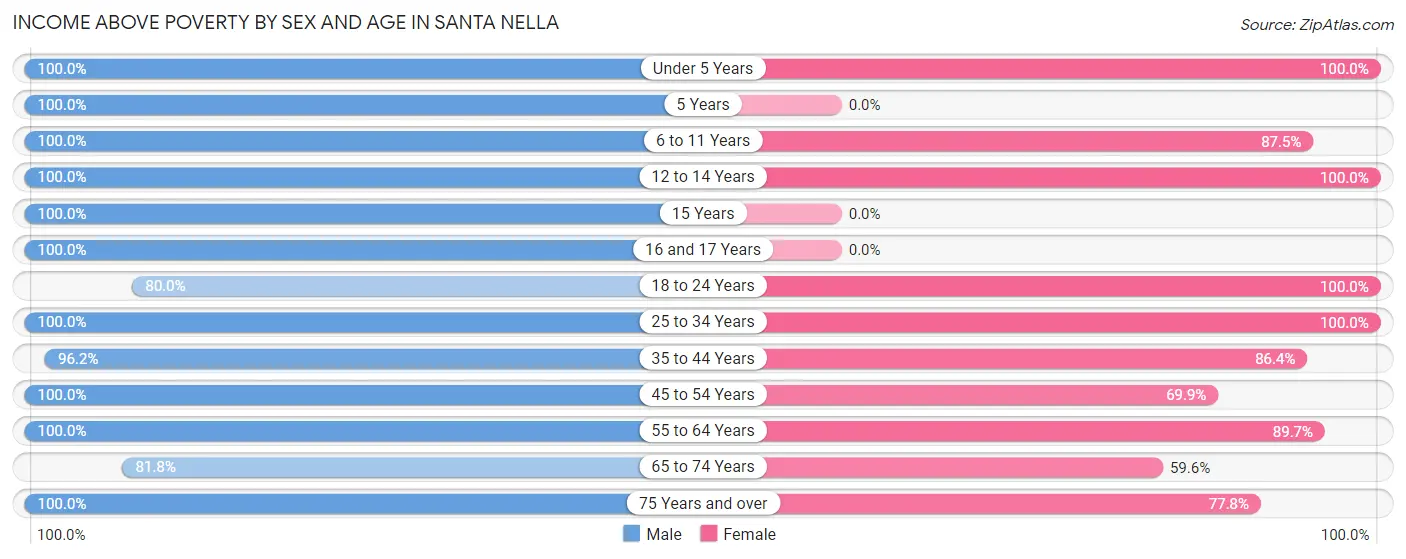
| Age Bracket | Male | Female |
| Under 5 Years | 99 (100.0%) | 85 (100.0%) |
| 5 Years | 31 (100.0%) | 0 (0.0%) |
| 6 to 11 Years | 117 (100.0%) | 70 (87.5%) |
| 12 to 14 Years | 49 (100.0%) | 71 (100.0%) |
| 15 Years | 57 (100.0%) | 0 (0.0%) |
| 16 and 17 Years | 67 (100.0%) | 0 (0.0%) |
| 18 to 24 Years | 52 (80.0%) | 79 (100.0%) |
| 25 to 34 Years | 141 (100.0%) | 190 (100.0%) |
| 35 to 44 Years | 227 (96.2%) | 146 (86.4%) |
| 45 to 54 Years | 131 (100.0%) | 51 (69.9%) |
| 55 to 64 Years | 134 (100.0%) | 52 (89.7%) |
| 65 to 74 Years | 27 (81.8%) | 31 (59.6%) |
| 75 Years and over | 11 (100.0%) | 21 (77.8%) |
| Total | 1,143 (97.6%) | 796 (90.0%) |
Income Below Poverty Among Married-Couple Families in Santa Nella
The poverty statistics for married-couple families in Santa Nella show that 1.9% or 6 of the total 313 families live below the poverty line. Families with no children have the highest poverty rate of 5.0%, comprising of 6 families. On the other hand, families with 1 or 2 children have the lowest poverty rate of 0.0%, which includes 0 families.
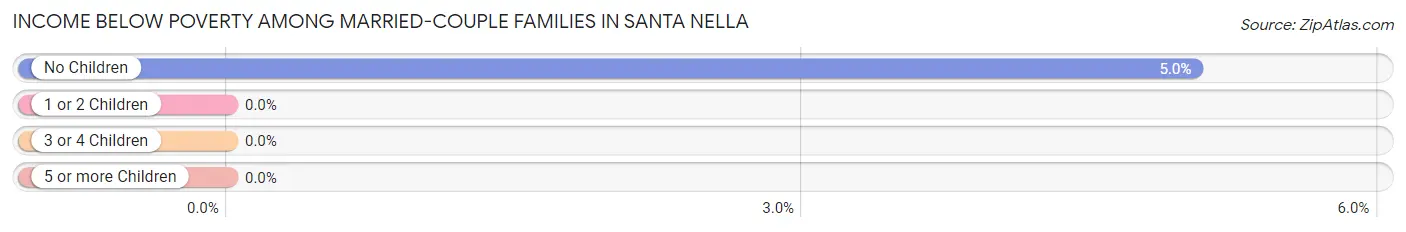
| Children | Above Poverty | Below Poverty |
| No Children | 113 (95.0%) | 6 (5.0%) |
| 1 or 2 Children | 65 (100.0%) | 0 (0.0%) |
| 3 or 4 Children | 92 (100.0%) | 0 (0.0%) |
| 5 or more Children | 37 (100.0%) | 0 (0.0%) |
| Total | 307 (98.1%) | 6 (1.9%) |
Income Below Poverty Among Single-Parent Households in Santa Nella
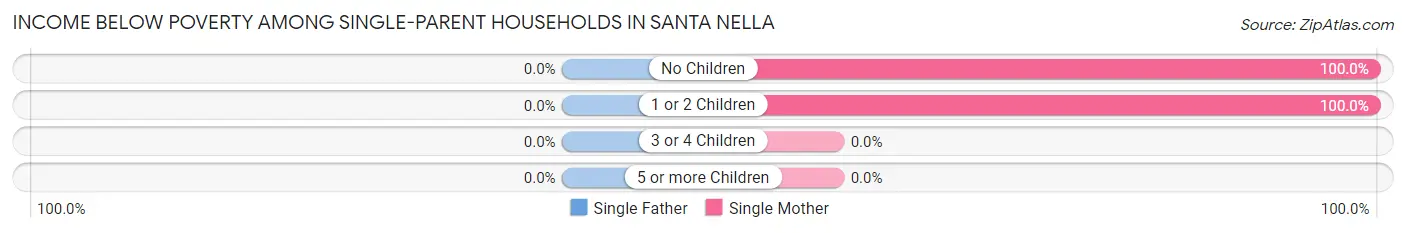
| Children | Single Father | Single Mother |
| No Children | 0 (0.0%) | 6 (100.0%) |
| 1 or 2 Children | 0 (0.0%) | 7 (100.0%) |
| 3 or 4 Children | 0 (0.0%) | 0 (0.0%) |
| 5 or more Children | 0 (0.0%) | 0 (0.0%) |
| Total | 0 (0.0%) | 13 (100.0%) |
Income Below Poverty Among Married-Couple vs Single-Parent Households in Santa Nella
The poverty data for Santa Nella shows that 6 of the married-couple family households (1.9%) and 13 of the single-parent households (17.3%) are living below the poverty level. Within the married-couple family households, those with no children have the highest poverty rate, with 6 households (5.0%) falling below the poverty line. Among the single-parent households, those with 1 or 2 children have the highest poverty rate, with 7 household (26.9%) living below poverty.
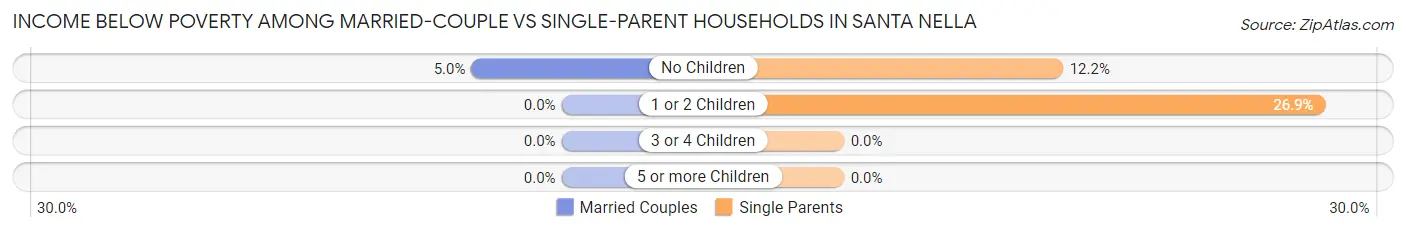
| Children | Married-Couple Families | Single-Parent Households |
| No Children | 6 (5.0%) | 6 (12.2%) |
| 1 or 2 Children | 0 (0.0%) | 7 (26.9%) |
| 3 or 4 Children | 0 (0.0%) | 0 (0.0%) |
| 5 or more Children | 0 (0.0%) | 0 (0.0%) |
| Total | 6 (1.9%) | 13 (17.3%) |
Race in Santa Nella
The most populous races in Santa Nella are Hispanic or Latino (1,644 | 80.0%), Some other Race (915 | 44.5%), and White / Caucasian (776 | 37.8%).
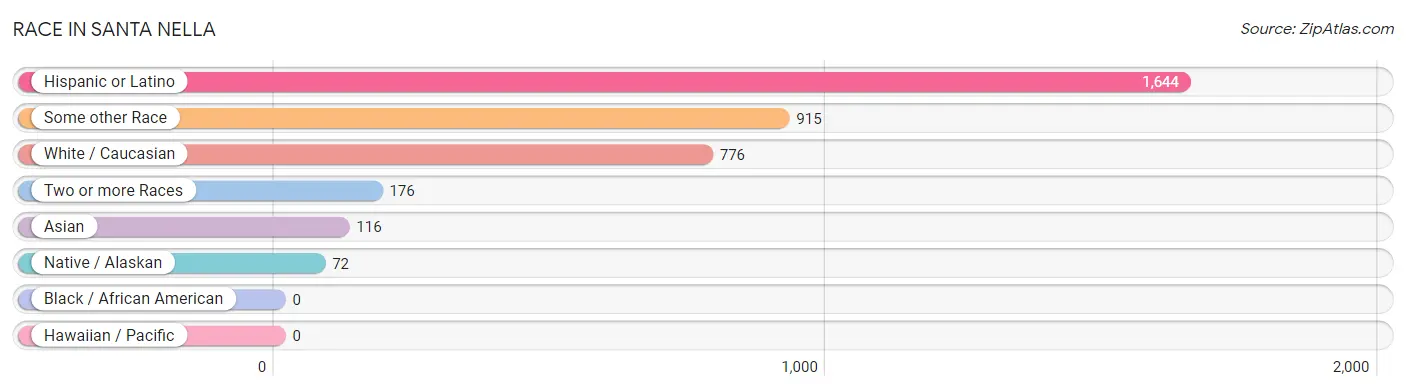
| Race | # Population | % Population |
| Asian | 116 | 5.6% |
| Black / African American | 0 | 0.0% |
| Hawaiian / Pacific | 0 | 0.0% |
| Hispanic or Latino | 1,644 | 80.0% |
| Native / Alaskan | 72 | 3.5% |
| White / Caucasian | 776 | 37.8% |
| Two or more Races | 176 | 8.6% |
| Some other Race | 915 | 44.5% |
| Total | 2,055 | 100.0% |
Ancestry in Santa Nella
The most populous ancestries reported in Santa Nella are Mexican (1,537 | 74.8%), Indian (Asian) (74 | 3.6%), Central American (68 | 3.3%), Honduran (68 | 3.3%), and Korean (56 | 2.7%), together accounting for 87.7% of all Santa Nella residents.
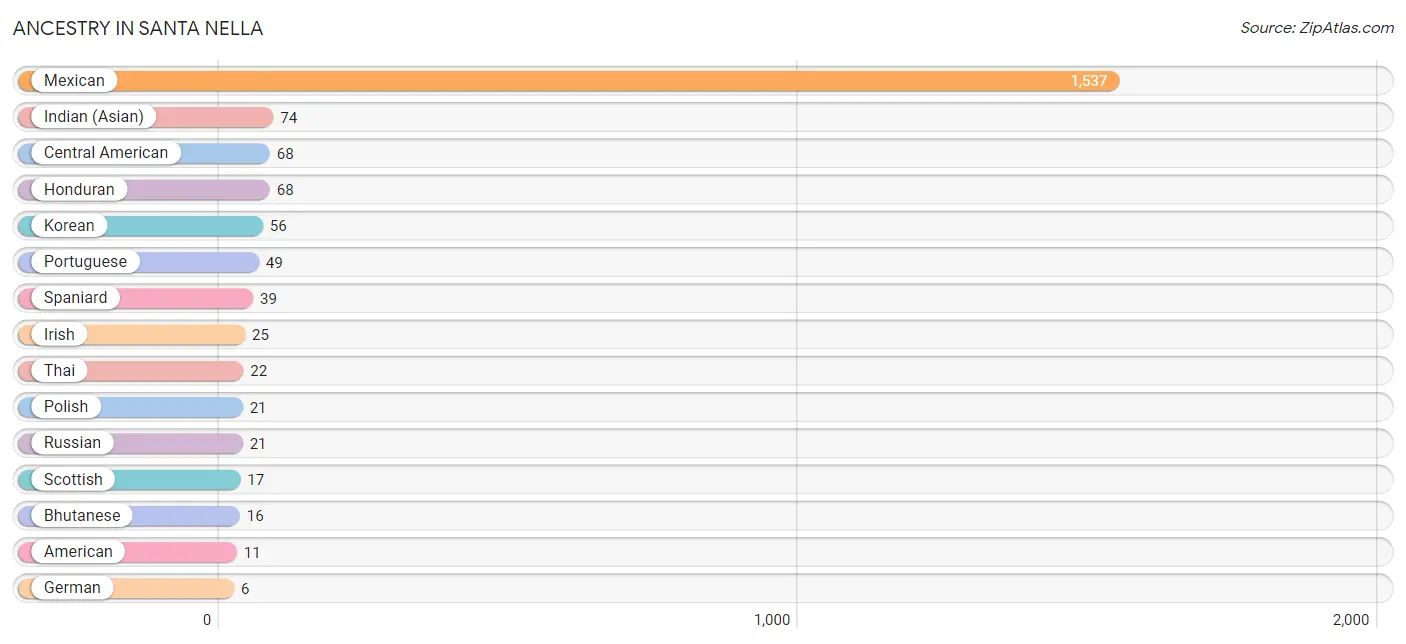
| Ancestry | # Population | % Population |
| American | 11 | 0.5% |
| Bhutanese | 16 | 0.8% |
| Central American | 68 | 3.3% |
| German | 6 | 0.3% |
| Honduran | 68 | 3.3% |
| Indian (Asian) | 74 | 3.6% |
| Irish | 25 | 1.2% |
| Korean | 56 | 2.7% |
| Mexican | 1,537 | 74.8% |
| Polish | 21 | 1.0% |
| Portuguese | 49 | 2.4% |
| Russian | 21 | 1.0% |
| Scottish | 17 | 0.8% |
| Spaniard | 39 | 1.9% |
| Thai | 22 | 1.1% | View All 15 Rows |
Immigrants in Santa Nella
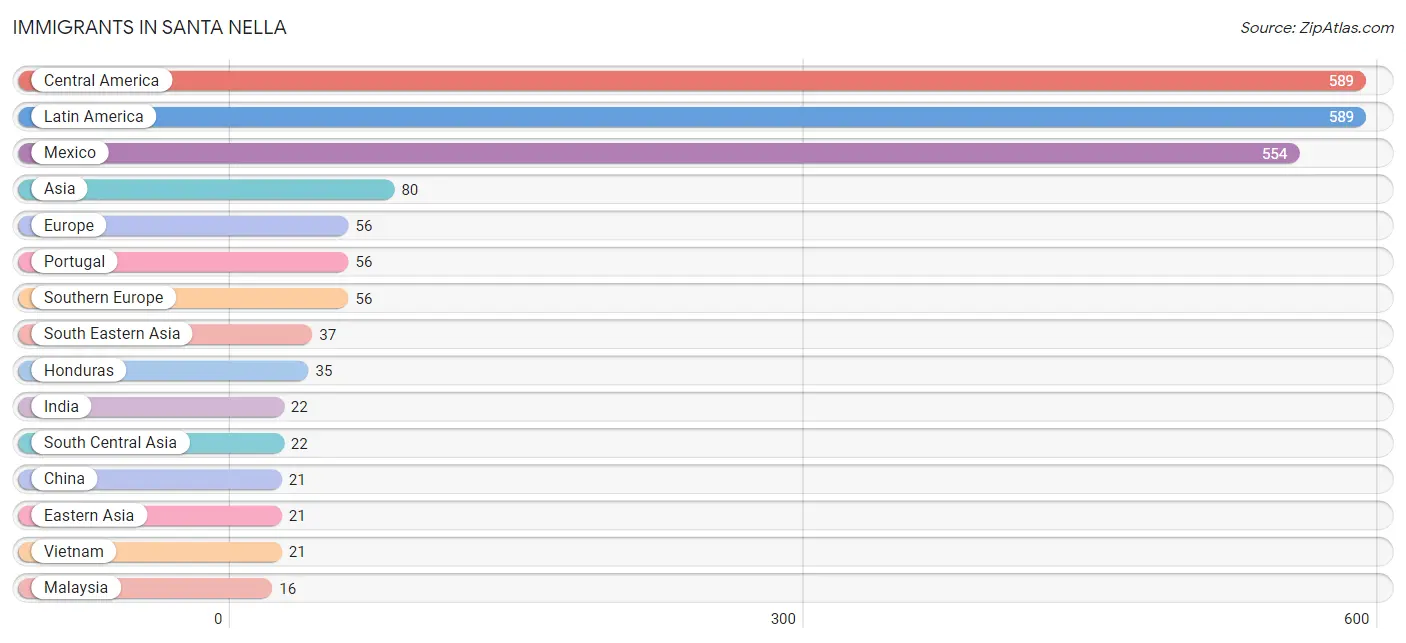
The most numerous immigrant groups reported in Santa Nella came from Central America (589 | 28.7%), Latin America (589 | 28.7%), Mexico (554 | 27.0%), Asia (80 | 3.9%), and Europe (56 | 2.7%), together accounting for 90.9% of all Santa Nella residents.
| Immigration Origin | # Population | % Population |
| Asia | 80 | 3.9% |
| Azores | 7 | 0.3% |
| Central America | 589 | 28.7% |
| China | 21 | 1.0% |
| Eastern Asia | 21 | 1.0% |
| Europe | 56 | 2.7% |
| Honduras | 35 | 1.7% |
| India | 22 | 1.1% |
| Latin America | 589 | 28.7% |
| Malaysia | 16 | 0.8% |
| Mexico | 554 | 27.0% |
| Portugal | 56 | 2.7% |
| South Central Asia | 22 | 1.1% |
| South Eastern Asia | 37 | 1.8% |
| Southern Europe | 56 | 2.7% |
| Vietnam | 21 | 1.0% | View All 16 Rows |
Sex and Age in Santa Nella
Sex and Age in Santa Nella
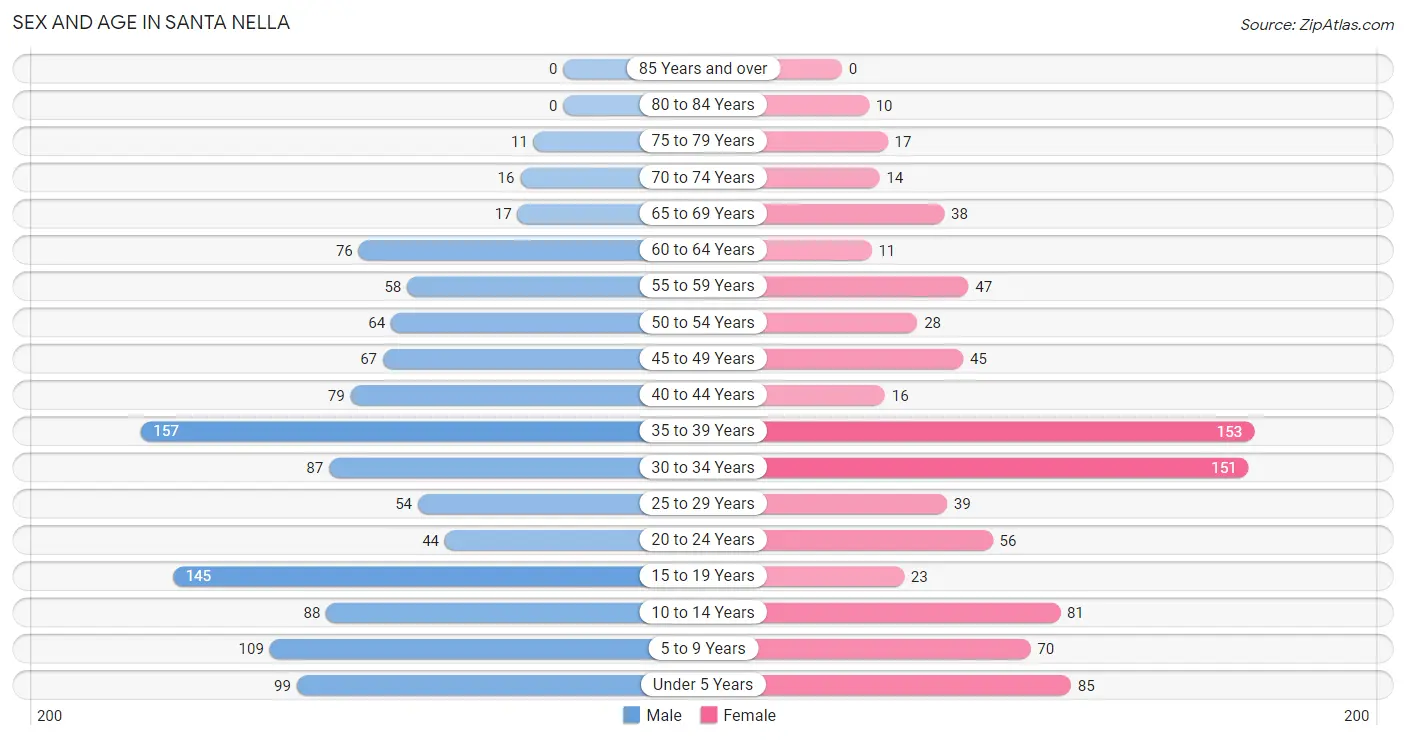
The most populous age groups in Santa Nella are 35 to 39 Years (157 | 13.4%) for men and 35 to 39 Years (153 | 17.3%) for women.
| Age Bracket | Male | Female |
| Under 5 Years | 99 (8.5%) | 85 (9.6%) |
| 5 to 9 Years | 109 (9.3%) | 70 (7.9%) |
| 10 to 14 Years | 88 (7.5%) | 81 (9.2%) |
| 15 to 19 Years | 145 (12.4%) | 23 (2.6%) |
| 20 to 24 Years | 44 (3.8%) | 56 (6.3%) |
| 25 to 29 Years | 54 (4.6%) | 39 (4.4%) |
| 30 to 34 Years | 87 (7.4%) | 151 (17.1%) |
| 35 to 39 Years | 157 (13.4%) | 153 (17.3%) |
| 40 to 44 Years | 79 (6.8%) | 16 (1.8%) |
| 45 to 49 Years | 67 (5.7%) | 45 (5.1%) |
| 50 to 54 Years | 64 (5.5%) | 28 (3.2%) |
| 55 to 59 Years | 58 (5.0%) | 47 (5.3%) |
| 60 to 64 Years | 76 (6.5%) | 11 (1.2%) |
| 65 to 69 Years | 17 (1.5%) | 38 (4.3%) |
| 70 to 74 Years | 16 (1.4%) | 14 (1.6%) |
| 75 to 79 Years | 11 (0.9%) | 17 (1.9%) |
| 80 to 84 Years | 0 (0.0%) | 10 (1.1%) |
| 85 Years and over | 0 (0.0%) | 0 (0.0%) |
| Total | 1,171 (100.0%) | 884 (100.0%) |
Families and Households in Santa Nella
Median Family Size in Santa Nella
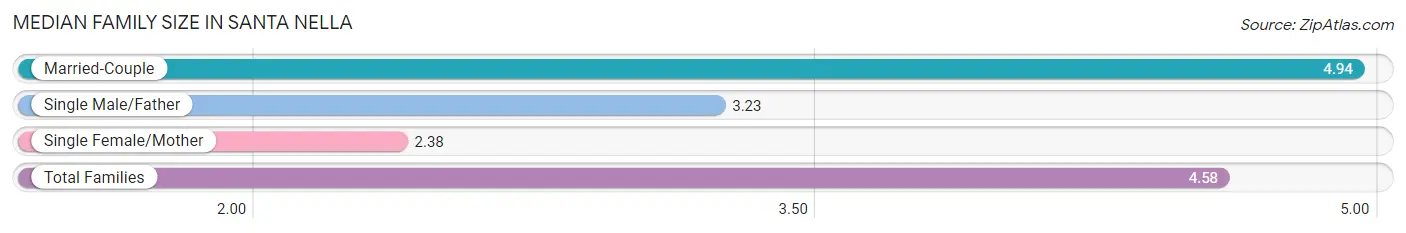
The median family size in Santa Nella is 4.58 persons per family, with married-couple families (313 | 80.7%) accounting for the largest median family size of 4.94 persons per family. On the other hand, single female/mother families (13 | 3.4%) represent the smallest median family size with 2.38 persons per family.
| Family Type | # Families | Family Size |
| Married-Couple | 313 (80.7%) | 4.94 |
| Single Male/Father | 62 (16.0%) | 3.23 |
| Single Female/Mother | 13 (3.4%) | 2.38 |
| Total Families | 388 (100.0%) | 4.58 |
Median Household Size in Santa Nella
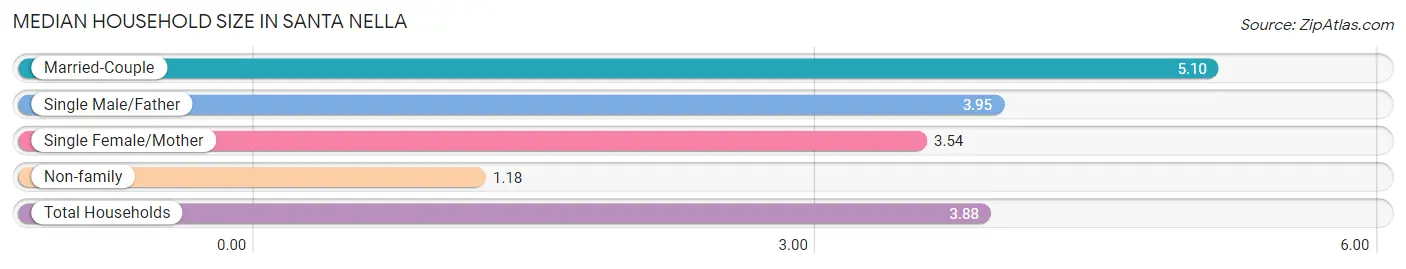
The median household size in Santa Nella is 3.88 persons per household, with married-couple households (313 | 59.1%) accounting for the largest median household size of 5.1 persons per household. non-family households (142 | 26.8%) represent the smallest median household size with 1.18 persons per household.
| Household Type | # Households | Household Size |
| Married-Couple | 313 (59.1%) | 5.10 |
| Single Male/Father | 62 (11.7%) | 3.95 |
| Single Female/Mother | 13 (2.5%) | 3.54 |
| Non-family | 142 (26.8%) | 1.18 |
| Total Households | 530 (100.0%) | 3.88 |
Household Size by Marriage Status in Santa Nella
Out of a total of 530 households in Santa Nella, 388 (73.2%) are family households, while 142 (26.8%) are nonfamily households. The most numerous type of family households are 4-person households, comprising 97, and the most common type of nonfamily households are 1-person households, comprising 121.
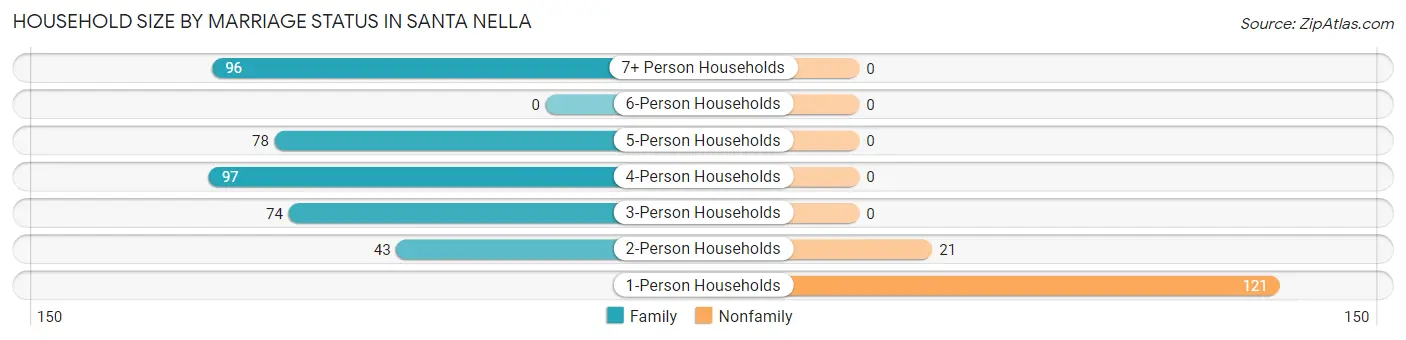
| Household Size | Family Households | Nonfamily Households |
| 1-Person Households | - | 121 (22.8%) |
| 2-Person Households | 43 (8.1%) | 21 (4.0%) |
| 3-Person Households | 74 (14.0%) | 0 (0.0%) |
| 4-Person Households | 97 (18.3%) | 0 (0.0%) |
| 5-Person Households | 78 (14.7%) | 0 (0.0%) |
| 6-Person Households | 0 (0.0%) | 0 (0.0%) |
| 7+ Person Households | 96 (18.1%) | 0 (0.0%) |
| Total | 388 (73.2%) | 142 (26.8%) |
Female Fertility in Santa Nella
Fertility by Age in Santa Nella
| Age Bracket | Women with Births | Births / 1,000 Women |
| 15 to 19 years | 0 (0.0%) | 0.0 |
| 20 to 34 years | 0 (0.0%) | 0.0 |
| 35 to 50 years | 0 (0.0%) | 0.0 |
| Total | 0 (0.0%) | 0.0 |
Fertility by Age by Marriage Status in Santa Nella
| Age Bracket | Married | Unmarried |
| 15 to 19 years | 0 (0.0%) | 0 (0.0%) |
| 20 to 34 years | 0 (0.0%) | 0 (0.0%) |
| 35 to 50 years | 0 (0.0%) | 0 (0.0%) |
| Total | 0 (0.0%) | 0 (0.0%) |
Fertility by Education in Santa Nella
| Educational Attainment | Women with Births | Births / 1,000 Women |
| Less than High School | 0 (0.0%) | 0.0 |
| High School Diploma | 0 (0.0%) | 0.0 |
| College or Associate's Degree | 0 (0.0%) | 0.0 |
| Bachelor's Degree | 0 (0.0%) | 0.0 |
| Graduate Degree | 0 (0.0%) | 0.0 |
| Total | 0 (0.0%) | 0.0 |
Fertility by Education by Marriage Status in Santa Nella
| Educational Attainment | Married | Unmarried |
| Less than High School | 0 (0.0%) | 0 (0.0%) |
| High School Diploma | 0 (0.0%) | 0 (0.0%) |
| College or Associate's Degree | 0 (0.0%) | 0 (0.0%) |
| Bachelor's Degree | 0 (0.0%) | 0 (0.0%) |
| Graduate Degree | 0 (0.0%) | 0 (0.0%) |
| Total | 0 (0.0%) | 0 (0.0%) |
Employment Characteristics in Santa Nella
Employment by Class of Employer in Santa Nella
Among the 819 employed individuals in Santa Nella, private company employees (714 | 87.2%), state government employees (56 | 6.8%), and local government employees (23 | 2.8%) make up the most common classes of employment.
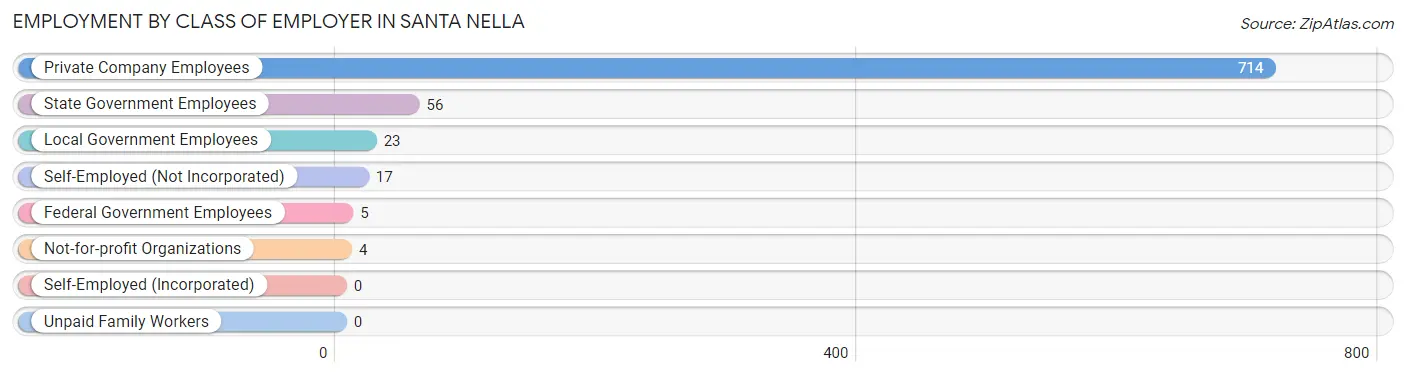
| Employer Class | # Employees | % Employees |
| Private Company Employees | 714 | 87.2% |
| Self-Employed (Incorporated) | 0 | 0.0% |
| Self-Employed (Not Incorporated) | 17 | 2.1% |
| Not-for-profit Organizations | 4 | 0.5% |
| Local Government Employees | 23 | 2.8% |
| State Government Employees | 56 | 6.8% |
| Federal Government Employees | 5 | 0.6% |
| Unpaid Family Workers | 0 | 0.0% |
| Total | 819 | 100.0% |
Employment Status by Age in Santa Nella
According to the labor force statistics for Santa Nella, out of the total population over 16 years of age (1,466), 65.6% or 962 individuals are in the labor force, with 12.3% or 118 of them unemployed. The age group with the highest labor force participation rate is 55 to 59 years, with 87.6% or 92 individuals in the labor force. Within the labor force, the 16 to 19 years age range has the highest percentage of unemployed individuals, with 91.4% or 53 of them being unemployed.
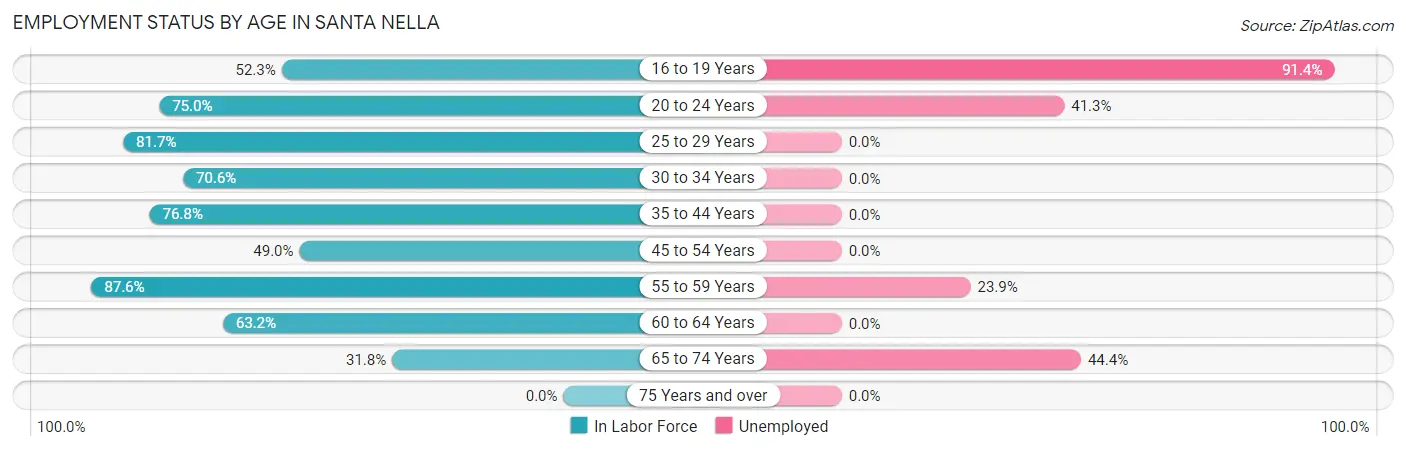
| Age Bracket | In Labor Force | Unemployed |
| 16 to 19 Years | 58 (52.3%) | 53 (91.4%) |
| 20 to 24 Years | 75 (75.0%) | 31 (41.3%) |
| 25 to 29 Years | 76 (81.7%) | 0 (0.0%) |
| 30 to 34 Years | 168 (70.6%) | 0 (0.0%) |
| 35 to 44 Years | 311 (76.8%) | 0 (0.0%) |
| 45 to 54 Years | 100 (49.0%) | 0 (0.0%) |
| 55 to 59 Years | 92 (87.6%) | 22 (23.9%) |
| 60 to 64 Years | 55 (63.2%) | 0 (0.0%) |
| 65 to 74 Years | 27 (31.8%) | 12 (44.4%) |
| 75 Years and over | 0 (0.0%) | 0 (0.0%) |
| Total | 962 (65.6%) | 118 (12.3%) |
Employment Status by Educational Attainment in Santa Nella
According to labor force statistics for Santa Nella, 70.8% of individuals (801) out of the total population between 25 and 64 years of age (1,132) are in the labor force, with 2.7% or 22 of them being unemployed. The group with the highest labor force participation rate are those with the educational attainment of college / associate degree, with 94.6% or 176 individuals in the labor force. Within the labor force, individuals with less than high school education have the highest percentage of unemployment, with 8.5% or 16 of them being unemployed.
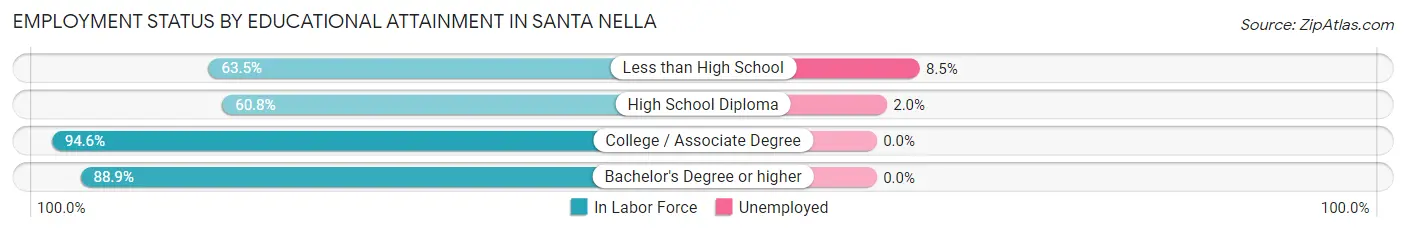
| Educational Attainment | In Labor Force | Unemployed |
| Less than High School | 188 (63.5%) | 25 (8.5%) |
| High School Diploma | 302 (60.8%) | 10 (2.0%) |
| College / Associate Degree | 176 (94.6%) | 0 (0.0%) |
| Bachelor's Degree or higher | 136 (88.9%) | 0 (0.0%) |
| Total | 801 (70.8%) | 31 (2.7%) |
Employment Occupations by Sex in Santa Nella
Management, Business, Science and Arts Occupations
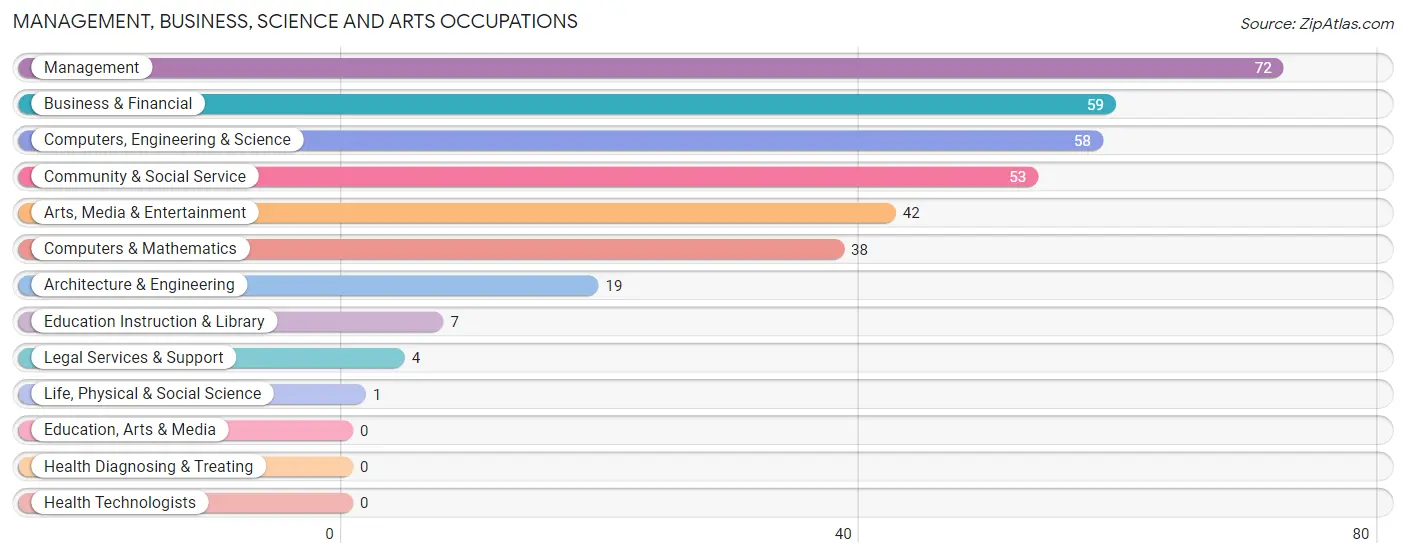
The most common Management, Business, Science and Arts occupations in Santa Nella are Management (72 | 8.5%), Business & Financial (59 | 7.0%), Computers, Engineering & Science (58 | 6.9%), Community & Social Service (53 | 6.3%), and Arts, Media & Entertainment (42 | 5.0%).
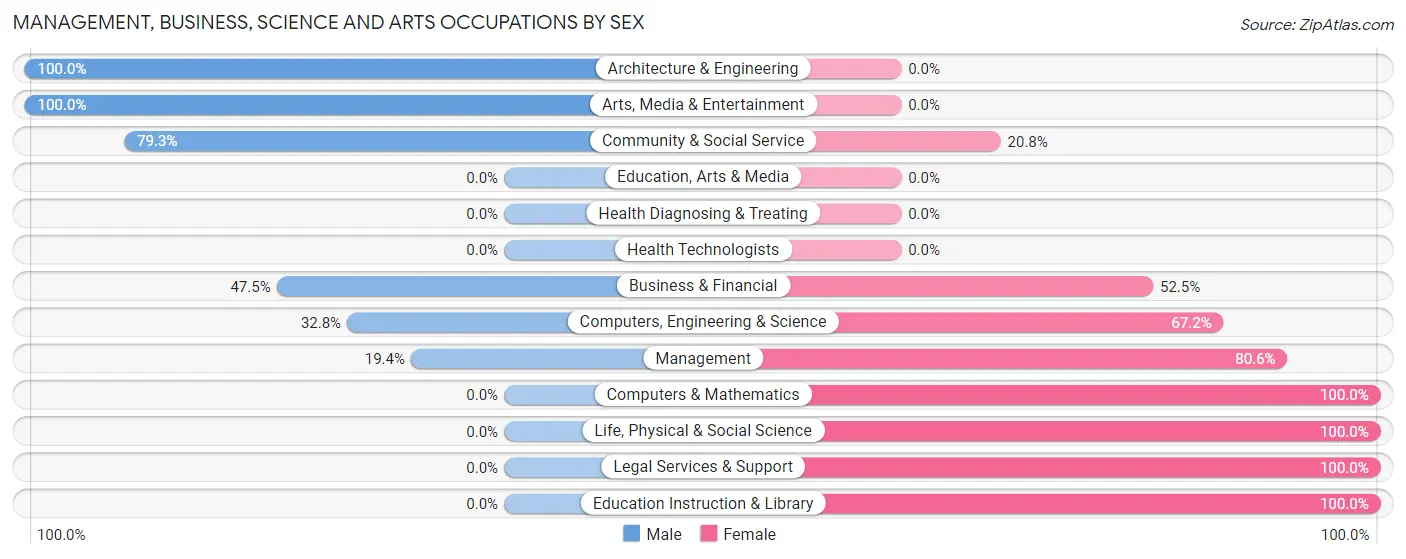
Management, Business, Science and Arts Occupations by Sex
Within the Management, Business, Science and Arts occupations in Santa Nella, the most male-oriented occupations are Architecture & Engineering (100.0%), Arts, Media & Entertainment (100.0%), and Community & Social Service (79.2%), while the most female-oriented occupations are Computers & Mathematics (100.0%), Life, Physical & Social Science (100.0%), and Legal Services & Support (100.0%).
| Occupation | Male | Female |
| Management | 14 (19.4%) | 58 (80.6%) |
| Business & Financial | 28 (47.5%) | 31 (52.5%) |
| Computers, Engineering & Science | 19 (32.8%) | 39 (67.2%) |
| Computers & Mathematics | 0 (0.0%) | 38 (100.0%) |
| Architecture & Engineering | 19 (100.0%) | 0 (0.0%) |
| Life, Physical & Social Science | 0 (0.0%) | 1 (100.0%) |
| Community & Social Service | 42 (79.2%) | 11 (20.7%) |
| Education, Arts & Media | 0 (0.0%) | 0 (0.0%) |
| Legal Services & Support | 0 (0.0%) | 4 (100.0%) |
| Education Instruction & Library | 0 (0.0%) | 7 (100.0%) |
| Arts, Media & Entertainment | 42 (100.0%) | 0 (0.0%) |
| Health Diagnosing & Treating | 0 (0.0%) | 0 (0.0%) |
| Health Technologists | 0 (0.0%) | 0 (0.0%) |
| Total (Category) | 103 (42.6%) | 139 (57.4%) |
| Total (Overall) | 506 (60.0%) | 338 (40.1%) |
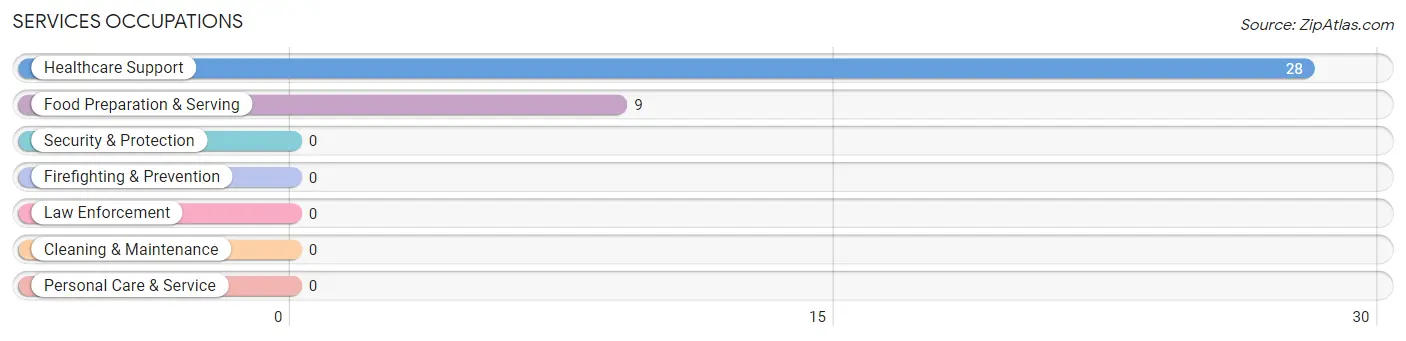
Services Occupations
The most common Services occupations in Santa Nella are Healthcare Support (28 | 3.3%), and Food Preparation & Serving (9 | 1.1%).
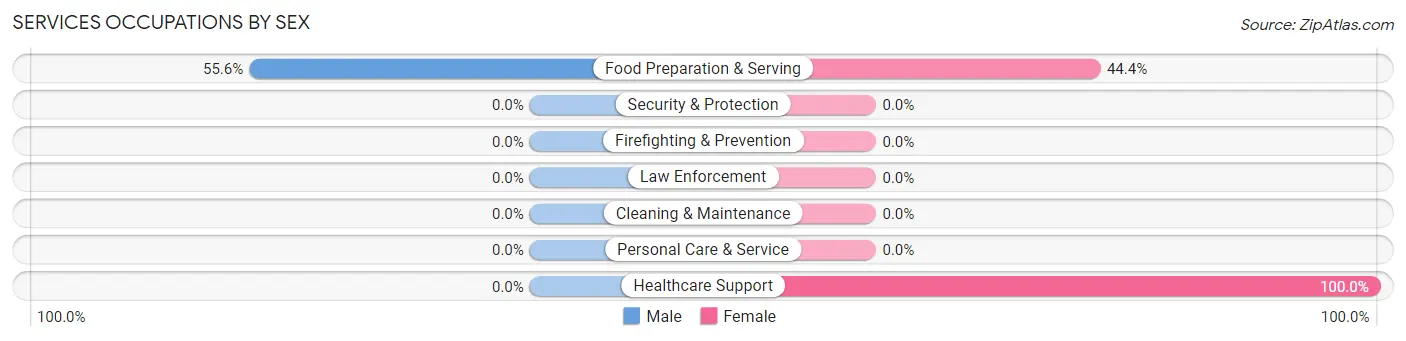
Services Occupations by Sex
| Occupation | Male | Female |
| Healthcare Support | 0 (0.0%) | 28 (100.0%) |
| Security & Protection | 0 (0.0%) | 0 (0.0%) |
| Firefighting & Prevention | 0 (0.0%) | 0 (0.0%) |
| Law Enforcement | 0 (0.0%) | 0 (0.0%) |
| Food Preparation & Serving | 5 (55.6%) | 4 (44.4%) |
| Cleaning & Maintenance | 0 (0.0%) | 0 (0.0%) |
| Personal Care & Service | 0 (0.0%) | 0 (0.0%) |
| Total (Category) | 5 (13.5%) | 32 (86.5%) |
| Total (Overall) | 506 (60.0%) | 338 (40.1%) |
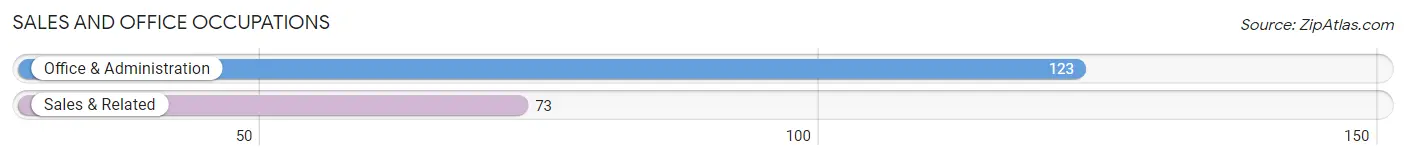
Sales and Office Occupations
The most common Sales and Office occupations in Santa Nella are Office & Administration (123 | 14.6%), and Sales & Related (73 | 8.6%).
Sales and Office Occupations by Sex
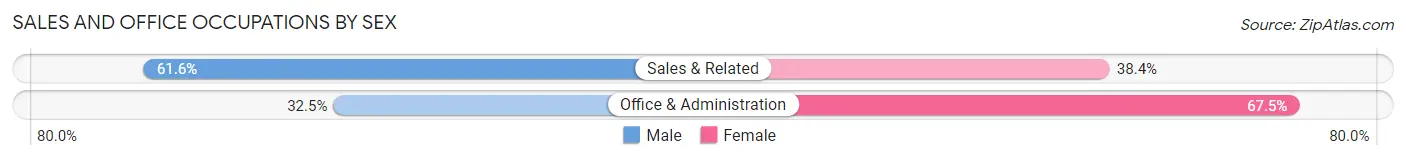
| Occupation | Male | Female |
| Sales & Related | 45 (61.6%) | 28 (38.4%) |
| Office & Administration | 40 (32.5%) | 83 (67.5%) |
| Total (Category) | 85 (43.4%) | 111 (56.6%) |
| Total (Overall) | 506 (60.0%) | 338 (40.1%) |
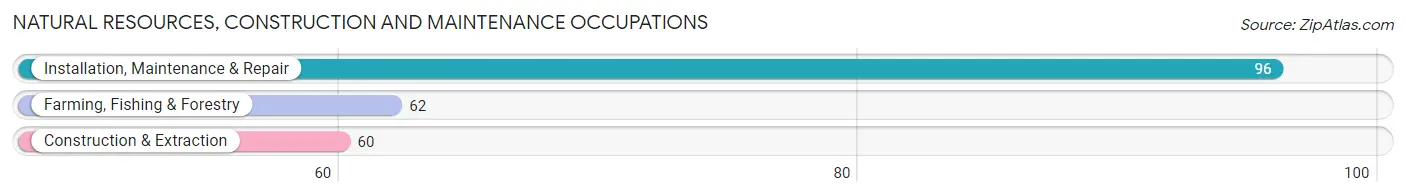
Natural Resources, Construction and Maintenance Occupations
The most common Natural Resources, Construction and Maintenance occupations in Santa Nella are Installation, Maintenance & Repair (96 | 11.4%), Farming, Fishing & Forestry (62 | 7.3%), and Construction & Extraction (60 | 7.1%).
Natural Resources, Construction and Maintenance Occupations by Sex
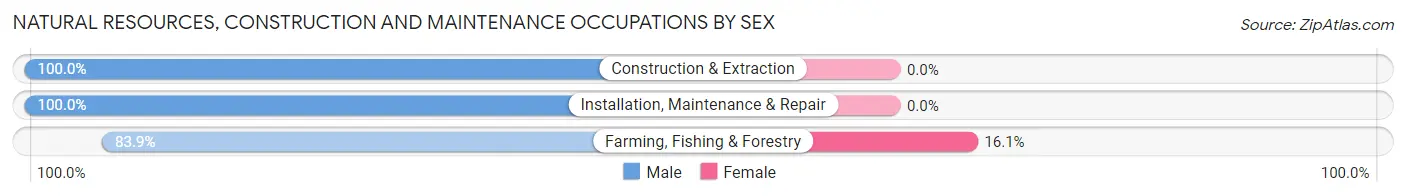
| Occupation | Male | Female |
| Farming, Fishing & Forestry | 52 (83.9%) | 10 (16.1%) |
| Construction & Extraction | 60 (100.0%) | 0 (0.0%) |
| Installation, Maintenance & Repair | 96 (100.0%) | 0 (0.0%) |
| Total (Category) | 208 (95.4%) | 10 (4.6%) |
| Total (Overall) | 506 (60.0%) | 338 (40.1%) |
Production, Transportation and Moving Occupations
The most common Production, Transportation and Moving occupations in Santa Nella are Transportation (100 | 11.8%), Material Moving (31 | 3.7%), and Production (20 | 2.4%).
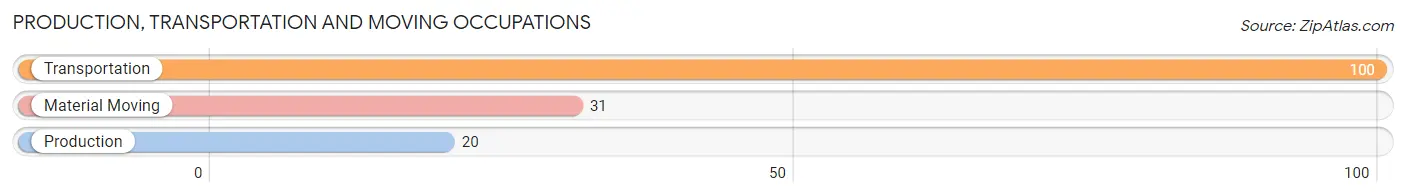
Production, Transportation and Moving Occupations by Sex
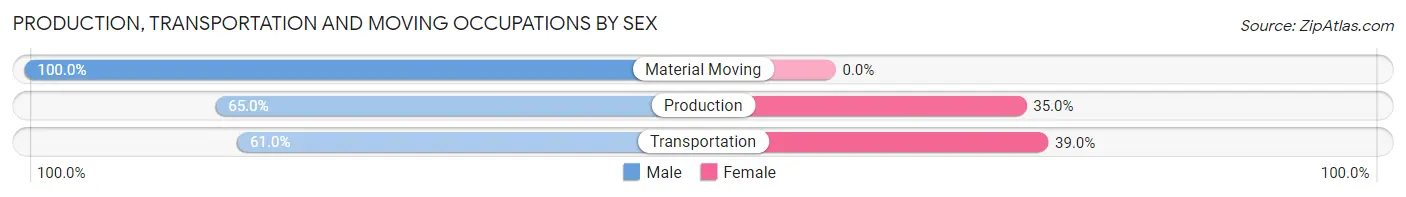
| Occupation | Male | Female |
| Production | 13 (65.0%) | 7 (35.0%) |
| Transportation | 61 (61.0%) | 39 (39.0%) |
| Material Moving | 31 (100.0%) | 0 (0.0%) |
| Total (Category) | 105 (69.5%) | 46 (30.5%) |
| Total (Overall) | 506 (60.0%) | 338 (40.1%) |
Employment Industries by Sex in Santa Nella
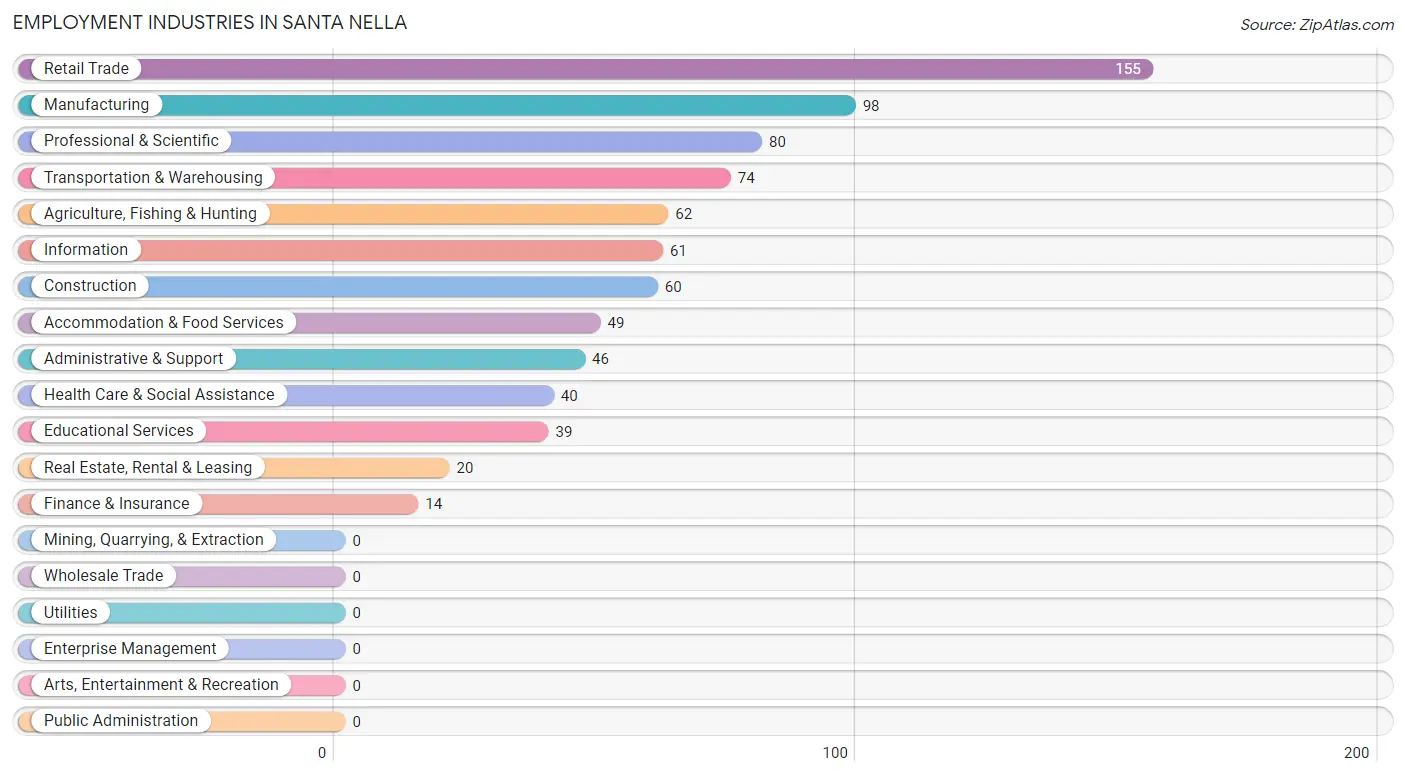
Employment Industries in Santa Nella
The major employment industries in Santa Nella include Retail Trade (155 | 18.4%), Manufacturing (98 | 11.6%), Professional & Scientific (80 | 9.5%), Transportation & Warehousing (74 | 8.8%), and Agriculture, Fishing & Hunting (62 | 7.3%).
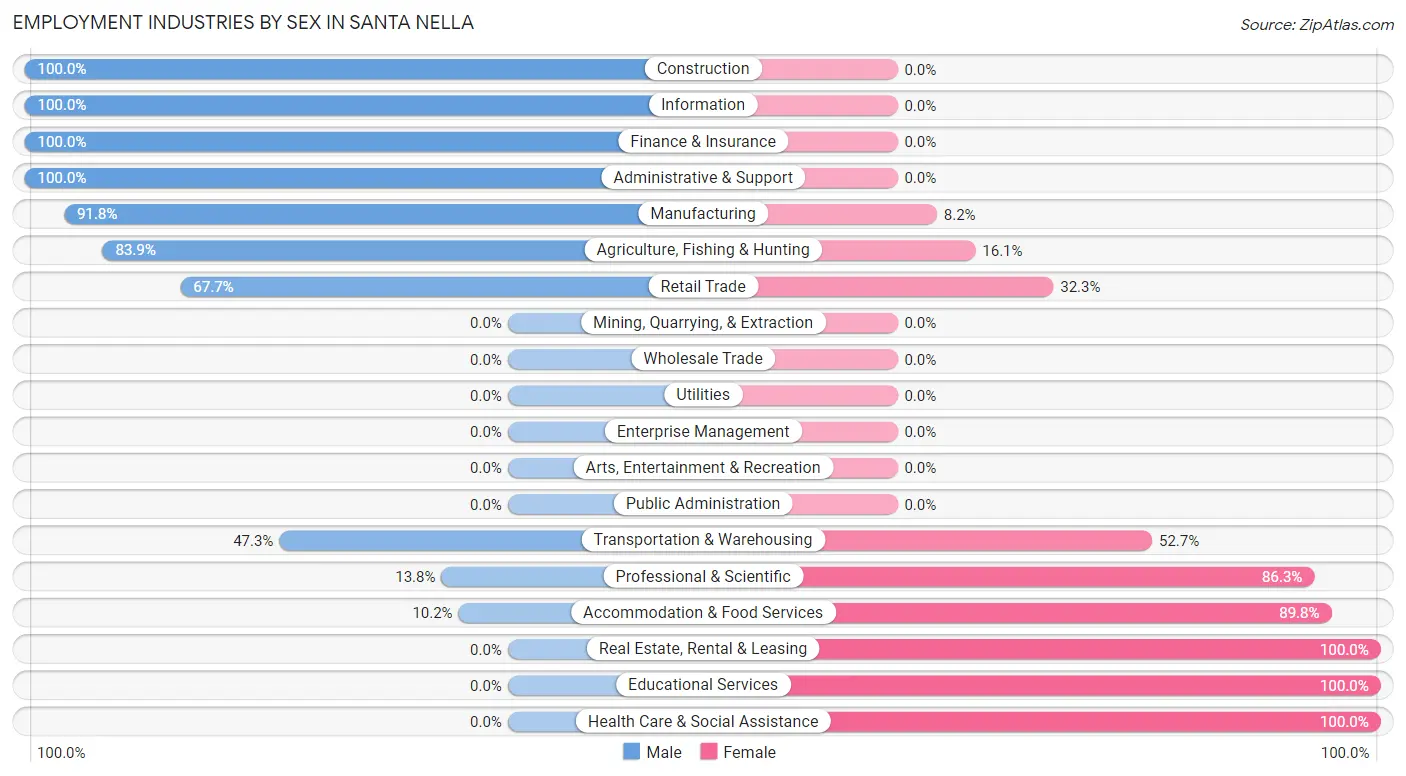
Employment Industries by Sex in Santa Nella
The Santa Nella industries that see more men than women are Construction (100.0%), Information (100.0%), and Finance & Insurance (100.0%), whereas the industries that tend to have a higher number of women are Real Estate, Rental & Leasing (100.0%), Educational Services (100.0%), and Health Care & Social Assistance (100.0%).
| Industry | Male | Female |
| Agriculture, Fishing & Hunting | 52 (83.9%) | 10 (16.1%) |
| Mining, Quarrying, & Extraction | 0 (0.0%) | 0 (0.0%) |
| Construction | 60 (100.0%) | 0 (0.0%) |
| Manufacturing | 90 (91.8%) | 8 (8.2%) |
| Wholesale Trade | 0 (0.0%) | 0 (0.0%) |
| Retail Trade | 105 (67.7%) | 50 (32.3%) |
| Transportation & Warehousing | 35 (47.3%) | 39 (52.7%) |
| Utilities | 0 (0.0%) | 0 (0.0%) |
| Information | 61 (100.0%) | 0 (0.0%) |
| Finance & Insurance | 14 (100.0%) | 0 (0.0%) |
| Real Estate, Rental & Leasing | 0 (0.0%) | 20 (100.0%) |
| Professional & Scientific | 11 (13.8%) | 69 (86.3%) |
| Enterprise Management | 0 (0.0%) | 0 (0.0%) |
| Administrative & Support | 46 (100.0%) | 0 (0.0%) |
| Educational Services | 0 (0.0%) | 39 (100.0%) |
| Health Care & Social Assistance | 0 (0.0%) | 40 (100.0%) |
| Arts, Entertainment & Recreation | 0 (0.0%) | 0 (0.0%) |
| Accommodation & Food Services | 5 (10.2%) | 44 (89.8%) |
| Public Administration | 0 (0.0%) | 0 (0.0%) |
| Total | 506 (60.0%) | 338 (40.1%) |
Education in Santa Nella
School Enrollment in Santa Nella
The most common levels of schooling among the 571 students in Santa Nella are elementary school (187 | 32.8%), high school (135 | 23.6%), and middle school (111 | 19.4%).
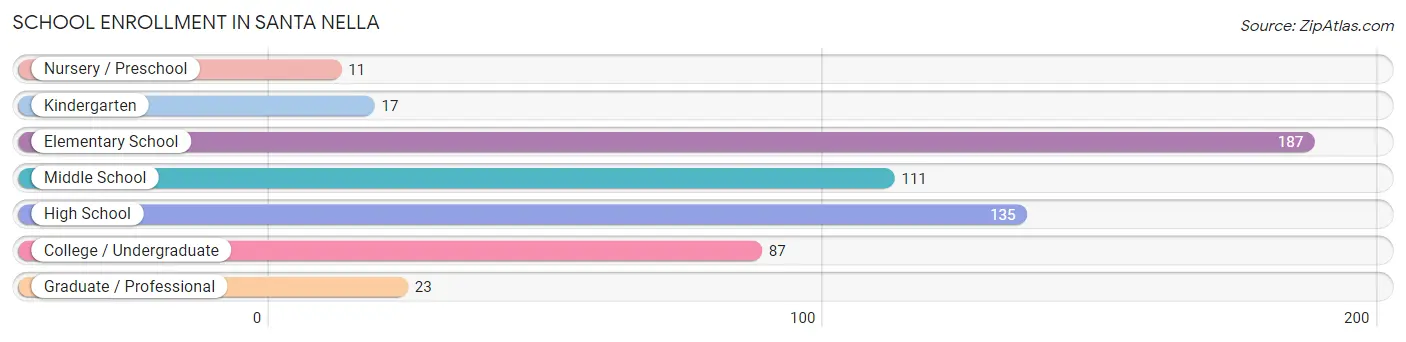
| School Level | # Students | % Students |
| Nursery / Preschool | 11 | 1.9% |
| Kindergarten | 17 | 3.0% |
| Elementary School | 187 | 32.8% |
| Middle School | 111 | 19.4% |
| High School | 135 | 23.6% |
| College / Undergraduate | 87 | 15.2% |
| Graduate / Professional | 23 | 4.0% |
| Total | 571 | 100.0% |
School Enrollment by Age by Funding Source in Santa Nella
Out of a total of 571 students who are enrolled in schools in Santa Nella, 11 (1.9%) attend a private institution, while the remaining 560 (98.1%) are enrolled in public schools. The age group of 3 to 4 year olds has the highest likelihood of being enrolled in private schools, with 11 (100.0% in the age bracket) enrolled. Conversely, the age group of 5 to 9 year old has the lowest likelihood of being enrolled in a private school, with 165 (100.0% in the age bracket) attending a public institution.
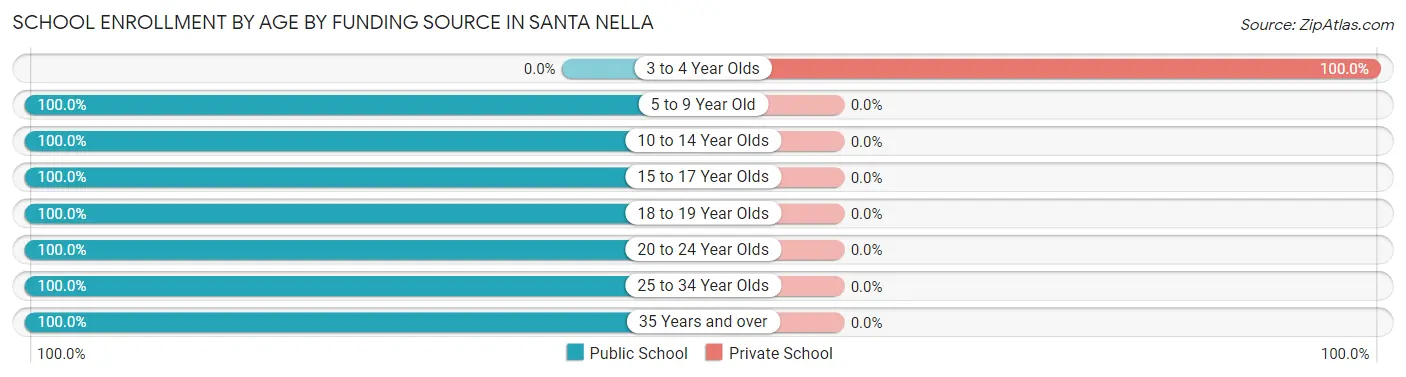
| Age Bracket | Public School | Private School |
| 3 to 4 Year Olds | 0 (0.0%) | 11 (100.0%) |
| 5 to 9 Year Old | 165 (100.0%) | 0 (0.0%) |
| 10 to 14 Year Olds | 169 (100.0%) | 0 (0.0%) |
| 15 to 17 Year Olds | 124 (100.0%) | 0 (0.0%) |
| 18 to 19 Year Olds | 5 (100.0%) | 0 (0.0%) |
| 20 to 24 Year Olds | 36 (100.0%) | 0 (0.0%) |
| 25 to 34 Year Olds | 34 (100.0%) | 0 (0.0%) |
| 35 Years and over | 27 (100.0%) | 0 (0.0%) |
| Total | 560 (98.1%) | 11 (1.9%) |
Educational Attainment by Field of Study in Santa Nella
Communications (41 | 25.8%), psychology (35 | 22.0%), science & technology (29 | 18.2%), arts & humanities (23 | 14.5%), and computers & mathematics (17 | 10.7%) are the most common fields of study among 159 individuals in Santa Nella who have obtained a bachelor's degree or higher.
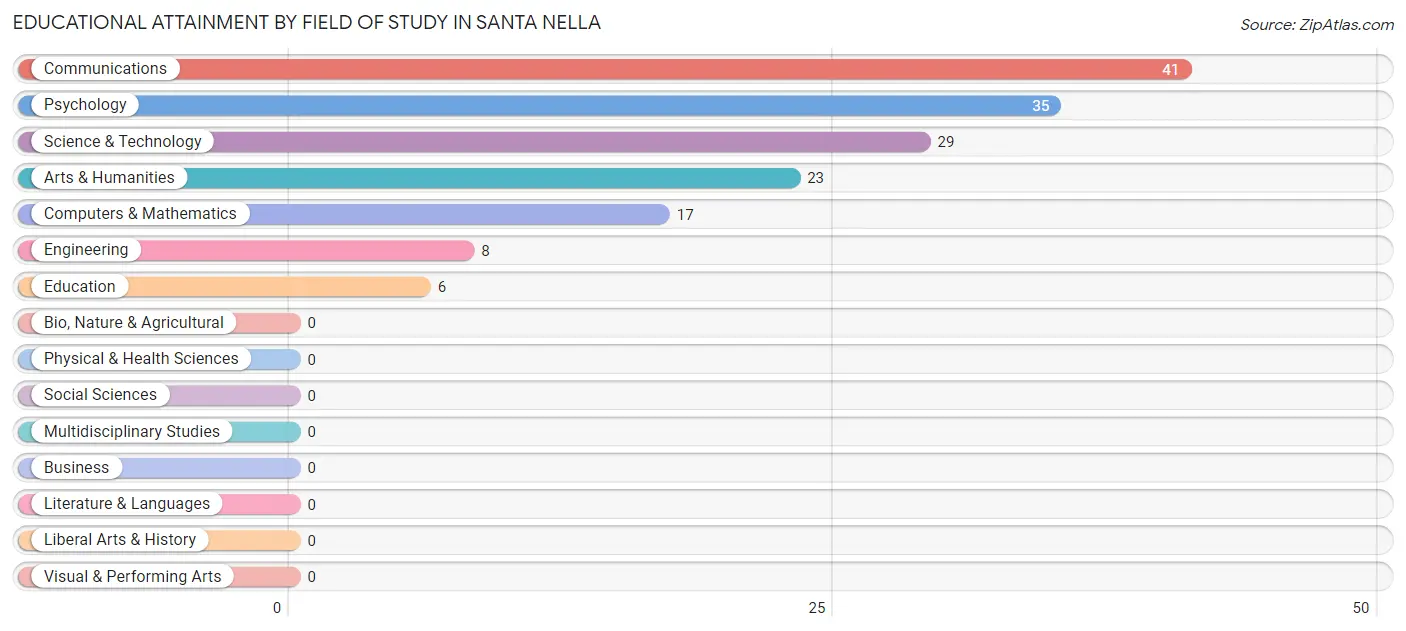
| Field of Study | # Graduates | % Graduates |
| Computers & Mathematics | 17 | 10.7% |
| Bio, Nature & Agricultural | 0 | 0.0% |
| Physical & Health Sciences | 0 | 0.0% |
| Psychology | 35 | 22.0% |
| Social Sciences | 0 | 0.0% |
| Engineering | 8 | 5.0% |
| Multidisciplinary Studies | 0 | 0.0% |
| Science & Technology | 29 | 18.2% |
| Business | 0 | 0.0% |
| Education | 6 | 3.8% |
| Literature & Languages | 0 | 0.0% |
| Liberal Arts & History | 0 | 0.0% |
| Visual & Performing Arts | 0 | 0.0% |
| Communications | 41 | 25.8% |
| Arts & Humanities | 23 | 14.5% |
| Total | 159 | 100.0% |
Transportation & Commute in Santa Nella
Vehicle Availability by Sex in Santa Nella
The most prevalent vehicle ownership categories in Santa Nella are males with 2 vehicles (165, accounting for 34.2%) and females with 2 vehicles (97, making up 49.0%).
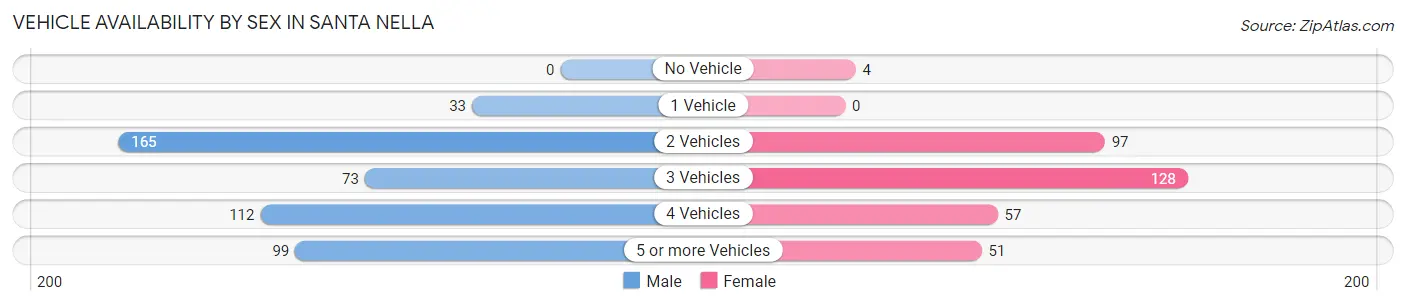
| Vehicles Available | Male | Female |
| No Vehicle | 0 (0.0%) | 4 (1.2%) |
| 1 Vehicle | 33 (6.9%) | 0 (0.0%) |
| 2 Vehicles | 165 (34.2%) | 97 (28.8%) |
| 3 Vehicles | 73 (15.1%) | 128 (38.0%) |
| 4 Vehicles | 112 (23.2%) | 57 (16.9%) |
| 5 or more Vehicles | 99 (20.5%) | 51 (15.1%) |
| Total | 482 (100.0%) | 337 (100.0%) |
Commute Time in Santa Nella
The most frequently occuring commute durations in Santa Nella are 45 to 59 minutes (163 commuters, 23.3%), 60 to 89 minutes (146 commuters, 20.8%), and 90 or more minutes (143 commuters, 20.4%).
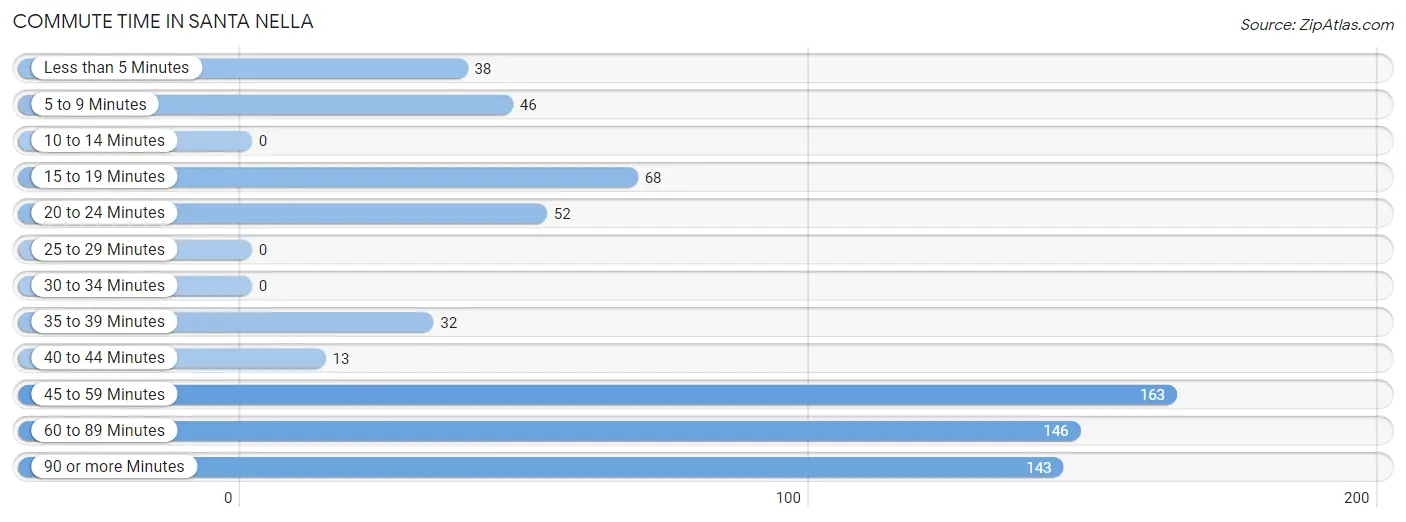
| Commute Time | # Commuters | % Commuters |
| Less than 5 Minutes | 38 | 5.4% |
| 5 to 9 Minutes | 46 | 6.6% |
| 10 to 14 Minutes | 0 | 0.0% |
| 15 to 19 Minutes | 68 | 9.7% |
| 20 to 24 Minutes | 52 | 7.4% |
| 25 to 29 Minutes | 0 | 0.0% |
| 30 to 34 Minutes | 0 | 0.0% |
| 35 to 39 Minutes | 32 | 4.6% |
| 40 to 44 Minutes | 13 | 1.8% |
| 45 to 59 Minutes | 163 | 23.3% |
| 60 to 89 Minutes | 146 | 20.8% |
| 90 or more Minutes | 143 | 20.4% |
Commute Time by Sex in Santa Nella
The most common commute times in Santa Nella are 45 to 59 minutes (125 commuters, 28.9%) for males and 90 or more minutes (77 commuters, 28.6%) for females.
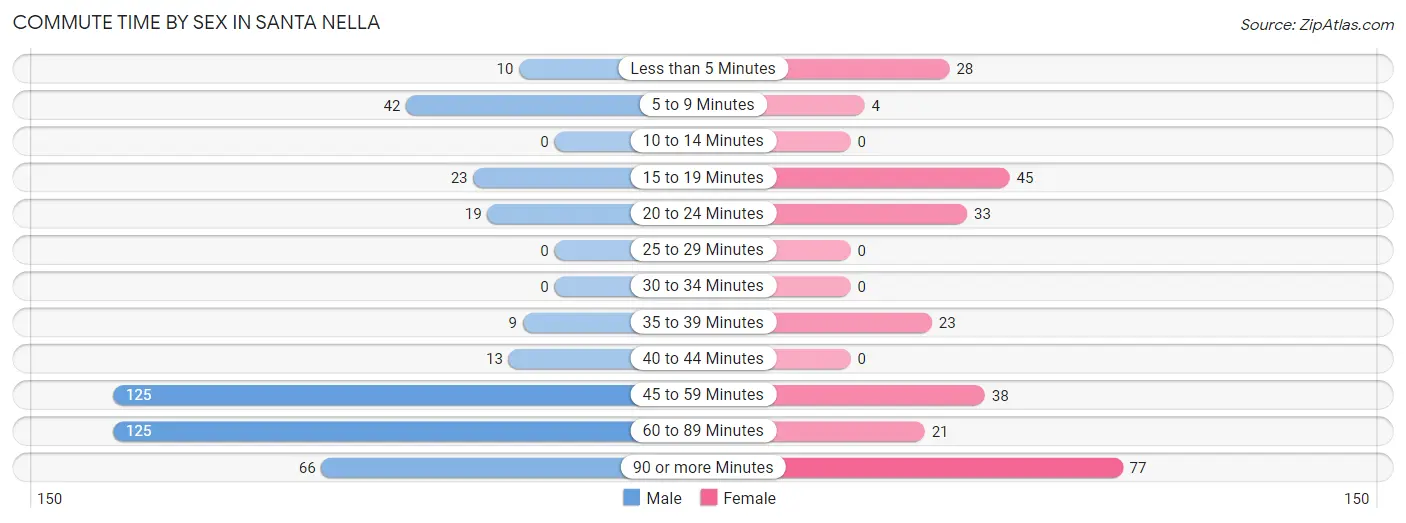
| Commute Time | Male | Female |
| Less than 5 Minutes | 10 (2.3%) | 28 (10.4%) |
| 5 to 9 Minutes | 42 (9.7%) | 4 (1.5%) |
| 10 to 14 Minutes | 0 (0.0%) | 0 (0.0%) |
| 15 to 19 Minutes | 23 (5.3%) | 45 (16.7%) |
| 20 to 24 Minutes | 19 (4.4%) | 33 (12.3%) |
| 25 to 29 Minutes | 0 (0.0%) | 0 (0.0%) |
| 30 to 34 Minutes | 0 (0.0%) | 0 (0.0%) |
| 35 to 39 Minutes | 9 (2.1%) | 23 (8.6%) |
| 40 to 44 Minutes | 13 (3.0%) | 0 (0.0%) |
| 45 to 59 Minutes | 125 (28.9%) | 38 (14.1%) |
| 60 to 89 Minutes | 125 (28.9%) | 21 (7.8%) |
| 90 or more Minutes | 66 (15.3%) | 77 (28.6%) |
Time of Departure to Work by Sex in Santa Nella
The most frequent times of departure to work in Santa Nella are 12:00 AM to 4:59 AM (151, 34.9%) for males and 5:00 AM to 5:29 AM (71, 26.4%) for females.
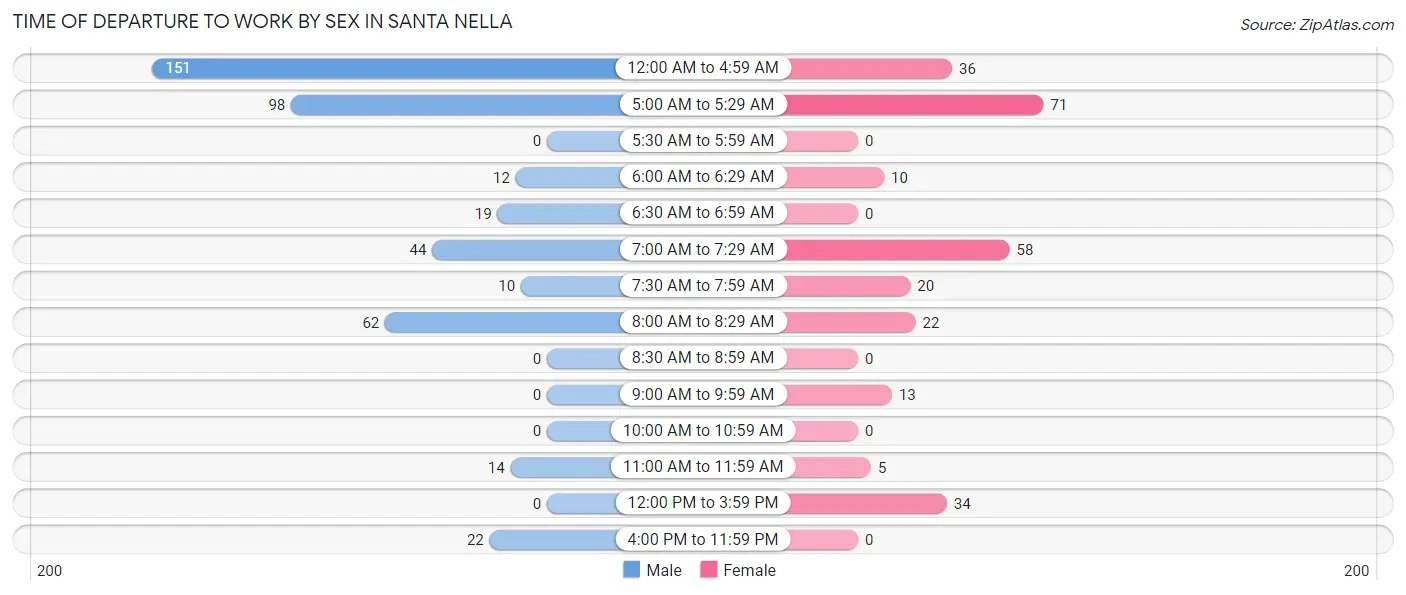
| Time of Departure | Male | Female |
| 12:00 AM to 4:59 AM | 151 (34.9%) | 36 (13.4%) |
| 5:00 AM to 5:29 AM | 98 (22.7%) | 71 (26.4%) |
| 5:30 AM to 5:59 AM | 0 (0.0%) | 0 (0.0%) |
| 6:00 AM to 6:29 AM | 12 (2.8%) | 10 (3.7%) |
| 6:30 AM to 6:59 AM | 19 (4.4%) | 0 (0.0%) |
| 7:00 AM to 7:29 AM | 44 (10.2%) | 58 (21.6%) |
| 7:30 AM to 7:59 AM | 10 (2.3%) | 20 (7.4%) |
| 8:00 AM to 8:29 AM | 62 (14.3%) | 22 (8.2%) |
| 8:30 AM to 8:59 AM | 0 (0.0%) | 0 (0.0%) |
| 9:00 AM to 9:59 AM | 0 (0.0%) | 13 (4.8%) |
| 10:00 AM to 10:59 AM | 0 (0.0%) | 0 (0.0%) |
| 11:00 AM to 11:59 AM | 14 (3.2%) | 5 (1.9%) |
| 12:00 PM to 3:59 PM | 0 (0.0%) | 34 (12.6%) |
| 4:00 PM to 11:59 PM | 22 (5.1%) | 0 (0.0%) |
| Total | 432 (100.0%) | 269 (100.0%) |
Housing Occupancy in Santa Nella
Occupancy by Ownership in Santa Nella
Of the total 530 dwellings in Santa Nella, owner-occupied units account for 336 (63.4%), while renter-occupied units make up 194 (36.6%).
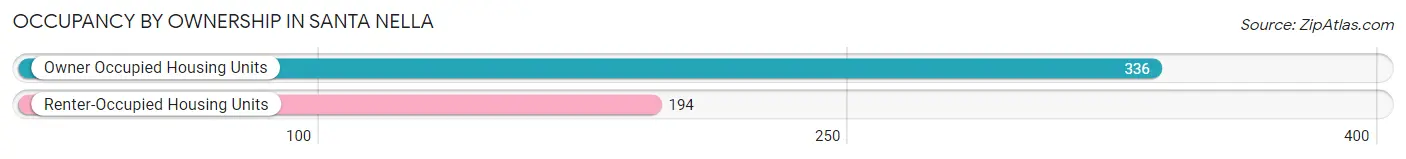
| Occupancy | # Housing Units | % Housing Units |
| Owner Occupied Housing Units | 336 | 63.4% |
| Renter-Occupied Housing Units | 194 | 36.6% |
| Total Occupied Housing Units | 530 | 100.0% |
Occupancy by Household Size in Santa Nella
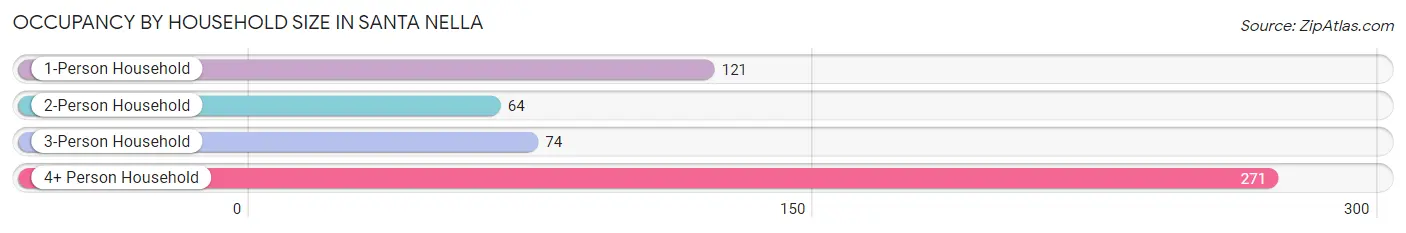
| Household Size | # Housing Units | % Housing Units |
| 1-Person Household | 121 | 22.8% |
| 2-Person Household | 64 | 12.1% |
| 3-Person Household | 74 | 14.0% |
| 4+ Person Household | 271 | 51.1% |
| Total Housing Units | 530 | 100.0% |
Occupancy by Ownership by Household Size in Santa Nella
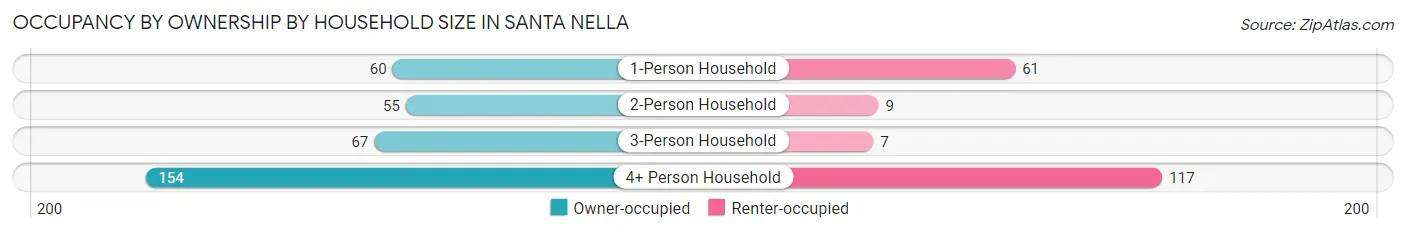
| Household Size | Owner-occupied | Renter-occupied |
| 1-Person Household | 60 (49.6%) | 61 (50.4%) |
| 2-Person Household | 55 (85.9%) | 9 (14.1%) |
| 3-Person Household | 67 (90.5%) | 7 (9.5%) |
| 4+ Person Household | 154 (56.8%) | 117 (43.2%) |
| Total Housing Units | 336 (63.4%) | 194 (36.6%) |
Occupancy by Educational Attainment in Santa Nella
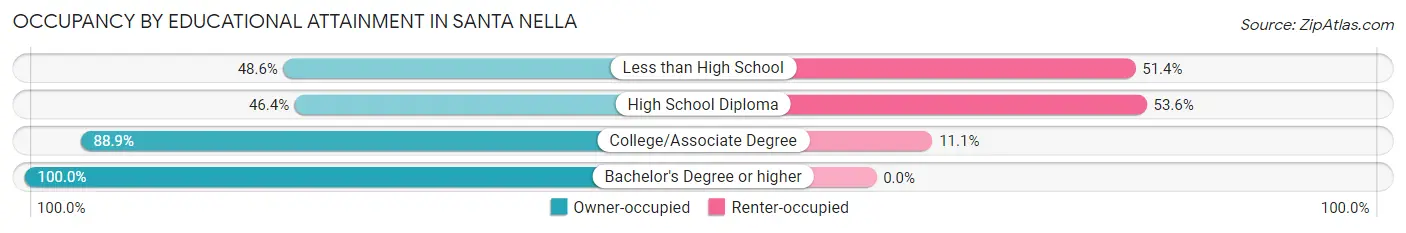
| Household Size | Owner-occupied | Renter-occupied |
| Less than High School | 89 (48.6%) | 94 (51.4%) |
| High School Diploma | 77 (46.4%) | 89 (53.6%) |
| College/Associate Degree | 88 (88.9%) | 11 (11.1%) |
| Bachelor's Degree or higher | 82 (100.0%) | 0 (0.0%) |
Occupancy by Age of Householder in Santa Nella
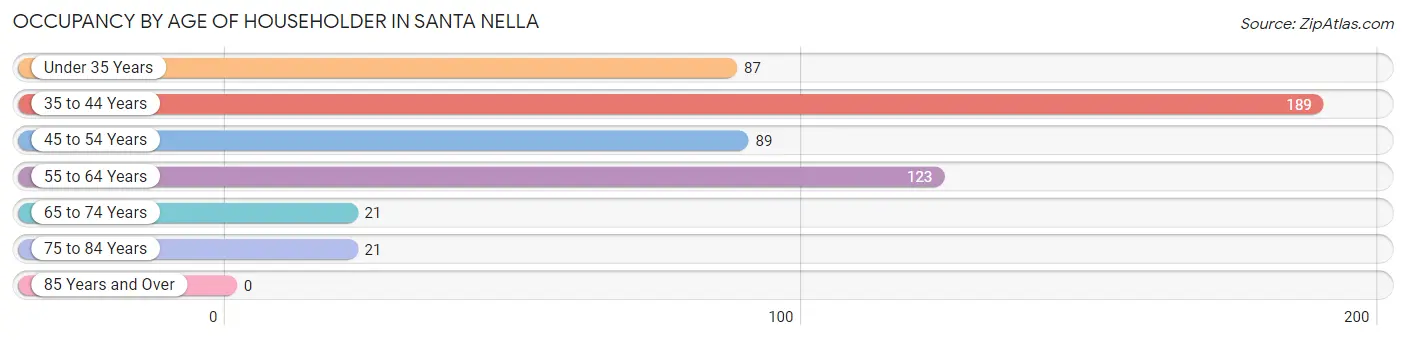
| Age Bracket | # Households | % Households |
| Under 35 Years | 87 | 16.4% |
| 35 to 44 Years | 189 | 35.7% |
| 45 to 54 Years | 89 | 16.8% |
| 55 to 64 Years | 123 | 23.2% |
| 65 to 74 Years | 21 | 4.0% |
| 75 to 84 Years | 21 | 4.0% |
| 85 Years and Over | 0 | 0.0% |
| Total | 530 | 100.0% |
Housing Finances in Santa Nella
Median Income by Occupancy in Santa Nella
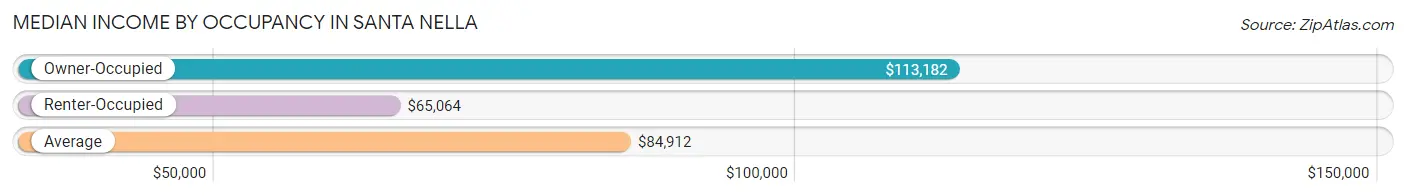
| Occupancy Type | # Households | Median Income |
| Owner-Occupied | 336 (63.4%) | $113,182 |
| Renter-Occupied | 194 (36.6%) | $65,064 |
| Average | 530 (100.0%) | $84,912 |
Occupancy by Householder Income Bracket in Santa Nella
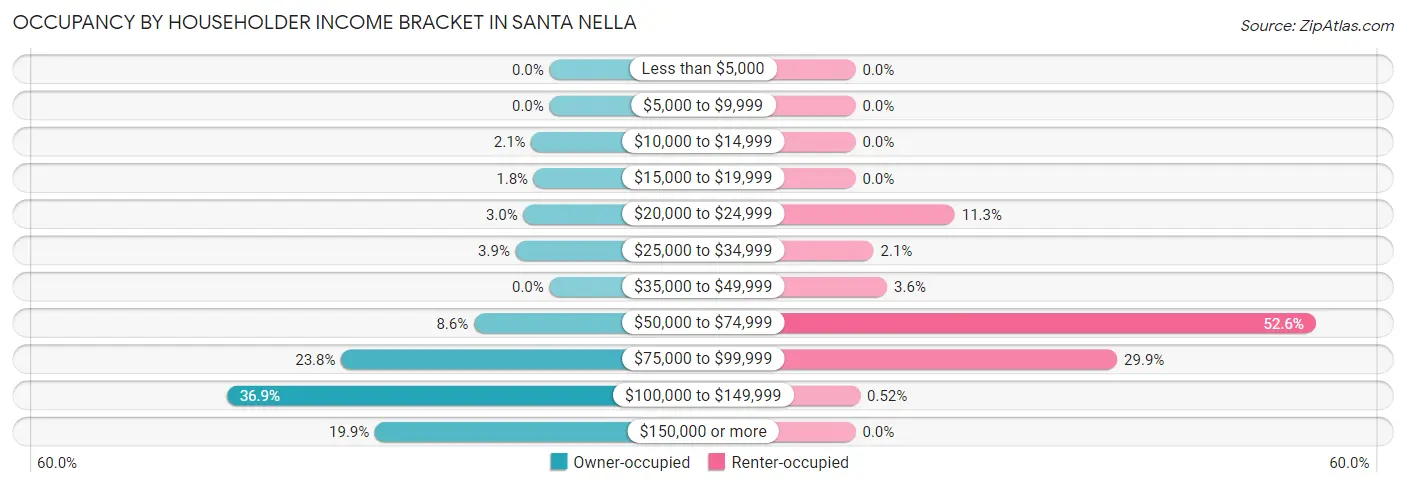
| Income Bracket | Owner-occupied | Renter-occupied |
| Less than $5,000 | 0 (0.0%) | 0 (0.0%) |
| $5,000 to $9,999 | 0 (0.0%) | 0 (0.0%) |
| $10,000 to $14,999 | 7 (2.1%) | 0 (0.0%) |
| $15,000 to $19,999 | 6 (1.8%) | 0 (0.0%) |
| $20,000 to $24,999 | 10 (3.0%) | 22 (11.3%) |
| $25,000 to $34,999 | 13 (3.9%) | 4 (2.1%) |
| $35,000 to $49,999 | 0 (0.0%) | 7 (3.6%) |
| $50,000 to $74,999 | 29 (8.6%) | 102 (52.6%) |
| $75,000 to $99,999 | 80 (23.8%) | 58 (29.9%) |
| $100,000 to $149,999 | 124 (36.9%) | 1 (0.5%) |
| $150,000 or more | 67 (19.9%) | 0 (0.0%) |
| Total | 336 (100.0%) | 194 (100.0%) |
Monthly Housing Cost Tiers in Santa Nella

| Monthly Cost | Owner-occupied | Renter-occupied |
| Less than $300 | 35 (10.4%) | 0 (0.0%) |
| $300 to $499 | 18 (5.4%) | 0 (0.0%) |
| $500 to $799 | 20 (5.9%) | 0 (0.0%) |
| $800 to $999 | 38 (11.3%) | 108 (55.7%) |
| $1,000 to $1,499 | 51 (15.2%) | 27 (13.9%) |
| $1,500 to $1,999 | 73 (21.7%) | 50 (25.8%) |
| $2,000 to $2,499 | 69 (20.5%) | 0 (0.0%) |
| $2,500 to $2,999 | 15 (4.5%) | 0 (0.0%) |
| $3,000 or more | 17 (5.1%) | 0 (0.0%) |
| Total | 336 (100.0%) | 194 (100.0%) |
Physical Housing Characteristics in Santa Nella
Housing Structures in Santa Nella
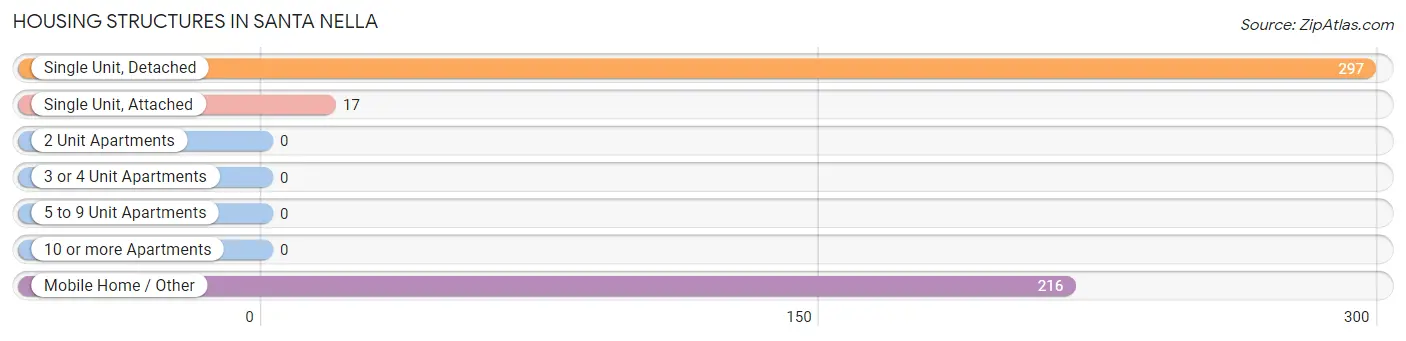
| Structure Type | # Housing Units | % Housing Units |
| Single Unit, Detached | 297 | 56.0% |
| Single Unit, Attached | 17 | 3.2% |
| 2 Unit Apartments | 0 | 0.0% |
| 3 or 4 Unit Apartments | 0 | 0.0% |
| 5 to 9 Unit Apartments | 0 | 0.0% |
| 10 or more Apartments | 0 | 0.0% |
| Mobile Home / Other | 216 | 40.7% |
| Total | 530 | 100.0% |
Housing Structures by Occupancy in Santa Nella
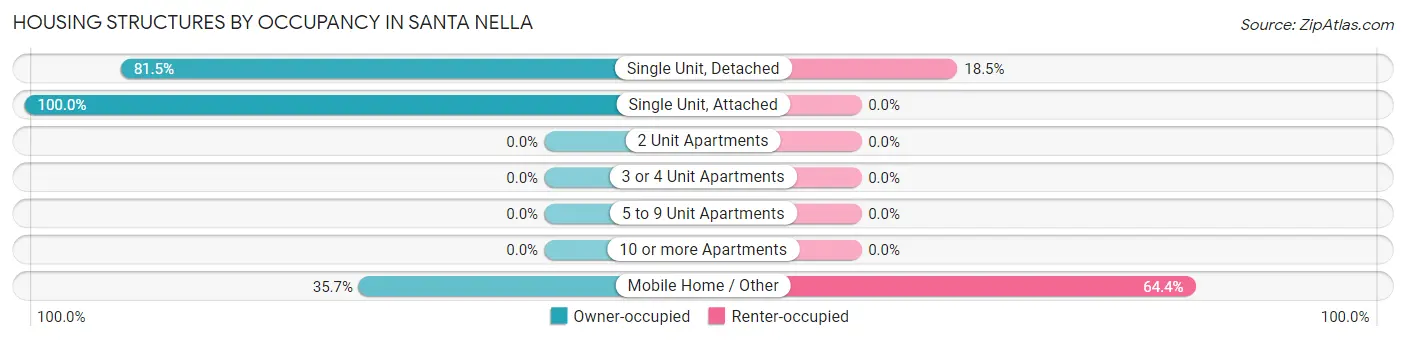
| Structure Type | Owner-occupied | Renter-occupied |
| Single Unit, Detached | 242 (81.5%) | 55 (18.5%) |
| Single Unit, Attached | 17 (100.0%) | 0 (0.0%) |
| 2 Unit Apartments | 0 (0.0%) | 0 (0.0%) |
| 3 or 4 Unit Apartments | 0 (0.0%) | 0 (0.0%) |
| 5 to 9 Unit Apartments | 0 (0.0%) | 0 (0.0%) |
| 10 or more Apartments | 0 (0.0%) | 0 (0.0%) |
| Mobile Home / Other | 77 (35.6%) | 139 (64.3%) |
| Total | 336 (63.4%) | 194 (36.6%) |
Housing Structures by Number of Rooms in Santa Nella
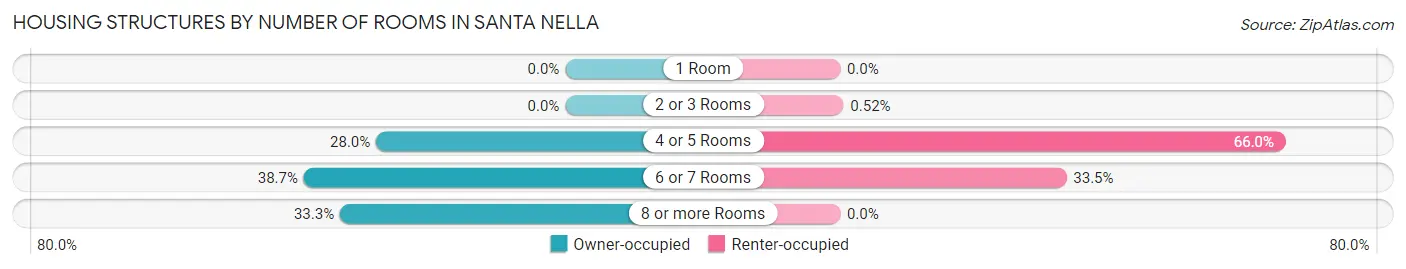
| Number of Rooms | Owner-occupied | Renter-occupied |
| 1 Room | 0 (0.0%) | 0 (0.0%) |
| 2 or 3 Rooms | 0 (0.0%) | 1 (0.5%) |
| 4 or 5 Rooms | 94 (28.0%) | 128 (66.0%) |
| 6 or 7 Rooms | 130 (38.7%) | 65 (33.5%) |
| 8 or more Rooms | 112 (33.3%) | 0 (0.0%) |
| Total | 336 (100.0%) | 194 (100.0%) |
Housing Structure by Heating Type in Santa Nella
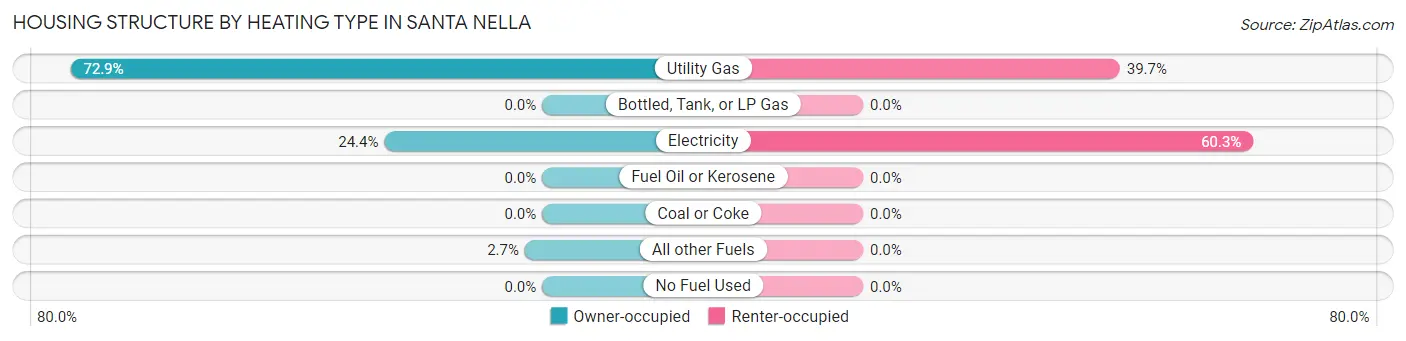
| Heating Type | Owner-occupied | Renter-occupied |
| Utility Gas | 245 (72.9%) | 77 (39.7%) |
| Bottled, Tank, or LP Gas | 0 (0.0%) | 0 (0.0%) |
| Electricity | 82 (24.4%) | 117 (60.3%) |
| Fuel Oil or Kerosene | 0 (0.0%) | 0 (0.0%) |
| Coal or Coke | 0 (0.0%) | 0 (0.0%) |
| All other Fuels | 9 (2.7%) | 0 (0.0%) |
| No Fuel Used | 0 (0.0%) | 0 (0.0%) |
| Total | 336 (100.0%) | 194 (100.0%) |
Household Vehicle Usage in Santa Nella
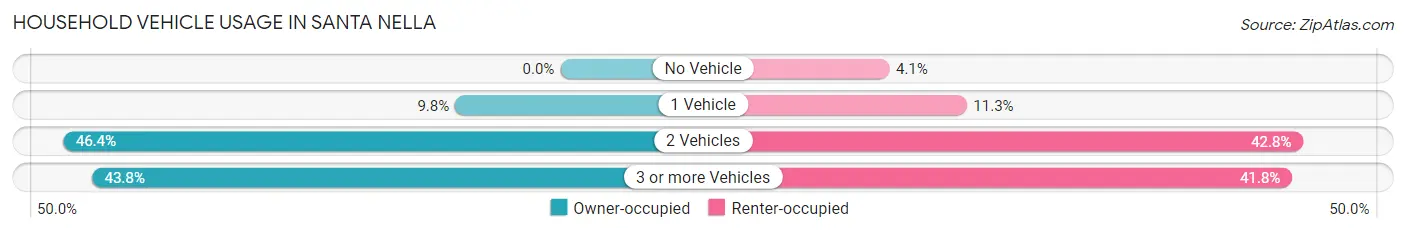
| Vehicles per Household | Owner-occupied | Renter-occupied |
| No Vehicle | 0 (0.0%) | 8 (4.1%) |
| 1 Vehicle | 33 (9.8%) | 22 (11.3%) |
| 2 Vehicles | 156 (46.4%) | 83 (42.8%) |
| 3 or more Vehicles | 147 (43.8%) | 81 (41.7%) |
| Total | 336 (100.0%) | 194 (100.0%) |
Real Estate & Mortgages in Santa Nella
Real Estate and Mortgage Overview in Santa Nella
| Characteristic | Without Mortgage | With Mortgage |
| Housing Units | 84 | 252 |
| Median Property Value | $776,600 | $426,500 |
| Median Household Income | $121,053 | $36 |
| Monthly Housing Costs | - | - |
| Real Estate Taxes | - | - |
Property Value by Mortgage Status in Santa Nella
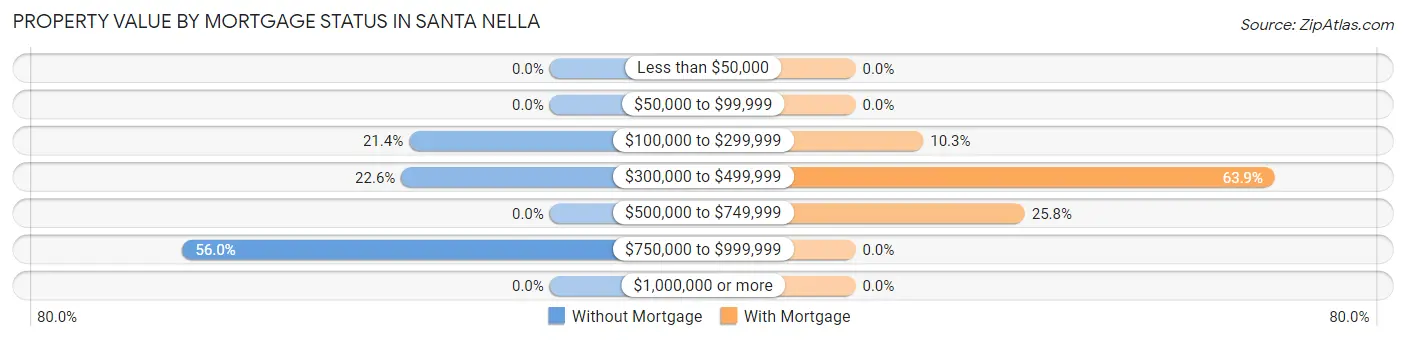
| Property Value | Without Mortgage | With Mortgage |
| Less than $50,000 | 0 (0.0%) | 0 (0.0%) |
| $50,000 to $99,999 | 0 (0.0%) | 0 (0.0%) |
| $100,000 to $299,999 | 18 (21.4%) | 26 (10.3%) |
| $300,000 to $499,999 | 19 (22.6%) | 161 (63.9%) |
| $500,000 to $749,999 | 0 (0.0%) | 65 (25.8%) |
| $750,000 to $999,999 | 47 (55.9%) | 0 (0.0%) |
| $1,000,000 or more | 0 (0.0%) | 0 (0.0%) |
| Total | 84 (100.0%) | 252 (100.0%) |
Household Income by Mortgage Status in Santa Nella
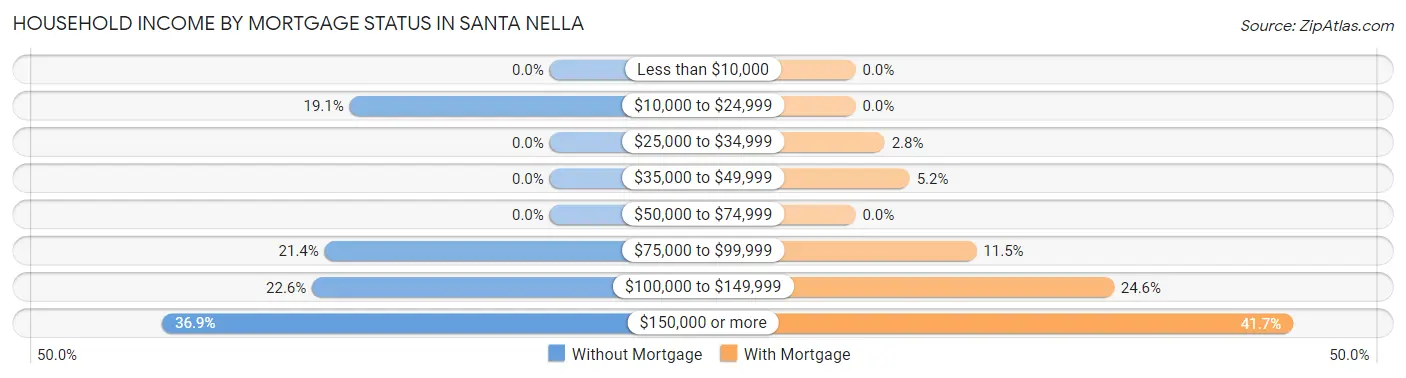
| Household Income | Without Mortgage | With Mortgage |
| Less than $10,000 | 0 (0.0%) | 0 (0.0%) |
| $10,000 to $24,999 | 16 (19.1%) | 0 (0.0%) |
| $25,000 to $34,999 | 0 (0.0%) | 7 (2.8%) |
| $35,000 to $49,999 | 0 (0.0%) | 13 (5.2%) |
| $50,000 to $74,999 | 0 (0.0%) | 0 (0.0%) |
| $75,000 to $99,999 | 18 (21.4%) | 29 (11.5%) |
| $100,000 to $149,999 | 19 (22.6%) | 62 (24.6%) |
| $150,000 or more | 31 (36.9%) | 105 (41.7%) |
| Total | 84 (100.0%) | 252 (100.0%) |
Property Value to Household Income Ratio in Santa Nella
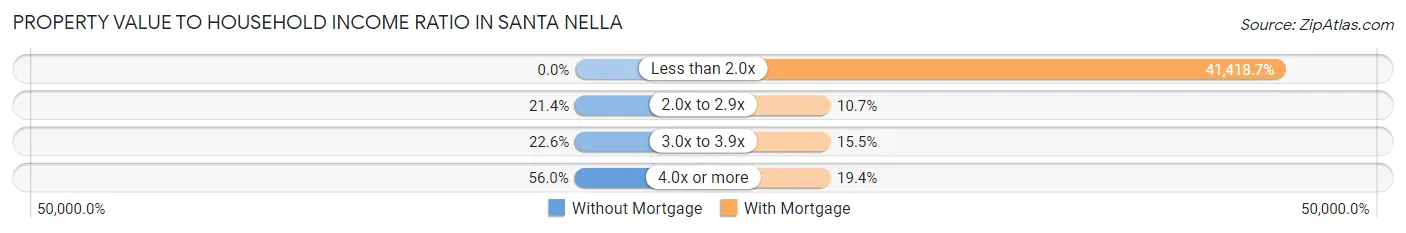
| Value-to-Income Ratio | Without Mortgage | With Mortgage |
| Less than 2.0x | 0 (0.0%) | 104,375 (41,418.7%) |
| 2.0x to 2.9x | 18 (21.4%) | 27 (10.7%) |
| 3.0x to 3.9x | 19 (22.6%) | 39 (15.5%) |
| 4.0x or more | 47 (55.9%) | 49 (19.4%) |
| Total | 84 (100.0%) | 252 (100.0%) |
Real Estate Taxes by Mortgage Status in Santa Nella
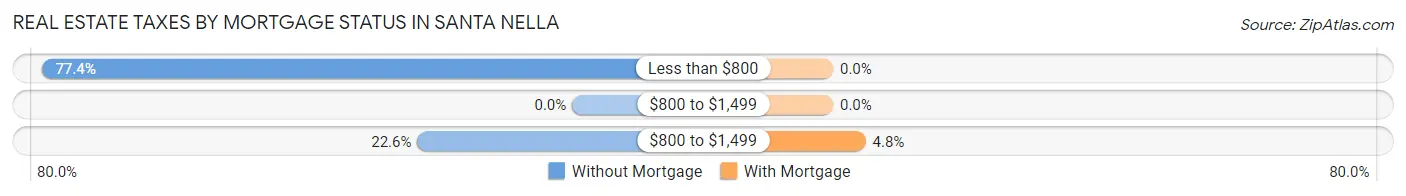
| Property Taxes | Without Mortgage | With Mortgage |
| Less than $800 | 65 (77.4%) | 0 (0.0%) |
| $800 to $1,499 | 0 (0.0%) | 0 (0.0%) |
| $800 to $1,499 | 19 (22.6%) | 12 (4.8%) |
| Total | 84 (100.0%) | 252 (100.0%) |
Health & Disability in Santa Nella
Health Insurance Coverage by Age in Santa Nella
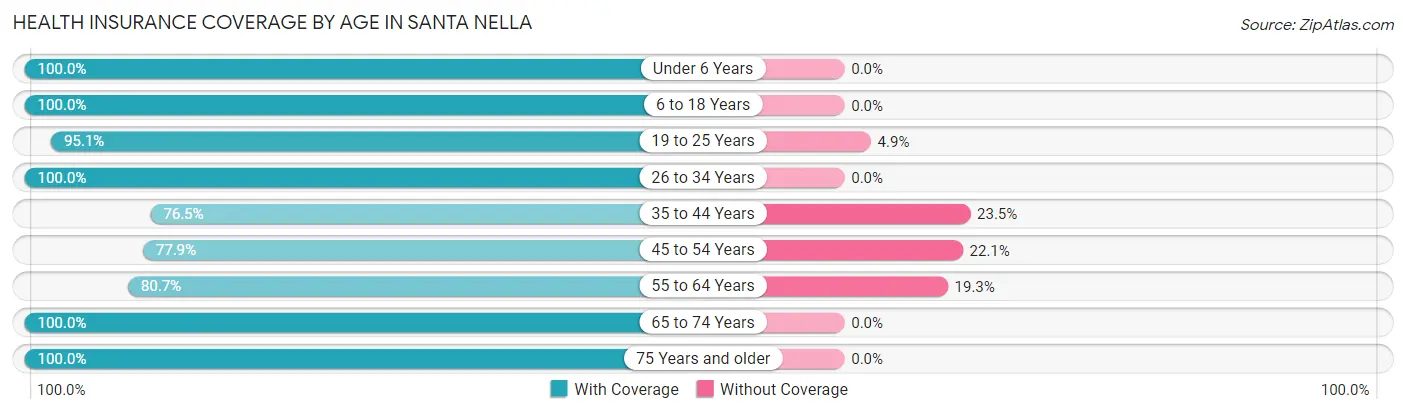
| Age Bracket | With Coverage | Without Coverage |
| Under 6 Years | 215 (100.0%) | 0 (0.0%) |
| 6 to 18 Years | 485 (100.0%) | 0 (0.0%) |
| 19 to 25 Years | 116 (95.1%) | 6 (4.9%) |
| 26 to 34 Years | 309 (100.0%) | 0 (0.0%) |
| 35 to 44 Years | 310 (76.5%) | 95 (23.5%) |
| 45 to 54 Years | 159 (77.9%) | 45 (22.1%) |
| 55 to 64 Years | 155 (80.7%) | 37 (19.3%) |
| 65 to 74 Years | 85 (100.0%) | 0 (0.0%) |
| 75 Years and older | 38 (100.0%) | 0 (0.0%) |
| Total | 1,872 (91.1%) | 183 (8.9%) |
Health Insurance Coverage by Citizenship Status in Santa Nella
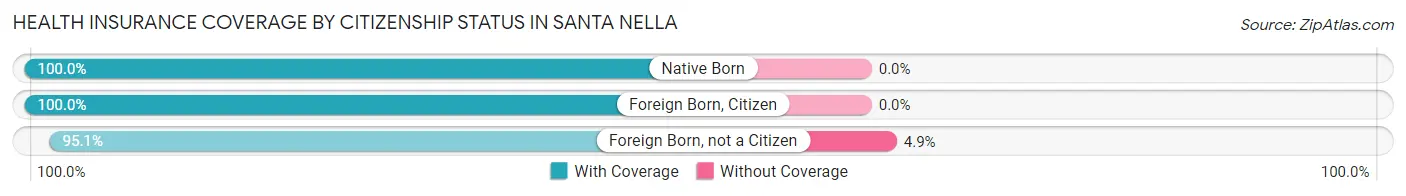
| Citizenship Status | With Coverage | Without Coverage |
| Native Born | 215 (100.0%) | 0 (0.0%) |
| Foreign Born, Citizen | 485 (100.0%) | 0 (0.0%) |
| Foreign Born, not a Citizen | 116 (95.1%) | 6 (4.9%) |
Health Insurance Coverage by Household Income in Santa Nella
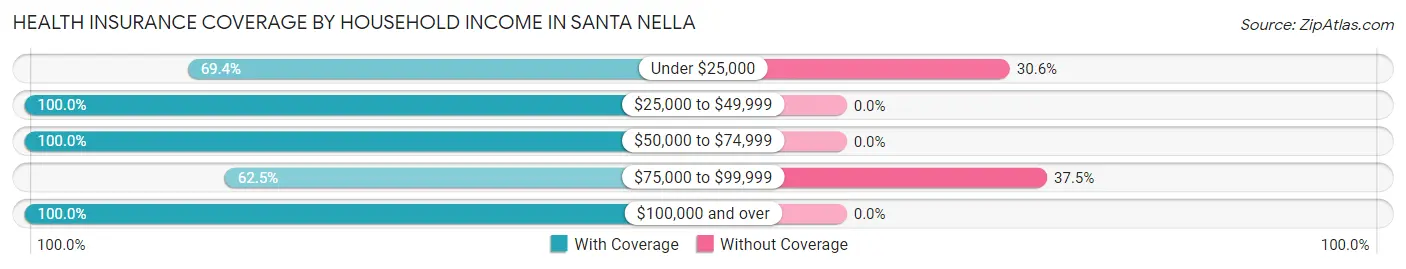
| Household Income | With Coverage | Without Coverage |
| Under $25,000 | 50 (69.4%) | 22 (30.6%) |
| $25,000 to $49,999 | 68 (100.0%) | 0 (0.0%) |
| $50,000 to $74,999 | 631 (100.0%) | 0 (0.0%) |
| $75,000 to $99,999 | 268 (62.5%) | 161 (37.5%) |
| $100,000 and over | 855 (100.0%) | 0 (0.0%) |
Public vs Private Health Insurance Coverage by Age in Santa Nella
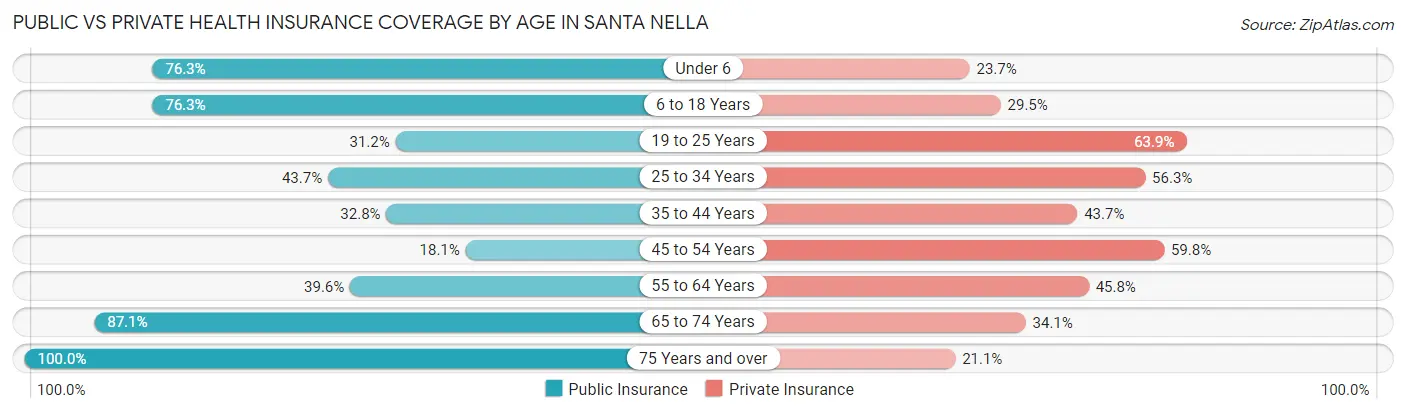
| Age Bracket | Public Insurance | Private Insurance |
| Under 6 | 164 (76.3%) | 51 (23.7%) |
| 6 to 18 Years | 370 (76.3%) | 143 (29.5%) |
| 19 to 25 Years | 38 (31.1%) | 78 (63.9%) |
| 25 to 34 Years | 135 (43.7%) | 174 (56.3%) |
| 35 to 44 Years | 133 (32.8%) | 177 (43.7%) |
| 45 to 54 Years | 37 (18.1%) | 122 (59.8%) |
| 55 to 64 Years | 76 (39.6%) | 88 (45.8%) |
| 65 to 74 Years | 74 (87.1%) | 29 (34.1%) |
| 75 Years and over | 38 (100.0%) | 8 (21.0%) |
| Total | 1,065 (51.8%) | 870 (42.3%) |
Disability Status by Sex by Age in Santa Nella
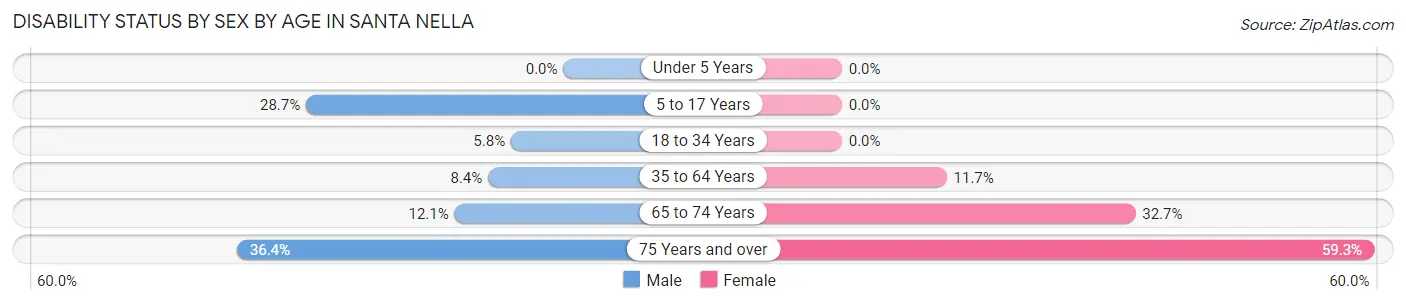
| Age Bracket | Male | Female |
| Under 5 Years | 0 (0.0%) | 0 (0.0%) |
| 5 to 17 Years | 92 (28.7%) | 0 (0.0%) |
| 18 to 34 Years | 12 (5.8%) | 0 (0.0%) |
| 35 to 64 Years | 42 (8.4%) | 35 (11.7%) |
| 65 to 74 Years | 4 (12.1%) | 17 (32.7%) |
| 75 Years and over | 4 (36.4%) | 16 (59.3%) |
Disability Class by Sex by Age in Santa Nella
Disability Class: Hearing Difficulty
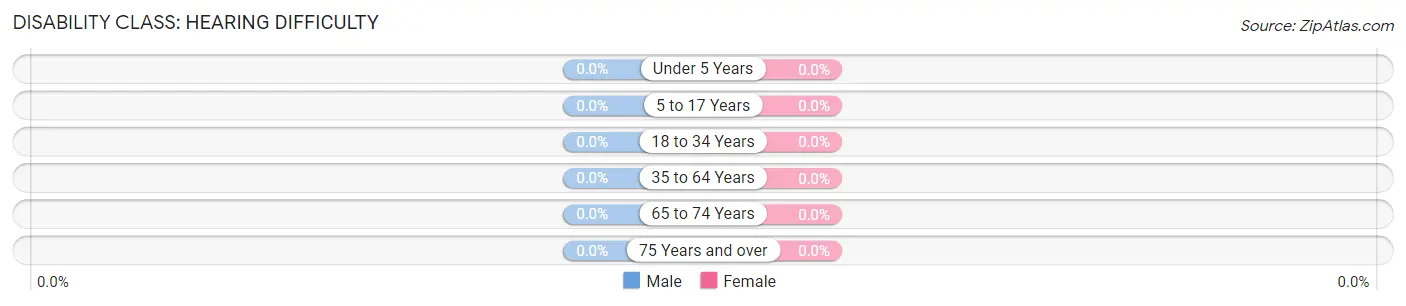
| Age Bracket | Male | Female |
| Under 5 Years | 0 (0.0%) | 0 (0.0%) |
| 5 to 17 Years | 0 (0.0%) | 0 (0.0%) |
| 18 to 34 Years | 0 (0.0%) | 0 (0.0%) |
| 35 to 64 Years | 0 (0.0%) | 0 (0.0%) |
| 65 to 74 Years | 0 (0.0%) | 0 (0.0%) |
| 75 Years and over | 0 (0.0%) | 0 (0.0%) |
Disability Class: Vision Difficulty
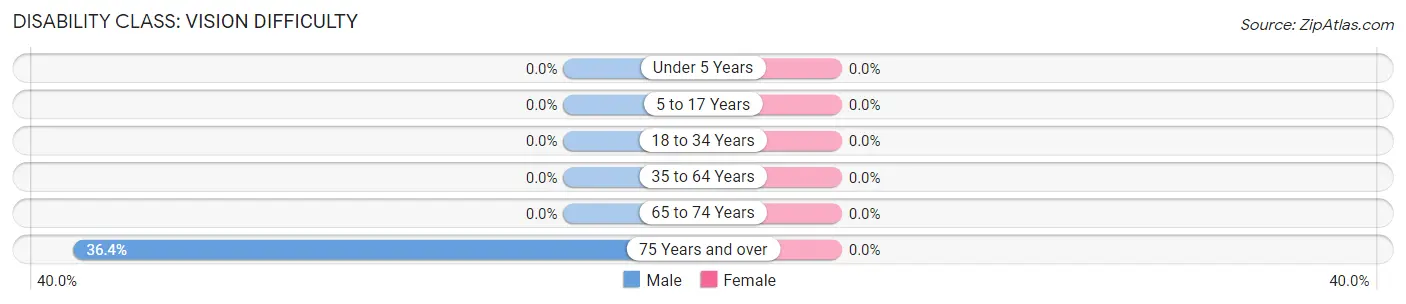
| Age Bracket | Male | Female |
| Under 5 Years | 0 (0.0%) | 0 (0.0%) |
| 5 to 17 Years | 0 (0.0%) | 0 (0.0%) |
| 18 to 34 Years | 0 (0.0%) | 0 (0.0%) |
| 35 to 64 Years | 0 (0.0%) | 0 (0.0%) |
| 65 to 74 Years | 0 (0.0%) | 0 (0.0%) |
| 75 Years and over | 4 (36.4%) | 0 (0.0%) |
Disability Class: Cognitive Difficulty
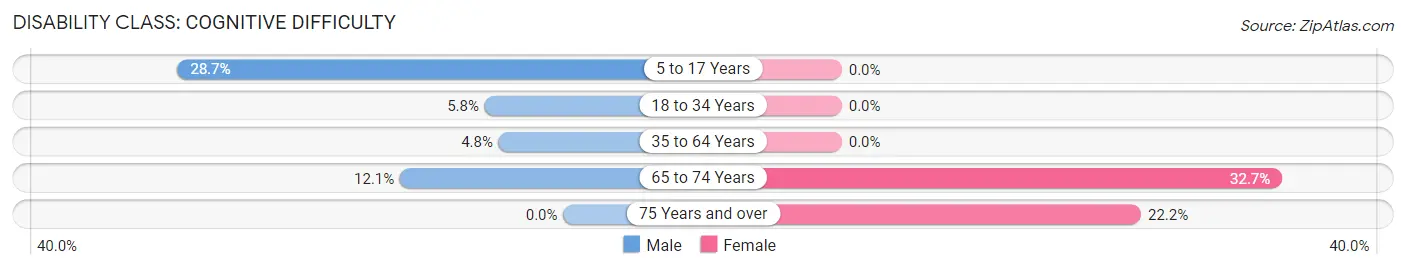
| Age Bracket | Male | Female |
| 5 to 17 Years | 92 (28.7%) | 0 (0.0%) |
| 18 to 34 Years | 12 (5.8%) | 0 (0.0%) |
| 35 to 64 Years | 24 (4.8%) | 0 (0.0%) |
| 65 to 74 Years | 4 (12.1%) | 17 (32.7%) |
| 75 Years and over | 0 (0.0%) | 6 (22.2%) |
Disability Class: Ambulatory Difficulty
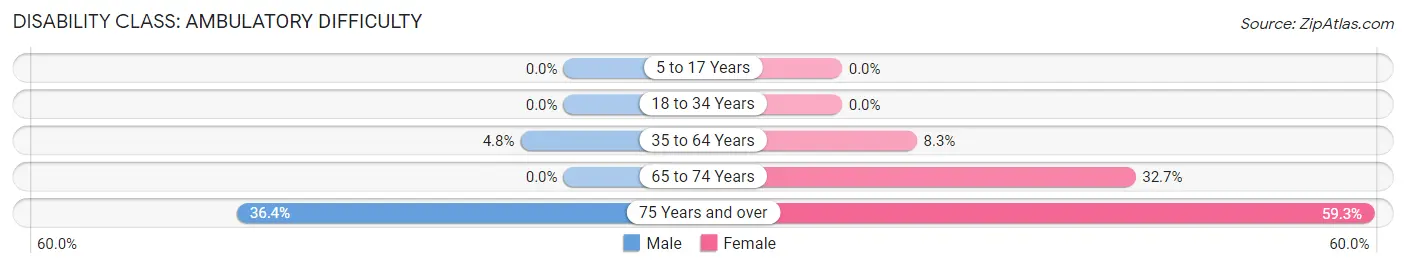
| Age Bracket | Male | Female |
| 5 to 17 Years | 0 (0.0%) | 0 (0.0%) |
| 18 to 34 Years | 0 (0.0%) | 0 (0.0%) |
| 35 to 64 Years | 24 (4.8%) | 25 (8.3%) |
| 65 to 74 Years | 0 (0.0%) | 17 (32.7%) |
| 75 Years and over | 4 (36.4%) | 16 (59.3%) |
Disability Class: Self-Care Difficulty
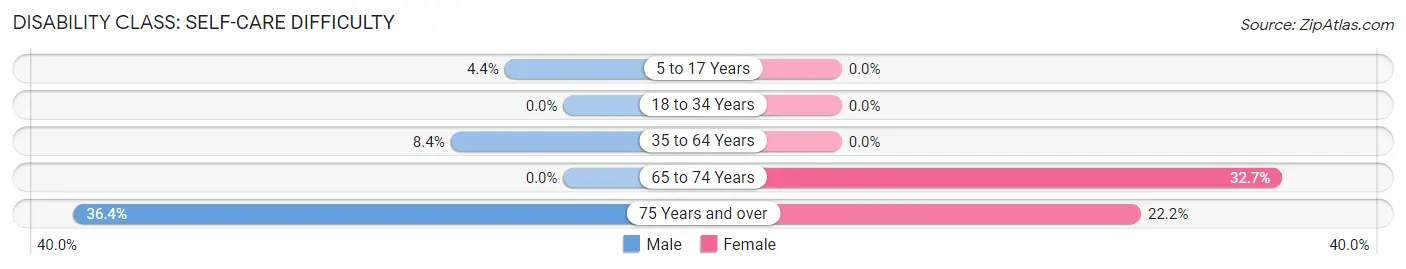
| Age Bracket | Male | Female |
| 5 to 17 Years | 14 (4.4%) | 0 (0.0%) |
| 18 to 34 Years | 0 (0.0%) | 0 (0.0%) |
| 35 to 64 Years | 42 (8.4%) | 0 (0.0%) |
| 65 to 74 Years | 0 (0.0%) | 17 (32.7%) |
| 75 Years and over | 4 (36.4%) | 6 (22.2%) |
Technology Access in Santa Nella
Computing Device Access in Santa Nella
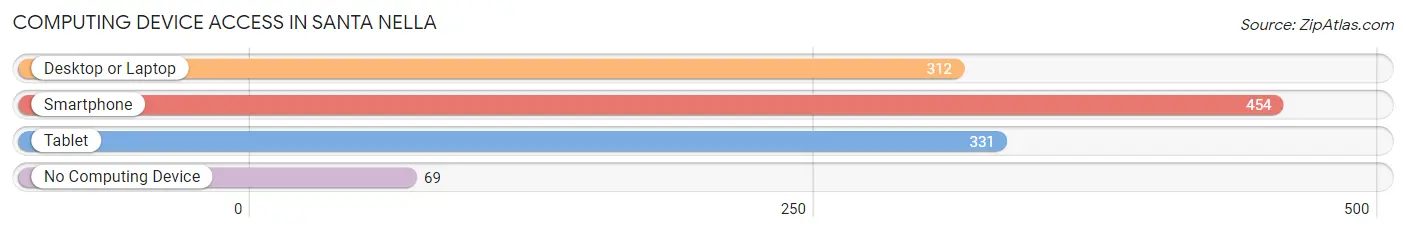
| Device Type | # Households | % Households |
| Desktop or Laptop | 312 | 58.9% |
| Smartphone | 454 | 85.7% |
| Tablet | 331 | 62.5% |
| No Computing Device | 69 | 13.0% |
| Total | 530 | 100.0% |
Internet Access in Santa Nella
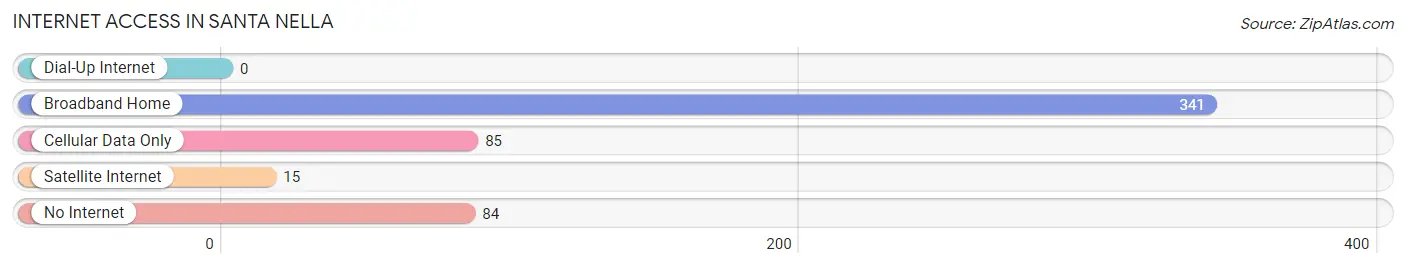
| Internet Type | # Households | % Households |
| Dial-Up Internet | 0 | 0.0% |
| Broadband Home | 341 | 64.3% |
| Cellular Data Only | 85 | 16.0% |
| Satellite Internet | 15 | 2.8% |
| No Internet | 84 | 15.9% |
| Total | 530 | 100.0% |
Santa Nella Summary
Santa Nella, California is a small unincorporated community located in Merced County, California. It is situated along the San Joaquin Valley, approximately halfway between Los Angeles and San Francisco. The population of Santa Nella was estimated to be 1,845 in 2019.
History
Santa Nella was founded in 1868 by a group of settlers from the nearby town of Los Banos. The settlers named the town after the nearby Santa Nella Creek, which was named after a local Native American chief. The town was originally a farming community, and the main crops grown were wheat, barley, and oats.
In the early 1900s, the town began to grow as a result of the construction of the Southern Pacific Railroad. The railroad provided a convenient way for farmers to transport their crops to nearby cities. The town also became a popular stop for travelers, as it was located along the main route between Los Angeles and San Francisco.
In the 1950s, the town began to experience a population boom as a result of the construction of the nearby San Luis Reservoir. The reservoir provided a reliable source of water for the town, and it also attracted new businesses and industries.
Geography
Santa Nella is located in the San Joaquin Valley, approximately halfway between Los Angeles and San Francisco. The town is situated along the Santa Nella Creek, which is a tributary of the San Joaquin River. The town is surrounded by rolling hills and farmland, and it is located near the San Luis Reservoir.
The climate in Santa Nella is generally mild, with temperatures ranging from the mid-50s to the mid-90s throughout the year. The town receives an average of 10 inches of rain per year, and it is located in a semi-arid climate zone.
Economy
The economy of Santa Nella is largely based on agriculture. The town is home to several large farms, and the main crops grown are wheat, barley, and oats. The town is also home to several food processing plants, which process the crops grown in the area.
In addition to agriculture, Santa Nella is home to several small businesses, including restaurants, shops, and other services. The town is also home to a few light manufacturing companies, which produce a variety of products.
Demographics
As of 2019, the population of Santa Nella was estimated to be 1,845. The town is predominantly Hispanic, with approximately 75% of the population identifying as Hispanic or Latino. The median household income in Santa Nella is $45,000, and the median home value is $250,000. The town has a poverty rate of 16%, which is slightly higher than the national average.
Common Questions
What is Per Capita Income in Santa Nella?
Per Capita income in Santa Nella is $25,125.
What is the Median Family Income in Santa Nella?
Median Family Income in Santa Nella is $84,667.
What is the Median Household income in Santa Nella?
Median Household Income in Santa Nella is $84,912.
What is Inequality or Gini Index in Santa Nella?
Inequality or Gini Index in Santa Nella is 0.30.
What is the Total Population of Santa Nella?
Total Population of Santa Nella is 2,055.
What is the Total Male Population of Santa Nella?
Total Male Population of Santa Nella is 1,171.
What is the Total Female Population of Santa Nella?
Total Female Population of Santa Nella is 884.
What is the Ratio of Males per 100 Females in Santa Nella?
There are 132.47 Males per 100 Females in Santa Nella.
What is the Ratio of Females per 100 Males in Santa Nella?
There are 75.49 Females per 100 Males in Santa Nella.
What is the Median Population Age in Santa Nella?
Median Population Age in Santa Nella is 33.1 Years.
What is the Average Family Size in Santa Nella
Average Family Size in Santa Nella is 4.6 People.
What is the Average Household Size in Santa Nella
Average Household Size in Santa Nella is 3.9 People.
How Large is the Labor Force in Santa Nella?
There are 962 People in the Labor Forcein in Santa Nella.
What is the Percentage of People in the Labor Force in Santa Nella?
65.6% of People are in the Labor Force in Santa Nella.
What is the Unemployment Rate in Santa Nella?
Unemployment Rate in Santa Nella is 12.3%.