Cities with the Largest Salvadoran Community in California
RELATED REPORTS & OPTIONS
Salvadoran
California
Compare Cities
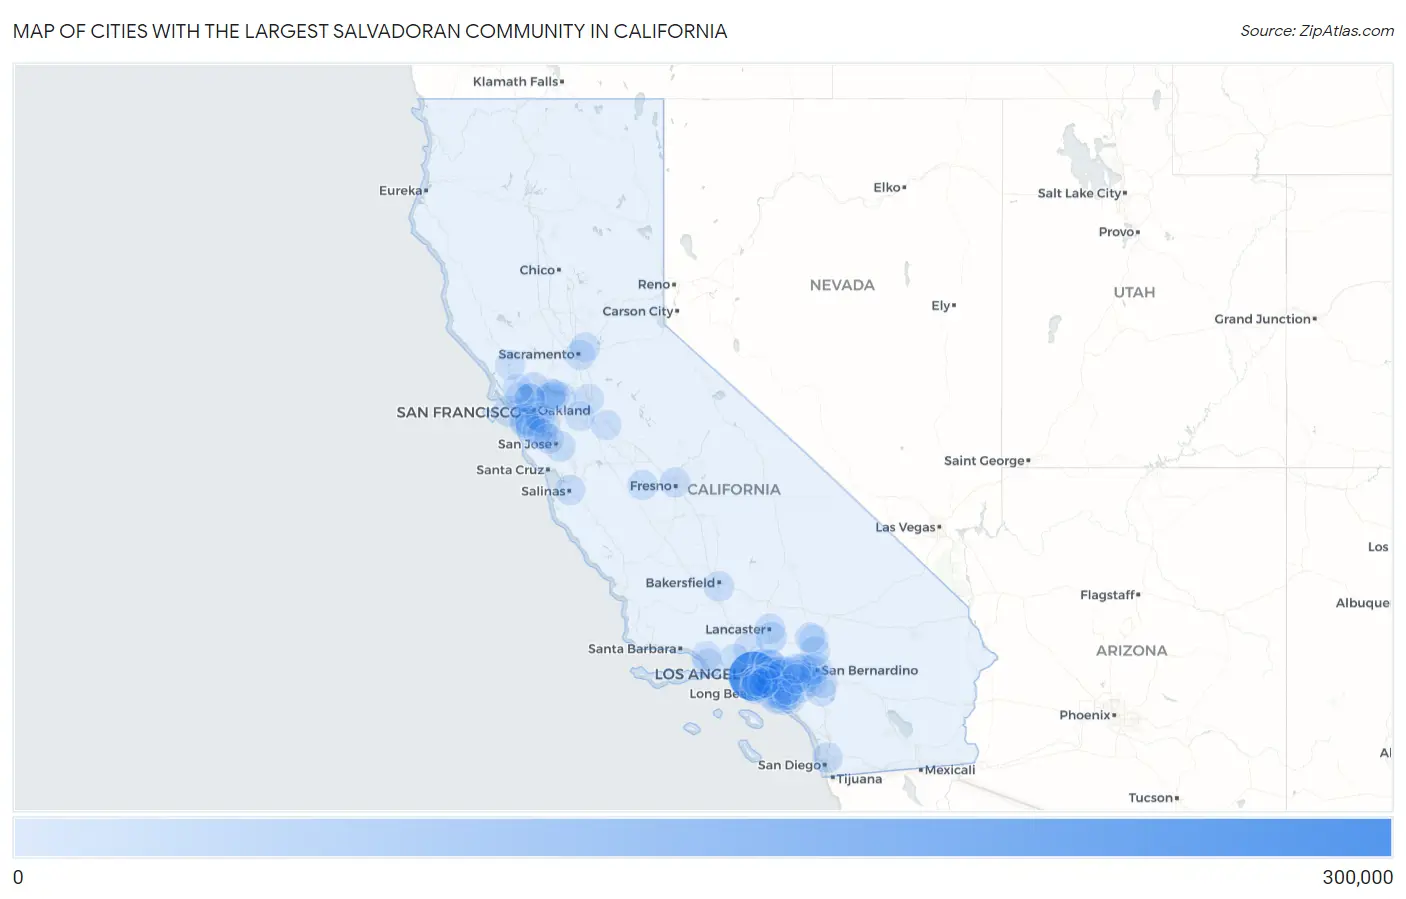
Map of Cities with the Largest Salvadoran Community in California
0
300,000
Cities with the Largest Salvadoran Community in California
| City | Salvadoran | vs State | vs National | |
| 1. | Los Angeles | 267,160 | 750,864(35.58%)#1 | 2,389,469(11.18%)#1 |
| 2. | San Francisco | 16,448 | 750,864(2.19%)#2 | 2,389,469(0.69%)#8 |
| 3. | Palmdale | 13,552 | 750,864(1.80%)#3 | 2,389,469(0.57%)#10 |
| 4. | San Jose | 10,205 | 750,864(1.36%)#4 | 2,389,469(0.43%)#19 |
| 5. | Richmond | 8,582 | 750,864(1.14%)#5 | 2,389,469(0.36%)#21 |
| 6. | Long Beach | 8,008 | 750,864(1.07%)#6 | 2,389,469(0.34%)#23 |
| 7. | Oakland | 7,816 | 750,864(1.04%)#7 | 2,389,469(0.33%)#24 |
| 8. | Lancaster | 6,592 | 750,864(0.88%)#8 | 2,389,469(0.28%)#33 |
| 9. | Santa Ana | 6,346 | 750,864(0.85%)#9 | 2,389,469(0.27%)#36 |
| 10. | Bakersfield | 6,164 | 750,864(0.82%)#10 | 2,389,469(0.26%)#41 |
| 11. | Daly City | 5,910 | 750,864(0.79%)#11 | 2,389,469(0.25%)#48 |
| 12. | Anaheim | 5,739 | 750,864(0.76%)#12 | 2,389,469(0.24%)#50 |
| 13. | Florence Graham | 5,711 | 750,864(0.76%)#13 | 2,389,469(0.24%)#51 |
| 14. | Fontana | 5,614 | 750,864(0.75%)#14 | 2,389,469(0.23%)#52 |
| 15. | South Gate | 5,573 | 750,864(0.74%)#15 | 2,389,469(0.23%)#54 |
| 16. | Santa Clarita | 5,181 | 750,864(0.69%)#16 | 2,389,469(0.22%)#62 |
| 17. | Hayward | 4,981 | 750,864(0.66%)#17 | 2,389,469(0.21%)#65 |
| 18. | Inglewood | 4,969 | 750,864(0.66%)#18 | 2,389,469(0.21%)#66 |
| 19. | San Bernardino | 4,968 | 750,864(0.66%)#19 | 2,389,469(0.21%)#67 |
| 20. | Riverside | 4,866 | 750,864(0.65%)#20 | 2,389,469(0.20%)#71 |
| 21. | Mendota | 4,717 | 750,864(0.63%)#21 | 2,389,469(0.20%)#72 |
| 22. | Huntington Park | 4,375 | 750,864(0.58%)#22 | 2,389,469(0.18%)#79 |
| 23. | Lynwood | 4,362 | 750,864(0.58%)#23 | 2,389,469(0.18%)#80 |
| 24. | Sacramento | 4,290 | 750,864(0.57%)#24 | 2,389,469(0.18%)#84 |
| 25. | San Diego | 4,242 | 750,864(0.56%)#25 | 2,389,469(0.18%)#86 |
| 26. | Vallejo | 4,242 | 750,864(0.56%)#26 | 2,389,469(0.18%)#87 |
| 27. | Pomona | 4,159 | 750,864(0.55%)#27 | 2,389,469(0.17%)#92 |
| 28. | Moreno Valley | 4,109 | 750,864(0.55%)#28 | 2,389,469(0.17%)#94 |
| 29. | Westmont | 4,003 | 750,864(0.53%)#29 | 2,389,469(0.17%)#95 |
| 30. | Salinas | 3,983 | 750,864(0.53%)#30 | 2,389,469(0.17%)#98 |
| 31. | East Los Angeles | 3,982 | 750,864(0.53%)#31 | 2,389,469(0.17%)#99 |
| 32. | Glendale | 3,885 | 750,864(0.52%)#32 | 2,389,469(0.16%)#102 |
| 33. | Downey | 3,885 | 750,864(0.52%)#33 | 2,389,469(0.16%)#103 |
| 34. | Compton | 3,811 | 750,864(0.51%)#34 | 2,389,469(0.16%)#105 |
| 35. | Ontario | 3,805 | 750,864(0.51%)#35 | 2,389,469(0.16%)#106 |
| 36. | Pasadena | 3,745 | 750,864(0.50%)#36 | 2,389,469(0.16%)#107 |
| 37. | Fresno | 3,598 | 750,864(0.48%)#37 | 2,389,469(0.15%)#109 |
| 38. | Concord | 3,516 | 750,864(0.47%)#38 | 2,389,469(0.15%)#111 |
| 39. | Victorville | 3,284 | 750,864(0.44%)#39 | 2,389,469(0.14%)#120 |
| 40. | Antioch | 3,255 | 750,864(0.43%)#40 | 2,389,469(0.14%)#122 |
| 41. | South San Francisco | 3,195 | 750,864(0.43%)#41 | 2,389,469(0.13%)#123 |
| 42. | Norwalk | 3,167 | 750,864(0.42%)#42 | 2,389,469(0.13%)#125 |
| 43. | Hawthorne | 3,111 | 750,864(0.41%)#43 | 2,389,469(0.13%)#127 |
| 44. | Bell Gardens | 3,062 | 750,864(0.41%)#44 | 2,389,469(0.13%)#129 |
| 45. | San Mateo | 2,947 | 750,864(0.39%)#45 | 2,389,469(0.12%)#133 |
| 46. | Rialto | 2,899 | 750,864(0.39%)#46 | 2,389,469(0.12%)#134 |
| 47. | Costa Mesa | 2,786 | 750,864(0.37%)#47 | 2,389,469(0.12%)#139 |
| 48. | El Monte | 2,694 | 750,864(0.36%)#48 | 2,389,469(0.11%)#142 |
| 49. | San Bruno | 2,660 | 750,864(0.35%)#49 | 2,389,469(0.11%)#145 |
| 50. | West Covina | 2,648 | 750,864(0.35%)#50 | 2,389,469(0.11%)#146 |
| 51. | Montebello | 2,618 | 750,864(0.35%)#51 | 2,389,469(0.11%)#148 |
| 52. | Baldwin Park | 2,589 | 750,864(0.34%)#52 | 2,389,469(0.11%)#151 |
| 53. | Irvine | 2,587 | 750,864(0.34%)#53 | 2,389,469(0.11%)#152 |
| 54. | Stockton | 2,540 | 750,864(0.34%)#54 | 2,389,469(0.11%)#153 |
| 55. | Whittier | 2,498 | 750,864(0.33%)#55 | 2,389,469(0.10%)#155 |
| 56. | Bell | 2,442 | 750,864(0.33%)#56 | 2,389,469(0.10%)#158 |
| 57. | Fullerton | 2,381 | 750,864(0.32%)#57 | 2,389,469(0.10%)#161 |
| 58. | Redwood City | 2,273 | 750,864(0.30%)#58 | 2,389,469(0.10%)#167 |
| 59. | Pittsburg | 2,270 | 750,864(0.30%)#59 | 2,389,469(0.10%)#168 |
| 60. | Maywood | 2,270 | 750,864(0.30%)#60 | 2,389,469(0.10%)#169 |
| 61. | Gardena | 2,225 | 750,864(0.30%)#61 | 2,389,469(0.09%)#172 |
| 62. | Corona | 2,224 | 750,864(0.30%)#62 | 2,389,469(0.09%)#173 |
| 63. | Rancho Cucamonga | 2,210 | 750,864(0.29%)#63 | 2,389,469(0.09%)#175 |
| 64. | Pico Rivera | 2,162 | 750,864(0.29%)#64 | 2,389,469(0.09%)#177 |
| 65. | Paramount | 2,148 | 750,864(0.29%)#65 | 2,389,469(0.09%)#178 |
| 66. | Santa Rosa | 2,128 | 750,864(0.28%)#66 | 2,389,469(0.09%)#179 |
| 67. | Oxnard | 2,022 | 750,864(0.27%)#67 | 2,389,469(0.08%)#189 |
| 68. | Cudahy | 2,017 | 750,864(0.27%)#68 | 2,389,469(0.08%)#190 |
| 69. | San Pablo | 2,004 | 750,864(0.27%)#69 | 2,389,469(0.08%)#194 |
| 70. | Lawndale | 1,990 | 750,864(0.27%)#70 | 2,389,469(0.08%)#195 |
| 71. | San Leandro | 1,924 | 750,864(0.26%)#71 | 2,389,469(0.08%)#199 |
| 72. | Bellflower | 1,903 | 750,864(0.25%)#72 | 2,389,469(0.08%)#201 |
| 73. | Simi Valley | 1,896 | 750,864(0.25%)#73 | 2,389,469(0.08%)#202 |
| 74. | Alhambra | 1,862 | 750,864(0.25%)#74 | 2,389,469(0.08%)#205 |
| 75. | La Puente | 1,832 | 750,864(0.24%)#75 | 2,389,469(0.08%)#210 |
| 76. | Jurupa Valley | 1,819 | 750,864(0.24%)#76 | 2,389,469(0.08%)#211 |
| 77. | East Palo Alto | 1,784 | 750,864(0.24%)#77 | 2,389,469(0.07%)#214 |
| 78. | Modesto | 1,761 | 750,864(0.23%)#78 | 2,389,469(0.07%)#216 |
| 79. | Garden Grove | 1,713 | 750,864(0.23%)#79 | 2,389,469(0.07%)#228 |
| 80. | Perris | 1,650 | 750,864(0.22%)#80 | 2,389,469(0.07%)#234 |
| 81. | Tracy | 1,649 | 750,864(0.22%)#81 | 2,389,469(0.07%)#235 |
| 82. | Covina | 1,638 | 750,864(0.22%)#82 | 2,389,469(0.07%)#236 |
| 83. | Huntington Beach | 1,599 | 750,864(0.21%)#83 | 2,389,469(0.07%)#241 |
| 84. | Tustin | 1,534 | 750,864(0.20%)#84 | 2,389,469(0.06%)#248 |
| 85. | Orange | 1,524 | 750,864(0.20%)#85 | 2,389,469(0.06%)#249 |
| 86. | Hesperia | 1,478 | 750,864(0.20%)#86 | 2,389,469(0.06%)#253 |
| 87. | Torrance | 1,454 | 750,864(0.19%)#87 | 2,389,469(0.06%)#258 |
| 88. | West Rancho Dominguez | 1,422 | 750,864(0.19%)#88 | 2,389,469(0.06%)#262 |
| 89. | Sunnyvale | 1,388 | 750,864(0.18%)#89 | 2,389,469(0.06%)#267 |
| 90. | Adelanto | 1,373 | 750,864(0.18%)#90 | 2,389,469(0.06%)#272 |
| 91. | Altadena | 1,333 | 750,864(0.18%)#91 | 2,389,469(0.06%)#277 |
| 92. | Bay Point | 1,314 | 750,864(0.17%)#92 | 2,389,469(0.05%)#280 |
| 93. | San Rafael | 1,305 | 750,864(0.17%)#93 | 2,389,469(0.05%)#281 |
| 94. | North Highlands | 1,299 | 750,864(0.17%)#94 | 2,389,469(0.05%)#282 |
| 95. | Novato | 1,283 | 750,864(0.17%)#95 | 2,389,469(0.05%)#286 |
| 96. | Upland | 1,272 | 750,864(0.17%)#96 | 2,389,469(0.05%)#289 |
| 97. | Willowbrook | 1,262 | 750,864(0.17%)#97 | 2,389,469(0.05%)#291 |
| 98. | Lennox | 1,258 | 750,864(0.17%)#98 | 2,389,469(0.05%)#293 |
| 99. | Chino | 1,190 | 750,864(0.16%)#99 | 2,389,469(0.05%)#306 |
| 100. | San Buenaventura Ventura | 1,158 | 750,864(0.15%)#100 | 2,389,469(0.05%)#312 |
Common Questions
What are the Top 10 Cities with the Largest Salvadoran Community in California?
Top 10 Cities with the Largest Salvadoran Community in California are:
#1
267,160
#2
16,448
#3
13,552
#4
10,205
#5
8,582
#6
8,008
#7
7,816
#8
6,592
#9
6,346
#10
6,164
What city has the Largest Salvadoran Community in California?
Los Angeles has the Largest Salvadoran Community in California with 267,160.
What is the Total Salvadoran Population in the State of California?
Total Salvadoran Population in California is 750,864.
What is the Total Salvadoran Population in the United States?
Total Salvadoran Population in the United States is 2,389,469.