Cities with the Highest Percentage of Norwegian Population in California
RELATED REPORTS & OPTIONS
Norwegian
California
Compare Cities
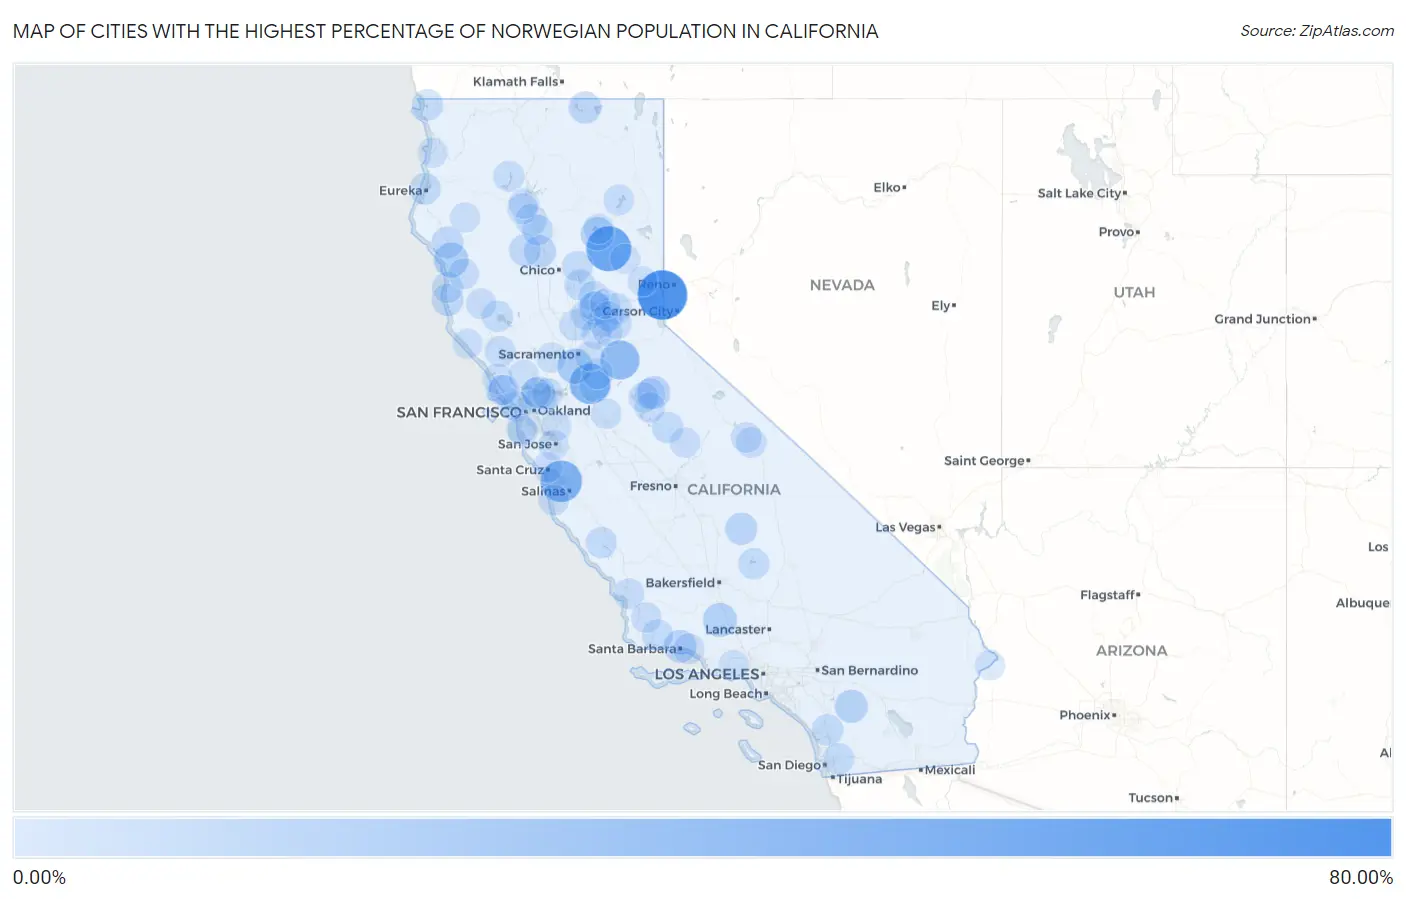
Map of Cities with the Highest Percentage of Norwegian Population in California
0.00%
80.00%
Cities with the Highest Percentage of Norwegian Population in California
| City | Norwegian | vs State | vs National | |
| 1. | Floriston | 73.91% | 0.85%(+73.1)#1 | 1.25%(+72.7)#17 |
| 2. | Keddie | 56.72% | 0.85%(+55.9)#2 | 1.25%(+55.5)#48 |
| 3. | Moss Landing | 44.44% | 0.85%(+43.6)#3 | 1.25%(+43.2)#136 |
| 4. | Acampo | 40.00% | 0.85%(+39.1)#4 | 1.25%(+38.8)#185 |
| 5. | Fiddletown | 35.71% | 0.85%(+34.9)#5 | 1.25%(+34.5)#256 |
| 6. | Clarksburg | 21.85% | 0.85%(+21.0)#6 | 1.25%(+20.6)#678 |
| 7. | Leggett | 19.57% | 0.85%(+18.7)#7 | 1.25%(+18.3)#803 |
| 8. | Bear Valley Cdp Alpine County | 18.06% | 0.85%(+17.2)#8 | 1.25%(+16.8)#905 |
| 9. | Lake Of The Woods | 17.28% | 0.85%(+16.4)#9 | 1.25%(+16.0)#966 |
| 10. | Prattville | 15.38% | 0.85%(+14.5)#10 | 1.25%(+14.1)#1,142 |
| 11. | Ono | 14.81% | 0.85%(+14.0)#11 | 1.25%(+13.6)#1,210 |
| 12. | Anza | 14.45% | 0.85%(+13.6)#12 | 1.25%(+13.2)#1,234 |
| 13. | Mi Wuk Village | 13.66% | 0.85%(+12.8)#13 | 1.25%(+12.4)#1,324 |
| 14. | Penn Valley | 13.05% | 0.85%(+12.2)#14 | 1.25%(+11.8)#1,423 |
| 15. | Mission Canyon | 12.96% | 0.85%(+12.1)#15 | 1.25%(+11.7)#1,436 |
| 16. | La Grange | 11.89% | 0.85%(+11.0)#16 | 1.25%(+10.6)#1,581 |
| 17. | Pierpoint | 11.39% | 0.85%(+10.5)#17 | 1.25%(+10.1)#1,641 |
| 18. | Port Costa | 11.16% | 0.85%(+10.3)#18 | 1.25%(+9.91)#1,689 |
| 19. | Newell | 11.14% | 0.85%(+10.3)#19 | 1.25%(+9.89)#1,692 |
| 20. | Richfield | 10.56% | 0.85%(+9.71)#20 | 1.25%(+9.32)#1,799 |
| 21. | Garberville | 10.30% | 0.85%(+9.45)#21 | 1.25%(+9.06)#1,844 |
| 22. | Mendocino | 10.26% | 0.85%(+9.41)#22 | 1.25%(+9.01)#1,849 |
| 23. | Rancho Tehama Reserve | 10.09% | 0.85%(+9.23)#23 | 1.25%(+8.84)#1,886 |
| 24. | Victor | 9.05% | 0.85%(+8.19)#24 | 1.25%(+7.80)#2,070 |
| 25. | Hidden Meadows | 9.03% | 0.85%(+8.18)#25 | 1.25%(+7.79)#2,073 |
| 26. | Cottonwood | 8.93% | 0.85%(+8.07)#26 | 1.25%(+7.68)#2,092 |
| 27. | Alhambra Valley | 8.83% | 0.85%(+7.98)#27 | 1.25%(+7.59)#2,125 |
| 28. | Samoa | 8.52% | 0.85%(+7.67)#28 | 1.25%(+7.27)#2,182 |
| 29. | Midpines | 8.20% | 0.85%(+7.34)#29 | 1.25%(+6.95)#2,254 |
| 30. | North Lakeport | 8.03% | 0.85%(+7.17)#30 | 1.25%(+6.78)#2,288 |
| 31. | Mountain Mesa | 7.69% | 0.85%(+6.84)#31 | 1.25%(+6.45)#2,363 |
| 32. | Dutch Flat | 7.69% | 0.85%(+6.84)#32 | 1.25%(+6.45)#2,366 |
| 33. | Smith River | 7.66% | 0.85%(+6.80)#33 | 1.25%(+6.41)#2,375 |
| 34. | Granite Hills | 7.65% | 0.85%(+6.79)#34 | 1.25%(+6.40)#2,378 |
| 35. | Bend | 7.25% | 0.85%(+6.39)#35 | 1.25%(+6.00)#2,458 |
| 36. | Lockwood | 7.23% | 0.85%(+6.38)#36 | 1.25%(+5.99)#2,465 |
| 37. | Kelly Ridge | 7.23% | 0.85%(+6.37)#37 | 1.25%(+5.98)#2,468 |
| 38. | Santa Ynez | 7.17% | 0.85%(+6.31)#38 | 1.25%(+5.92)#2,485 |
| 39. | Cleone | 7.11% | 0.85%(+6.25)#39 | 1.25%(+5.86)#2,509 |
| 40. | Stinson Beach | 7.01% | 0.85%(+6.15)#40 | 1.25%(+5.76)#2,544 |
| 41. | Bayview Cdp Humboldt County | 6.80% | 0.85%(+5.95)#41 | 1.25%(+5.56)#2,609 |
| 42. | Trinity Center | 6.80% | 0.85%(+5.95)#42 | 1.25%(+5.55)#2,614 |
| 43. | Clay | 6.78% | 0.85%(+5.93)#43 | 1.25%(+5.53)#2,622 |
| 44. | Rivergrove | 6.76% | 0.85%(+5.90)#44 | 1.25%(+5.51)#2,637 |
| 45. | Toro Canyon | 6.74% | 0.85%(+5.88)#45 | 1.25%(+5.49)#2,640 |
| 46. | Plumas Lake | 6.69% | 0.85%(+5.83)#46 | 1.25%(+5.44)#2,650 |
| 47. | Beale Afb | 6.68% | 0.85%(+5.83)#47 | 1.25%(+5.44)#2,651 |
| 48. | San Miguel Cdp Contra Costa County | 6.49% | 0.85%(+5.64)#48 | 1.25%(+5.25)#2,734 |
| 49. | Healdsburg | 6.33% | 0.85%(+5.48)#49 | 1.25%(+5.09)#2,802 |
| 50. | Foresthill | 6.28% | 0.85%(+5.43)#50 | 1.25%(+5.04)#2,818 |
| 51. | Clyde | 6.24% | 0.85%(+5.39)#51 | 1.25%(+5.00)#2,836 |
| 52. | Edna | 6.20% | 0.85%(+5.34)#52 | 1.25%(+4.95)#2,852 |
| 53. | Laytonville | 6.16% | 0.85%(+5.31)#53 | 1.25%(+4.91)#2,864 |
| 54. | Carmel By The Sea | 6.11% | 0.85%(+5.26)#54 | 1.25%(+4.87)#2,875 |
| 55. | Lake Of The Pines | 6.06% | 0.85%(+5.21)#55 | 1.25%(+4.81)#2,890 |
| 56. | Spaulding | 6.01% | 0.85%(+5.15)#56 | 1.25%(+4.76)#2,912 |
| 57. | Dobbins | 5.95% | 0.85%(+5.10)#57 | 1.25%(+4.71)#2,933 |
| 58. | Twain Harte | 5.90% | 0.85%(+5.04)#58 | 1.25%(+4.65)#2,953 |
| 59. | Centerville | 5.85% | 0.85%(+5.00)#59 | 1.25%(+4.61)#2,970 |
| 60. | West Bishop | 5.84% | 0.85%(+4.99)#60 | 1.25%(+4.60)#2,975 |
| 61. | Concow | 5.74% | 0.85%(+4.88)#61 | 1.25%(+4.49)#3,019 |
| 62. | Mesa | 5.61% | 0.85%(+4.76)#62 | 1.25%(+4.37)#3,062 |
| 63. | Groveland | 5.41% | 0.85%(+4.56)#63 | 1.25%(+4.17)#3,137 |
| 64. | Ridgecrest Heights | 5.40% | 0.85%(+4.54)#64 | 1.25%(+4.15)#3,147 |
| 65. | Redwood Valley | 5.36% | 0.85%(+4.51)#65 | 1.25%(+4.12)#3,165 |
| 66. | Lake Wildwood | 5.19% | 0.85%(+4.33)#66 | 1.25%(+3.94)#3,240 |
| 67. | Sisquoc | 5.16% | 0.85%(+4.31)#67 | 1.25%(+3.92)#3,255 |
| 68. | Muir Beach | 5.16% | 0.85%(+4.31)#68 | 1.25%(+3.91)#3,256 |
| 69. | East Sonora | 5.11% | 0.85%(+4.25)#69 | 1.25%(+3.86)#3,285 |
| 70. | Oakhurst | 5.10% | 0.85%(+4.24)#70 | 1.25%(+3.85)#3,288 |
| 71. | Pasatiempo | 5.06% | 0.85%(+4.21)#71 | 1.25%(+3.82)#3,305 |
| 72. | Tomales | 5.06% | 0.85%(+4.20)#72 | 1.25%(+3.81)#3,311 |
| 73. | Inverness | 5.04% | 0.85%(+4.18)#73 | 1.25%(+3.79)#3,320 |
| 74. | Del Rio | 4.89% | 0.85%(+4.03)#74 | 1.25%(+3.64)#3,387 |
| 75. | Penryn | 4.77% | 0.85%(+3.91)#75 | 1.25%(+3.52)#3,448 |
| 76. | Colfax | 4.75% | 0.85%(+3.90)#76 | 1.25%(+3.51)#3,459 |
| 77. | Sonoma | 4.54% | 0.85%(+3.69)#77 | 1.25%(+3.30)#3,562 |
| 78. | Sea Ranch | 4.49% | 0.85%(+3.64)#78 | 1.25%(+3.25)#3,592 |
| 79. | Winters | 4.46% | 0.85%(+3.60)#79 | 1.25%(+3.21)#3,609 |
| 80. | Lake Almanor Peninsula | 4.39% | 0.85%(+3.53)#80 | 1.25%(+3.14)#3,661 |
| 81. | Happy Valley | 4.37% | 0.85%(+3.52)#81 | 1.25%(+3.13)#3,672 |
| 82. | Fruitdale | 4.35% | 0.85%(+3.49)#82 | 1.25%(+3.10)#3,697 |
| 83. | Keswick | 4.35% | 0.85%(+3.49)#83 | 1.25%(+3.10)#3,701 |
| 84. | Auburn Lake Trails | 4.34% | 0.85%(+3.49)#84 | 1.25%(+3.10)#3,708 |
| 85. | Crockett | 4.31% | 0.85%(+3.45)#85 | 1.25%(+3.06)#3,727 |
| 86. | Cold Springs Cdp El Dorado County | 4.25% | 0.85%(+3.39)#86 | 1.25%(+3.00)#3,770 |
| 87. | Jones Valley | 4.23% | 0.85%(+3.38)#87 | 1.25%(+2.99)#3,782 |
| 88. | Orick | 4.22% | 0.85%(+3.37)#88 | 1.25%(+2.98)#3,791 |
| 89. | Igo | 4.21% | 0.85%(+3.36)#89 | 1.25%(+2.97)#3,800 |
| 90. | Bluewater | 4.19% | 0.85%(+3.34)#90 | 1.25%(+2.95)#3,812 |
| 91. | Point Reyes Station | 4.18% | 0.85%(+3.32)#91 | 1.25%(+2.93)#3,818 |
| 92. | Oak Park | 4.12% | 0.85%(+3.27)#92 | 1.25%(+2.88)#3,855 |
| 93. | Nevada City | 4.11% | 0.85%(+3.25)#93 | 1.25%(+2.86)#3,869 |
| 94. | Montara | 4.08% | 0.85%(+3.22)#94 | 1.25%(+2.83)#3,891 |
| 95. | Mad River | 4.04% | 0.85%(+3.18)#95 | 1.25%(+2.79)#3,907 |
| 96. | Sunol | 4.02% | 0.85%(+3.17)#96 | 1.25%(+2.78)#3,919 |
| 97. | Mather | 4.01% | 0.85%(+3.16)#97 | 1.25%(+2.77)#3,931 |
| 98. | Cromberg | 3.99% | 0.85%(+3.14)#98 | 1.25%(+2.74)#3,949 |
| 99. | El Granada | 3.98% | 0.85%(+3.13)#99 | 1.25%(+2.74)#3,953 |
| 100. | Sierraville | 3.96% | 0.85%(+3.11)#100 | 1.25%(+2.72)#3,966 |
Common Questions
What are the Top 10 Cities with the Highest Percentage of Norwegian Population in California?
Top 10 Cities with the Highest Percentage of Norwegian Population in California are:
#1
73.91%
#2
56.72%
#3
44.44%
#4
40.00%
#5
35.71%
#6
21.85%
#7
19.57%
#8
17.28%
#9
15.38%
#10
14.45%
What city has the Highest Percentage of Norwegian Population in California?
Floriston has the Highest Percentage of Norwegian Population in California with 73.91%.
What is the Percentage of Norwegian Population in the State of California?
Percentage of Norwegian Population in California is 0.85%.
What is the Percentage of Norwegian Population in the United States?
Percentage of Norwegian Population in the United States is 1.25%.