Cities with the Highest Percentage of Guatemalan Population in California
RELATED REPORTS & OPTIONS
Guatemalan
California
Compare Cities
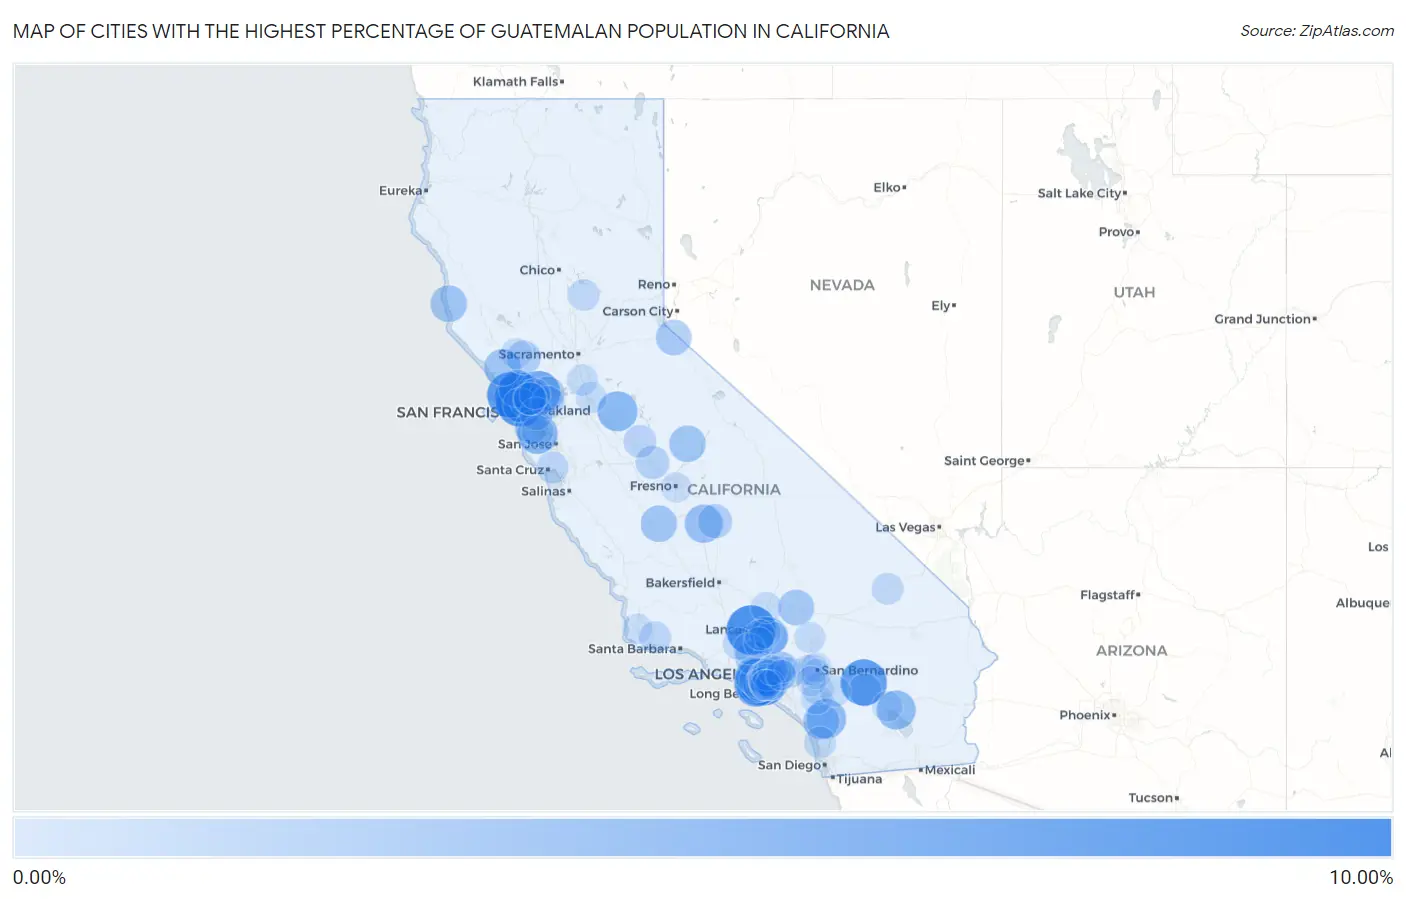
Map of Cities with the Highest Percentage of Guatemalan Population in California
0.00%
10.00%
Cities with the Highest Percentage of Guatemalan Population in California
| City | Guatemalan | vs State | vs National | |
| 1. | San Rafael | 9.92% | 1.19%(+8.73)#1 | 0.50%(+9.42)#134 |
| 2. | Lake Hughes | 9.92% | 1.19%(+8.73)#2 | 0.50%(+9.42)#135 |
| 3. | Alto | 9.26% | 1.19%(+8.07)#3 | 0.50%(+8.75)#145 |
| 4. | Garnet | 8.54% | 1.19%(+7.35)#4 | 0.50%(+8.04)#161 |
| 5. | Willowbrook | 8.54% | 1.19%(+7.35)#5 | 0.50%(+8.03)#162 |
| 6. | Westmont | 8.48% | 1.19%(+7.29)#6 | 0.50%(+7.98)#164 |
| 7. | Lagunitas Forest Knolls | 8.30% | 1.19%(+7.11)#7 | 0.50%(+7.80)#168 |
| 8. | Lawndale | 7.42% | 1.19%(+6.23)#8 | 0.50%(+6.92)#194 |
| 9. | Lennox | 7.38% | 1.19%(+6.19)#9 | 0.50%(+6.87)#195 |
| 10. | Port Costa | 7.17% | 1.19%(+5.98)#10 | 0.50%(+6.67)#202 |
| 11. | Alondra Park | 6.60% | 1.19%(+5.41)#11 | 0.50%(+6.10)#229 |
| 12. | Edison | 6.12% | 1.19%(+4.93)#12 | 0.50%(+5.62)#256 |
| 13. | North Fair Oaks | 6.01% | 1.19%(+4.82)#13 | 0.50%(+5.50)#262 |
| 14. | East Oakdale | 5.88% | 1.19%(+4.69)#14 | 0.50%(+5.38)#274 |
| 15. | Rainbow | 5.68% | 1.19%(+4.49)#15 | 0.50%(+5.18)#286 |
| 16. | North Shore | 5.52% | 1.19%(+4.33)#16 | 0.50%(+5.01)#291 |
| 17. | Desert View Highlands | 5.28% | 1.19%(+4.09)#17 | 0.50%(+4.78)#304 |
| 18. | Rollingwood | 5.25% | 1.19%(+4.06)#18 | 0.50%(+4.75)#309 |
| 19. | East Tulare Villa | 5.10% | 1.19%(+3.91)#19 | 0.50%(+4.60)#318 |
| 20. | North Richmond | 4.95% | 1.19%(+3.76)#20 | 0.50%(+4.45)#333 |
| 21. | Novato | 4.80% | 1.19%(+3.61)#21 | 0.50%(+4.30)#339 |
| 22. | Hawthorne | 4.66% | 1.19%(+3.47)#22 | 0.50%(+4.16)#348 |
| 23. | Los Angeles | 4.58% | 1.19%(+3.39)#23 | 0.50%(+4.08)#359 |
| 24. | Sebastopol | 4.54% | 1.19%(+3.35)#24 | 0.50%(+4.04)#366 |
| 25. | Little River | 4.48% | 1.19%(+3.29)#25 | 0.50%(+3.98)#369 |
| 26. | Huron | 4.42% | 1.19%(+3.23)#26 | 0.50%(+3.92)#372 |
| 27. | West Athens | 4.40% | 1.19%(+3.21)#27 | 0.50%(+3.90)#374 |
| 28. | Bass Lake | 4.40% | 1.19%(+3.21)#28 | 0.50%(+3.90)#375 |
| 29. | Fallbrook | 4.29% | 1.19%(+3.10)#29 | 0.50%(+3.79)#390 |
| 30. | Inglewood | 4.27% | 1.19%(+3.08)#30 | 0.50%(+3.76)#394 |
| 31. | Boron | 4.17% | 1.19%(+2.98)#31 | 0.50%(+3.67)#408 |
| 32. | Mesa Vista | 4.07% | 1.19%(+2.87)#32 | 0.50%(+3.56)#423 |
| 33. | Commerce | 3.86% | 1.19%(+2.67)#33 | 0.50%(+3.36)#444 |
| 34. | San Fernando | 3.72% | 1.19%(+2.53)#34 | 0.50%(+3.22)#459 |
| 35. | Florence Graham | 3.64% | 1.19%(+2.45)#35 | 0.50%(+3.14)#468 |
| 36. | Cudahy | 3.61% | 1.19%(+2.42)#36 | 0.50%(+3.11)#473 |
| 37. | Clyde | 3.61% | 1.19%(+2.42)#37 | 0.50%(+3.10)#475 |
| 38. | Huntington Park | 3.55% | 1.19%(+2.36)#38 | 0.50%(+3.05)#482 |
| 39. | Maywood | 3.54% | 1.19%(+2.35)#39 | 0.50%(+3.04)#485 |
| 40. | Tonyville | 3.50% | 1.19%(+2.31)#40 | 0.50%(+3.00)#490 |
| 41. | St Helena | 3.41% | 1.19%(+2.22)#41 | 0.50%(+2.91)#505 |
| 42. | Marin City | 3.39% | 1.19%(+2.20)#42 | 0.50%(+2.89)#507 |
| 43. | Vernon | 3.34% | 1.19%(+2.15)#43 | 0.50%(+2.84)#511 |
| 44. | Downey | 3.20% | 1.19%(+2.01)#44 | 0.50%(+2.69)#531 |
| 45. | Fairmead | 3.17% | 1.19%(+1.98)#45 | 0.50%(+2.66)#534 |
| 46. | South El Monte | 3.15% | 1.19%(+1.96)#46 | 0.50%(+2.64)#535 |
| 47. | San Mateo | 3.10% | 1.19%(+1.91)#47 | 0.50%(+2.60)#546 |
| 48. | Monrovia | 3.10% | 1.19%(+1.91)#48 | 0.50%(+2.59)#548 |
| 49. | Richmond | 3.08% | 1.19%(+1.89)#49 | 0.50%(+2.57)#551 |
| 50. | Shell Ridge | 3.07% | 1.19%(+1.88)#50 | 0.50%(+2.57)#553 |
| 51. | Oakland | 3.03% | 1.19%(+1.84)#51 | 0.50%(+2.52)#560 |
| 52. | Gardena | 2.98% | 1.19%(+1.79)#52 | 0.50%(+2.47)#572 |
| 53. | University Of California Merced | 2.97% | 1.19%(+1.78)#53 | 0.50%(+2.46)#574 |
| 54. | Palmdale | 2.95% | 1.19%(+1.76)#54 | 0.50%(+2.45)#580 |
| 55. | Cathedral City | 2.95% | 1.19%(+1.76)#55 | 0.50%(+2.44)#583 |
| 56. | South Gate | 2.94% | 1.19%(+1.75)#56 | 0.50%(+2.44)#585 |
| 57. | West Rancho Dominguez | 2.93% | 1.19%(+1.74)#57 | 0.50%(+2.43)#589 |
| 58. | Bell Gardens | 2.82% | 1.19%(+1.63)#58 | 0.50%(+2.32)#615 |
| 59. | Walnut Park | 2.67% | 1.19%(+1.48)#59 | 0.50%(+2.17)#651 |
| 60. | Solvang | 2.67% | 1.19%(+1.48)#60 | 0.50%(+2.16)#653 |
| 61. | San Pablo | 2.65% | 1.19%(+1.46)#61 | 0.50%(+2.15)#657 |
| 62. | Soquel | 2.61% | 1.19%(+1.42)#62 | 0.50%(+2.10)#669 |
| 63. | Lynwood | 2.60% | 1.19%(+1.41)#63 | 0.50%(+2.10)#673 |
| 64. | Hasley Canyon | 2.59% | 1.19%(+1.40)#64 | 0.50%(+2.08)#675 |
| 65. | Norwalk | 2.56% | 1.19%(+1.37)#65 | 0.50%(+2.06)#680 |
| 66. | Redwood City | 2.55% | 1.19%(+1.36)#66 | 0.50%(+2.04)#686 |
| 67. | Encinitas | 2.54% | 1.19%(+1.35)#67 | 0.50%(+2.04)#689 |
| 68. | Baker | 2.53% | 1.19%(+1.34)#68 | 0.50%(+2.03)#693 |
| 69. | Bangor | 2.51% | 1.19%(+1.32)#69 | 0.50%(+2.00)#698 |
| 70. | Mead Valley | 2.47% | 1.19%(+1.28)#70 | 0.50%(+1.96)#709 |
| 71. | La Puente | 2.44% | 1.19%(+1.25)#71 | 0.50%(+1.94)#718 |
| 72. | Quartz Hill | 2.42% | 1.19%(+1.23)#72 | 0.50%(+1.91)#723 |
| 73. | Baldwin Park | 2.32% | 1.19%(+1.13)#73 | 0.50%(+1.81)#750 |
| 74. | August | 2.30% | 1.19%(+1.11)#74 | 0.50%(+1.80)#753 |
| 75. | Lake Elsinore | 2.29% | 1.19%(+1.10)#75 | 0.50%(+1.79)#755 |
| 76. | Thornton | 2.29% | 1.19%(+1.10)#76 | 0.50%(+1.79)#756 |
| 77. | Santa Clarita | 2.29% | 1.19%(+1.10)#77 | 0.50%(+1.79)#758 |
| 78. | Mojave | 2.28% | 1.19%(+1.09)#78 | 0.50%(+1.77)#763 |
| 79. | San Jacinto | 2.26% | 1.19%(+1.07)#79 | 0.50%(+1.76)#771 |
| 80. | East Los Angeles | 2.26% | 1.19%(+1.07)#80 | 0.50%(+1.75)#772 |
| 81. | Adelanto | 2.20% | 1.19%(+1.01)#81 | 0.50%(+1.70)#788 |
| 82. | Calistoga | 2.18% | 1.19%(+0.987)#82 | 0.50%(+1.67)#794 |
| 83. | Rialto | 2.10% | 1.19%(+0.912)#83 | 0.50%(+1.60)#813 |
| 84. | Pomona | 2.08% | 1.19%(+0.892)#84 | 0.50%(+1.58)#819 |
| 85. | Azusa | 2.04% | 1.19%(+0.852)#85 | 0.50%(+1.54)#830 |
| 86. | Vandenberg Village | 2.03% | 1.19%(+0.839)#86 | 0.50%(+1.53)#836 |
| 87. | Rodeo | 2.01% | 1.19%(+0.824)#87 | 0.50%(+1.51)#840 |
| 88. | Calwa | 2.01% | 1.19%(+0.821)#88 | 0.50%(+1.51)#842 |
| 89. | Compton | 2.00% | 1.19%(+0.808)#89 | 0.50%(+1.49)#845 |
| 90. | Mecca | 1.96% | 1.19%(+0.774)#90 | 0.50%(+1.46)#857 |
| 91. | Agua Dulce | 1.96% | 1.19%(+0.771)#91 | 0.50%(+1.46)#858 |
| 92. | Bellflower | 1.96% | 1.19%(+0.768)#92 | 0.50%(+1.45)#861 |
| 93. | Fontana | 1.94% | 1.19%(+0.754)#93 | 0.50%(+1.44)#868 |
| 94. | San Bernardino | 1.94% | 1.19%(+0.748)#94 | 0.50%(+1.43)#871 |
| 95. | Leona Valley | 1.91% | 1.19%(+0.722)#95 | 0.50%(+1.41)#878 |
| 96. | East San Gabriel | 1.91% | 1.19%(+0.721)#96 | 0.50%(+1.41)#879 |
| 97. | East Rancho Dominguez | 1.91% | 1.19%(+0.719)#97 | 0.50%(+1.41)#880 |
| 98. | Colton | 1.90% | 1.19%(+0.713)#98 | 0.50%(+1.40)#882 |
| 99. | Valinda | 1.89% | 1.19%(+0.696)#99 | 0.50%(+1.38)#888 |
| 100. | Riverside | 1.86% | 1.19%(+0.674)#100 | 0.50%(+1.36)#891 |
Common Questions
What are the Top 10 Cities with the Highest Percentage of Guatemalan Population in California?
Top 10 Cities with the Highest Percentage of Guatemalan Population in California are:
#1
9.92%
#2
9.92%
#3
9.26%
#4
8.54%
#5
8.54%
#6
8.48%
#7
8.30%
#8
7.42%
#9
7.38%
#10
7.17%
What city has the Highest Percentage of Guatemalan Population in California?
San Rafael has the Highest Percentage of Guatemalan Population in California with 9.92%.
What is the Percentage of Guatemalan Population in the State of California?
Percentage of Guatemalan Population in California is 1.19%.
What is the Percentage of Guatemalan Population in the United States?
Percentage of Guatemalan Population in the United States is 0.50%.