Cities with the Highest Percentage of Population Employed in Installation, Maintenance & Repair in Missouri
RELATED REPORTS & OPTIONS
Installation, Maintenance & Repair
Missouri
Compare Cities
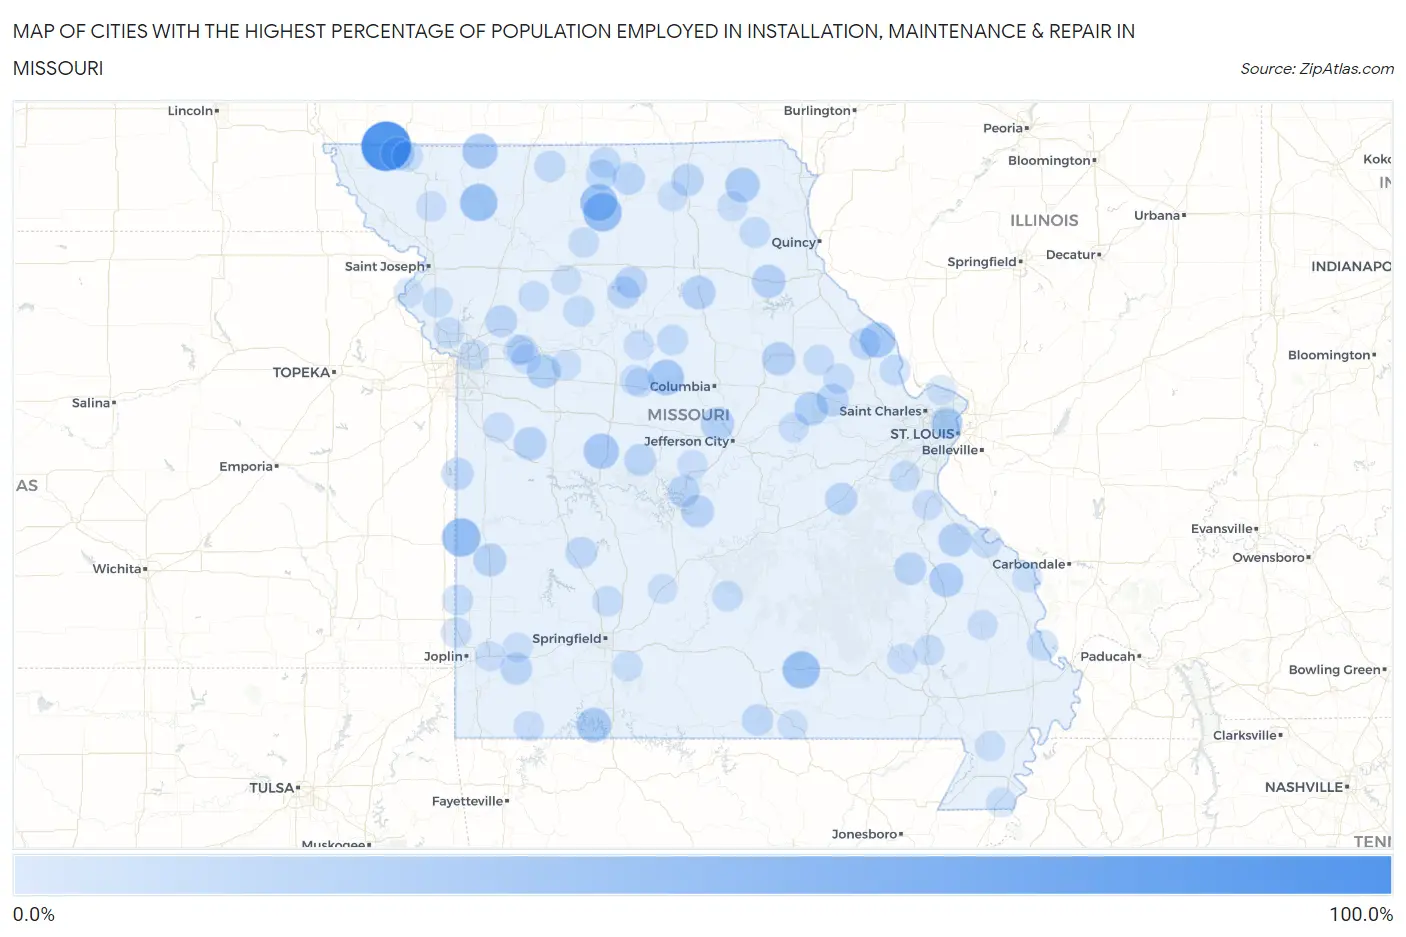
Map of Cities with the Highest Percentage of Population Employed in Installation, Maintenance & Repair in Missouri
0.0%
100.0%
Cities with the Highest Percentage of Population Employed in Installation, Maintenance & Repair in Missouri
| City | % Employed | vs State | vs National | |
| 1. | Blanchard | 100.0% | 3.2%(+96.8)#1 | 3.1%(+96.9)#12 |
| 2. | New Wells | 52.4% | 3.2%(+49.2)#2 | 3.1%(+49.3)#63 |
| 3. | Richards | 47.8% | 3.2%(+44.6)#3 | 3.1%(+44.8)#89 |
| 4. | Humphreys | 46.7% | 3.2%(+43.5)#4 | 3.1%(+43.6)#98 |
| 5. | Montier | 42.9% | 3.2%(+39.7)#5 | 3.1%(+39.8)#120 |
| 6. | Darlington | 42.9% | 3.2%(+39.7)#6 | 3.1%(+39.8)#122 |
| 7. | Osgood | 41.2% | 3.2%(+38.0)#7 | 3.1%(+38.1)#136 |
| 8. | Williamstown | 37.9% | 3.2%(+34.7)#8 | 3.1%(+34.9)#167 |
| 9. | Franklin | 34.8% | 3.2%(+31.6)#9 | 3.1%(+31.7)#203 |
| 10. | Ionia | 33.3% | 3.2%(+30.1)#10 | 3.1%(+30.3)#225 |
| 11. | Paynesville | 33.3% | 3.2%(+30.1)#11 | 3.1%(+30.3)#227 |
| 12. | Irena | 33.3% | 3.2%(+30.1)#12 | 3.1%(+30.3)#232 |
| 13. | Coney Island | 30.8% | 3.2%(+27.6)#13 | 3.1%(+27.7)#271 |
| 14. | Rutledge | 29.4% | 3.2%(+26.2)#14 | 3.1%(+26.3)#294 |
| 15. | Mine La Motte | 28.6% | 3.2%(+25.4)#15 | 3.1%(+25.5)#315 |
| 16. | Big Spring | 26.5% | 3.2%(+23.3)#16 | 3.1%(+23.5)#365 |
| 17. | Mayview | 26.0% | 3.2%(+22.8)#17 | 3.1%(+22.9)#381 |
| 18. | Hartsburg | 25.6% | 3.2%(+22.4)#18 | 3.1%(+22.5)#389 |
| 19. | Jacksonville | 25.4% | 3.2%(+22.2)#19 | 3.1%(+22.4)#394 |
| 20. | Benton City | 25.4% | 3.2%(+22.2)#20 | 3.1%(+22.3)#398 |
| 21. | Elmo | 25.3% | 3.2%(+22.1)#21 | 3.1%(+22.2)#400 |
| 22. | Hunnewell | 25.3% | 3.2%(+22.1)#22 | 3.1%(+22.2)#401 |
| 23. | Weingarten | 24.3% | 3.2%(+21.1)#23 | 3.1%(+21.3)#448 |
| 24. | Blairstown | 24.0% | 3.2%(+20.8)#24 | 3.1%(+20.9)#457 |
| 25. | Whiting | 23.9% | 3.2%(+20.7)#25 | 3.1%(+20.8)#464 |
| 26. | Milo | 23.1% | 3.2%(+19.9)#26 | 3.1%(+20.0)#497 |
| 27. | Middle Grove | 22.2% | 3.2%(+19.0)#27 | 3.1%(+19.2)#531 |
| 28. | Brumley | 21.6% | 3.2%(+18.4)#28 | 3.1%(+18.6)#563 |
| 29. | Jonesburg | 21.0% | 3.2%(+17.8)#29 | 3.1%(+18.0)#603 |
| 30. | Iron Mountain Lake | 20.4% | 3.2%(+17.2)#30 | 3.1%(+17.3)#647 |
| 31. | Greentop | 20.3% | 3.2%(+17.1)#31 | 3.1%(+17.3)#651 |
| 32. | Pollock | 20.0% | 3.2%(+16.8)#32 | 3.1%(+16.9)#683 |
| 33. | St Cloud | 20.0% | 3.2%(+16.8)#33 | 3.1%(+16.9)#685 |
| 34. | Stover | 19.5% | 3.2%(+16.3)#34 | 3.1%(+16.4)#706 |
| 35. | Wentworth | 19.4% | 3.2%(+16.2)#35 | 3.1%(+16.3)#711 |
| 36. | Mendon | 19.2% | 3.2%(+16.0)#36 | 3.1%(+16.1)#724 |
| 37. | Amsterdam | 18.9% | 3.2%(+15.7)#37 | 3.1%(+15.8)#736 |
| 38. | Rothville | 18.8% | 3.2%(+15.5)#38 | 3.1%(+15.7)#750 |
| 39. | Bagnell | 18.8% | 3.2%(+15.5)#39 | 3.1%(+15.7)#751 |
| 40. | Excelsior Estates | 18.4% | 3.2%(+15.2)#40 | 3.1%(+15.4)#774 |
| 41. | Glen Echo Park | 17.8% | 3.2%(+14.6)#41 | 3.1%(+14.7)#843 |
| 42. | Flemington | 17.6% | 3.2%(+14.4)#42 | 3.1%(+14.6)#850 |
| 43. | South Fork | 17.0% | 3.2%(+13.8)#43 | 3.1%(+13.9)#903 |
| 44. | Eolia | 16.8% | 3.2%(+13.6)#44 | 3.1%(+13.8)#921 |
| 45. | Cainsville | 15.4% | 3.2%(+12.2)#45 | 3.1%(+12.3)#1,081 |
| 46. | Lucerne | 15.4% | 3.2%(+12.2)#46 | 3.1%(+12.3)#1,092 |
| 47. | Bogard | 15.2% | 3.2%(+12.0)#47 | 3.1%(+12.1)#1,118 |
| 48. | Newtown | 15.0% | 3.2%(+11.8)#48 | 3.1%(+11.9)#1,155 |
| 49. | Commerce | 15.0% | 3.2%(+11.8)#49 | 3.1%(+11.9)#1,157 |
| 50. | Armstrong | 15.0% | 3.2%(+11.8)#50 | 3.1%(+11.9)#1,168 |
| 51. | Mindenmines | 14.8% | 3.2%(+11.6)#51 | 3.1%(+11.7)#1,186 |
| 52. | Foley | 13.8% | 3.2%(+10.6)#52 | 3.1%(+10.8)#1,371 |
| 53. | Newark | 13.8% | 3.2%(+10.6)#53 | 3.1%(+10.7)#1,380 |
| 54. | Clearmont | 13.7% | 3.2%(+10.5)#54 | 3.1%(+10.6)#1,395 |
| 55. | St Mary | 13.7% | 3.2%(+10.5)#55 | 3.1%(+10.6)#1,397 |
| 56. | Plato | 13.6% | 3.2%(+10.4)#56 | 3.1%(+10.6)#1,405 |
| 57. | Cowgill | 13.5% | 3.2%(+10.3)#57 | 3.1%(+10.4)#1,433 |
| 58. | Lake St. Clair | 13.4% | 3.2%(+10.1)#58 | 3.1%(+10.3)#1,476 |
| 59. | Birmingham | 13.0% | 3.2%(+9.84)#59 | 3.1%(+9.98)#1,559 |
| 60. | Pleasant Hope | 13.0% | 3.2%(+9.78)#60 | 3.1%(+9.91)#1,575 |
| 61. | Cedar Hill Lakes | 12.8% | 3.2%(+9.55)#61 | 3.1%(+9.68)#1,643 |
| 62. | Chula | 12.7% | 3.2%(+9.49)#62 | 3.1%(+9.63)#1,648 |
| 63. | Ferrelview | 12.6% | 3.2%(+9.37)#63 | 3.1%(+9.51)#1,674 |
| 64. | Middletown | 12.5% | 3.2%(+9.30)#64 | 3.1%(+9.43)#1,694 |
| 65. | Waco | 12.5% | 3.2%(+9.30)#65 | 3.1%(+9.43)#1,695 |
| 66. | Nelson | 12.5% | 3.2%(+9.30)#66 | 3.1%(+9.43)#1,702 |
| 67. | Truxton | 12.5% | 3.2%(+9.30)#67 | 3.1%(+9.43)#1,709 |
| 68. | Greenville | 12.4% | 3.2%(+9.19)#68 | 3.1%(+9.33)#1,726 |
| 69. | Mill Spring | 12.1% | 3.2%(+8.92)#69 | 3.1%(+9.05)#1,794 |
| 70. | Washburn | 12.0% | 3.2%(+8.80)#70 | 3.1%(+8.93)#1,828 |
| 71. | Olympian Village | 11.9% | 3.2%(+8.69)#71 | 3.1%(+8.83)#1,860 |
| 72. | East Lynne | 11.8% | 3.2%(+8.56)#72 | 3.1%(+8.70)#1,894 |
| 73. | Morrison | 11.8% | 3.2%(+8.56)#73 | 3.1%(+8.70)#1,901 |
| 74. | Barnard | 11.7% | 3.2%(+8.45)#74 | 3.1%(+8.58)#1,931 |
| 75. | Camden | 11.4% | 3.2%(+8.22)#75 | 3.1%(+8.36)#2,012 |
| 76. | Gilliam | 11.4% | 3.2%(+8.19)#76 | 3.1%(+8.32)#2,025 |
| 77. | Marble Hill | 11.3% | 3.2%(+8.11)#77 | 3.1%(+8.25)#2,046 |
| 78. | Edina | 11.3% | 3.2%(+8.10)#78 | 3.1%(+8.24)#2,049 |
| 79. | Olean | 11.1% | 3.2%(+7.91)#79 | 3.1%(+8.04)#2,114 |
| 80. | Fleming | 11.1% | 3.2%(+7.91)#80 | 3.1%(+8.04)#2,117 |
| 81. | Fidelity | 10.9% | 3.2%(+7.69)#81 | 3.1%(+7.83)#2,176 |
| 82. | Sparta | 10.8% | 3.2%(+7.62)#82 | 3.1%(+7.75)#2,209 |
| 83. | Dearborn | 10.8% | 3.2%(+7.61)#83 | 3.1%(+7.74)#2,211 |
| 84. | White Branch | 10.8% | 3.2%(+7.61)#84 | 3.1%(+7.74)#2,213 |
| 85. | Tarsney Lakes | 10.8% | 3.2%(+7.57)#85 | 3.1%(+7.70)#2,223 |
| 86. | La Russell | 10.7% | 3.2%(+7.51)#86 | 3.1%(+7.65)#2,248 |
| 87. | Dawn | 10.6% | 3.2%(+7.43)#87 | 3.1%(+7.57)#2,273 |
| 88. | Corder | 10.6% | 3.2%(+7.38)#88 | 3.1%(+7.52)#2,291 |
| 89. | Phillipsburg | 10.5% | 3.2%(+7.32)#89 | 3.1%(+7.46)#2,316 |
| 90. | Gideon | 10.4% | 3.2%(+7.22)#90 | 3.1%(+7.36)#2,360 |
| 91. | Velda Village Hills | 10.4% | 3.2%(+7.16)#91 | 3.1%(+7.30)#2,386 |
| 92. | Cooter | 10.3% | 3.2%(+7.11)#92 | 3.1%(+7.25)#2,411 |
| 93. | Blackwater | 10.3% | 3.2%(+7.08)#93 | 3.1%(+7.21)#2,431 |
| 94. | Rushville | 10.3% | 3.2%(+7.05)#94 | 3.1%(+7.19)#2,441 |
| 95. | Wellington | 10.2% | 3.2%(+7.00)#95 | 3.1%(+7.14)#2,466 |
| 96. | Novinger | 10.2% | 3.2%(+6.97)#96 | 3.1%(+7.10)#2,479 |
| 97. | Shakertowne | 10.2% | 3.2%(+6.96)#97 | 3.1%(+7.09)#2,484 |
| 98. | Altenburg | 10.1% | 3.2%(+6.90)#98 | 3.1%(+7.03)#2,514 |
| 99. | Portage Des Sioux | 10.0% | 3.2%(+6.80)#99 | 3.1%(+6.93)#2,552 |
| 100. | Koshkonong | 10.0% | 3.2%(+6.80)#100 | 3.1%(+6.93)#2,559 |
Common Questions
What are the Top 10 Cities with the Highest Percentage of Population Employed in Installation, Maintenance & Repair in Missouri?
Top 10 Cities with the Highest Percentage of Population Employed in Installation, Maintenance & Repair in Missouri are:
#1
100.0%
#2
47.8%
#3
46.7%
#4
42.9%
#5
42.9%
#6
41.2%
#7
34.8%
#8
33.3%
#9
33.3%
#10
33.3%
What city has the Highest Percentage of Population Employed in Installation, Maintenance & Repair in Missouri?
Blanchard has the Highest Percentage of Population Employed in Installation, Maintenance & Repair in Missouri with 100.0%.
What is the Percentage of Population Employed in Installation, Maintenance & Repair in the State of Missouri?
Percentage of Population Employed in Installation, Maintenance & Repair in Missouri is 3.2%.
What is the Percentage of Population Employed in Installation, Maintenance & Repair in the United States?
Percentage of Population Employed in Installation, Maintenance & Repair in the United States is 3.1%.