Louisiana Map & Demographics
Louisiana Map
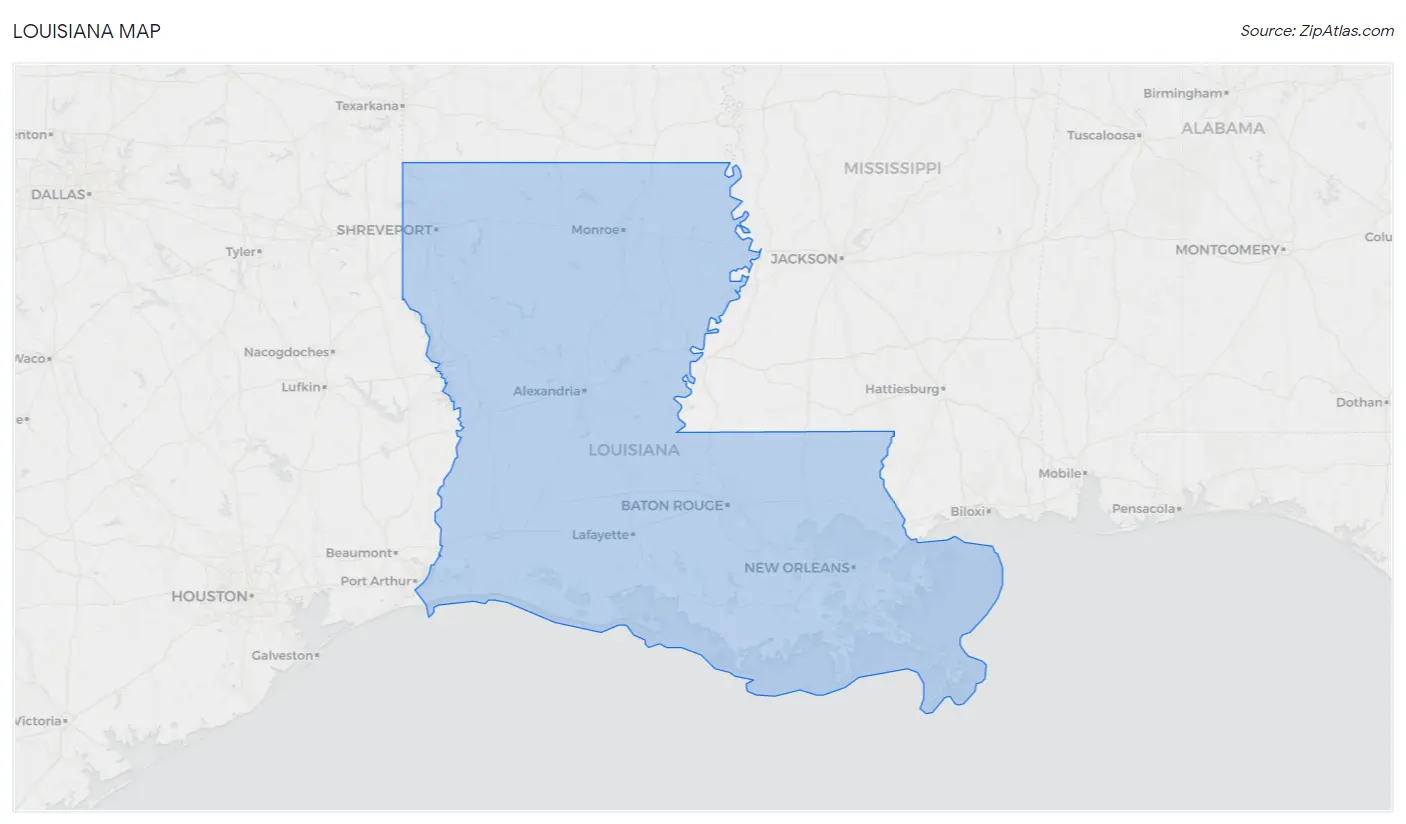
Louisiana Overview
Apr 30, 1812
INCORPORATED
51,988
TOTAL AREA [ SQ MI ]
43,199
LAND AREA [ SQ MI ]
8,789
WATER AREA [ SQ MI ]
100
ELEVATION AVG [ FT ]
535
ELEVATION HIGH [ FT ]
Sea Level
ELEVATION LOW [ FT ]
107.4
POP DENSITY [ PPL / SQ MI ]
$32,981
PER CAPITA INCOME
$74,911
AVG FAMILY INCOME
$57,852
AVG HOUSEHOLD INCOME
37.0%
WAGE / INCOME GAP [ % ]
63.0¢/ $1
WAGE / INCOME GAP [ $ ]
$10,997
FAMILY INCOME DEFICIT
0.50
INEQUALITY / GINI INDEX
70726
LARGEST ZIP CODE
New Orleans
LARGEST CITY
East Baton Rouge Parish
LARGEST COUNTY
4,640,546
TOTAL POPULATION
2,275,349
MALE POPULATION
2,365,197
FEMALE POPULATION
96.20
MALES / 100 FEMALES
103.95
FEMALES / 100 MALES
37.6
MEDIAN AGE
3.2
AVG FAMILY SIZE
2.6
AVG HOUSEHOLD SIZE
2,178,498
LABOR FORCE [ PEOPLE ]
59.2%
PERCENT IN LABOR FORCE
6.6%
UNEMPLOYMENT RATE
Income in Louisiana
Income Overview in Louisiana
Per Capita Income in Louisiana is $32,981, while median incomes of families and households are $74,911 and $57,852 respectively.
| Characteristic | Number | Measure |
| Per Capita Income | 4,640,546 | $32,981 |
| Median Family Income | 1,120,745 | $74,911 |
| Mean Family Income | 1,120,745 | $99,418 |
| Median Household Income | 1,765,264 | $57,852 |
| Mean Household Income | 1,765,264 | $83,169 |
| Income Deficit | 1,120,745 | $10,997 |
| Wage / Income Gap (%) | 4,640,546 | 36.97% |
| Wage / Income Gap ($) | 4,640,546 | 63.03¢ per $1 |
| Gini / Inequality Index | 4,640,546 | 0.50 |
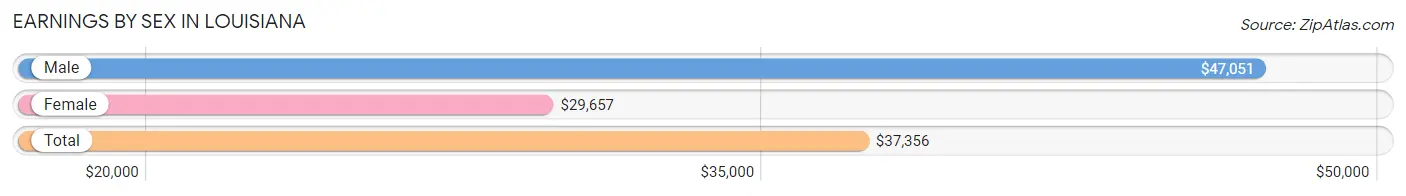
Earnings by Sex in Louisiana
Average Earnings in Louisiana are $37,356, $47,051 for men and $29,657 for women, a difference of 37.0%.
| Sex | Number | Average Earnings |
| Male | 1,167,352 (51.8%) | $47,051 |
| Female | 1,085,860 (48.2%) | $29,657 |
| Total | 2,253,212 (100.0%) | $37,356 |
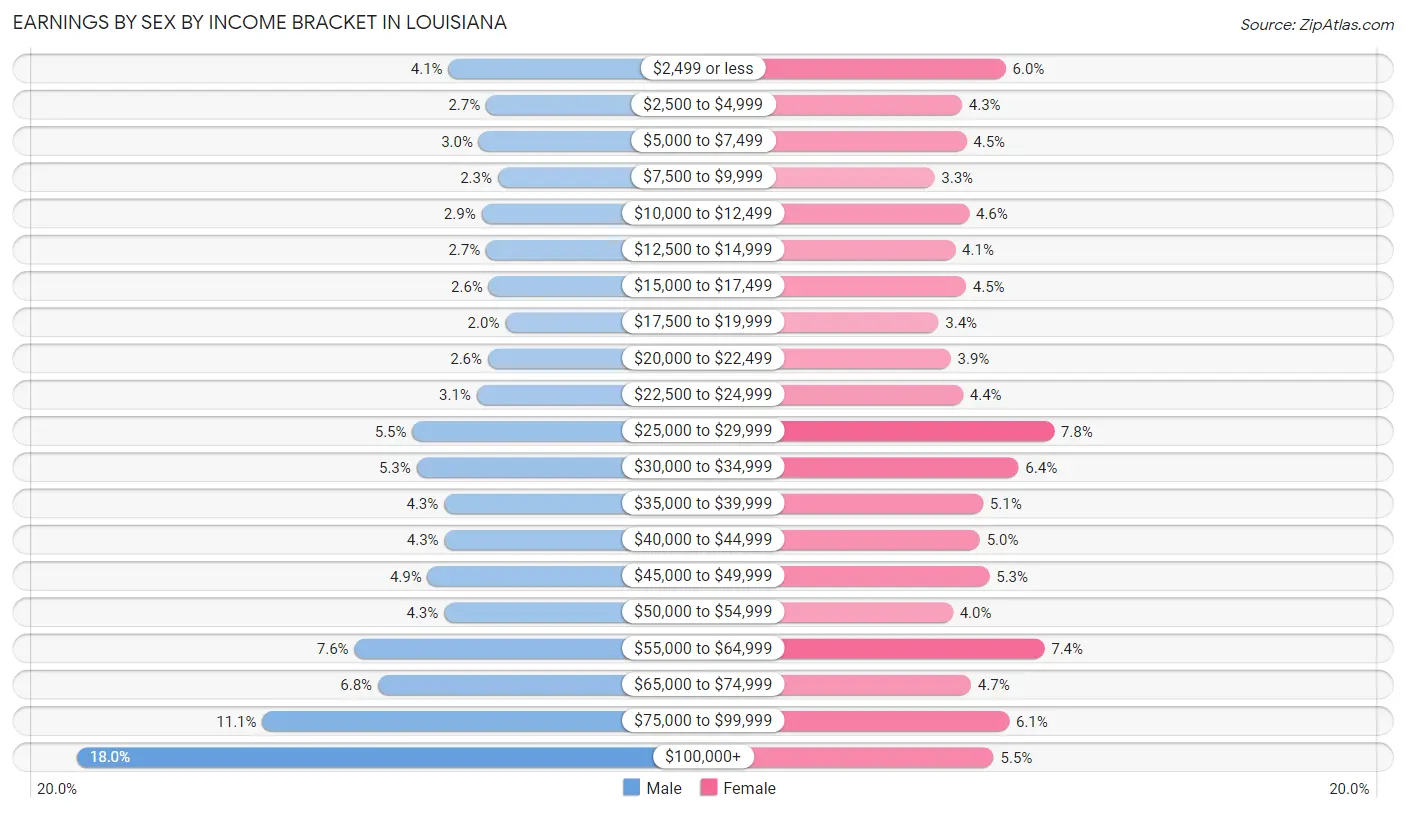
Earnings by Sex by Income Bracket in Louisiana
The most common earnings brackets in Louisiana are $100,000+ for men (210,562 | 18.0%) and $25,000 to $29,999 for women (84,234 | 7.8%).
| Income | Male | Female |
| $2,499 or less | 48,077 (4.1%) | 64,641 (5.9%) |
| $2,500 to $4,999 | 31,680 (2.7%) | 46,853 (4.3%) |
| $5,000 to $7,499 | 34,781 (3.0%) | 48,595 (4.5%) |
| $7,500 to $9,999 | 26,497 (2.3%) | 35,649 (3.3%) |
| $10,000 to $12,499 | 33,599 (2.9%) | 49,695 (4.6%) |
| $12,500 to $14,999 | 31,588 (2.7%) | 44,077 (4.1%) |
| $15,000 to $17,499 | 30,466 (2.6%) | 48,475 (4.5%) |
| $17,500 to $19,999 | 23,195 (2.0%) | 37,276 (3.4%) |
| $20,000 to $22,499 | 30,826 (2.6%) | 42,288 (3.9%) |
| $22,500 to $24,999 | 35,705 (3.1%) | 47,261 (4.3%) |
| $25,000 to $29,999 | 63,887 (5.5%) | 84,234 (7.8%) |
| $30,000 to $34,999 | 62,015 (5.3%) | 69,824 (6.4%) |
| $35,000 to $39,999 | 49,972 (4.3%) | 55,336 (5.1%) |
| $40,000 to $44,999 | 49,838 (4.3%) | 54,037 (5.0%) |
| $45,000 to $49,999 | 57,142 (4.9%) | 58,018 (5.3%) |
| $50,000 to $54,999 | 49,984 (4.3%) | 43,093 (4.0%) |
| $55,000 to $64,999 | 89,243 (7.6%) | 80,343 (7.4%) |
| $65,000 to $74,999 | 78,867 (6.8%) | 50,446 (4.6%) |
| $75,000 to $99,999 | 129,428 (11.1%) | 65,988 (6.1%) |
| $100,000+ | 210,562 (18.0%) | 59,731 (5.5%) |
| Total | 1,167,352 (100.0%) | 1,085,860 (100.0%) |
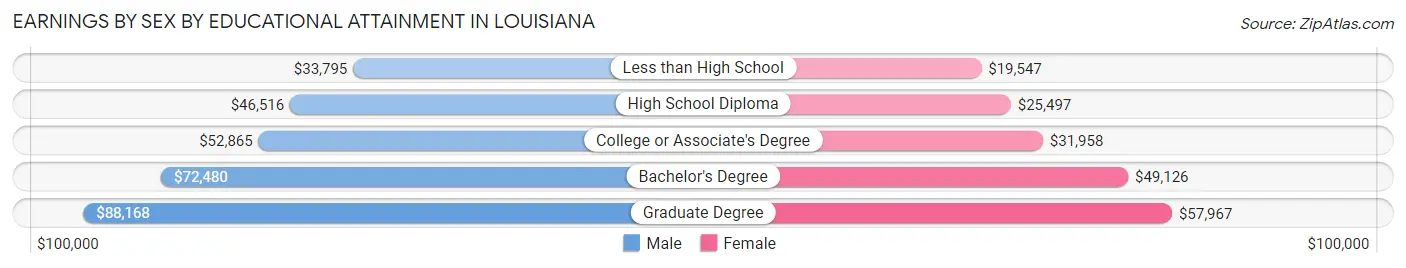
Earnings by Sex by Educational Attainment in Louisiana
Average earnings in Louisiana are $54,309 for men and $34,522 for women, a difference of 36.4%. Men with an educational attainment of graduate degree enjoy the highest average annual earnings of $88,168, while those with less than high school education earn the least with $33,795. Women with an educational attainment of graduate degree earn the most with the average annual earnings of $57,967, while those with less than high school education have the smallest earnings of $19,547.
| Educational Attainment | Male Income | Female Income |
| Less than High School | $33,795 | $19,547 |
| High School Diploma | $46,516 | $25,497 |
| College or Associate's Degree | $52,865 | $31,958 |
| Bachelor's Degree | $72,480 | $49,126 |
| Graduate Degree | $88,168 | $57,967 |
| Total | $54,309 | $34,522 |
Family Income in Louisiana
Family Income Brackets in Louisiana
According to the Louisiana family income data, there are 206,217 families falling into the $100,000 to $149,999 income range, which is the most common income bracket and makes up 18.4% of all families. Conversely, the $10,000 to $14,999 income bracket is the least frequent group with only 33,622 families (3.0%) belonging to this category.
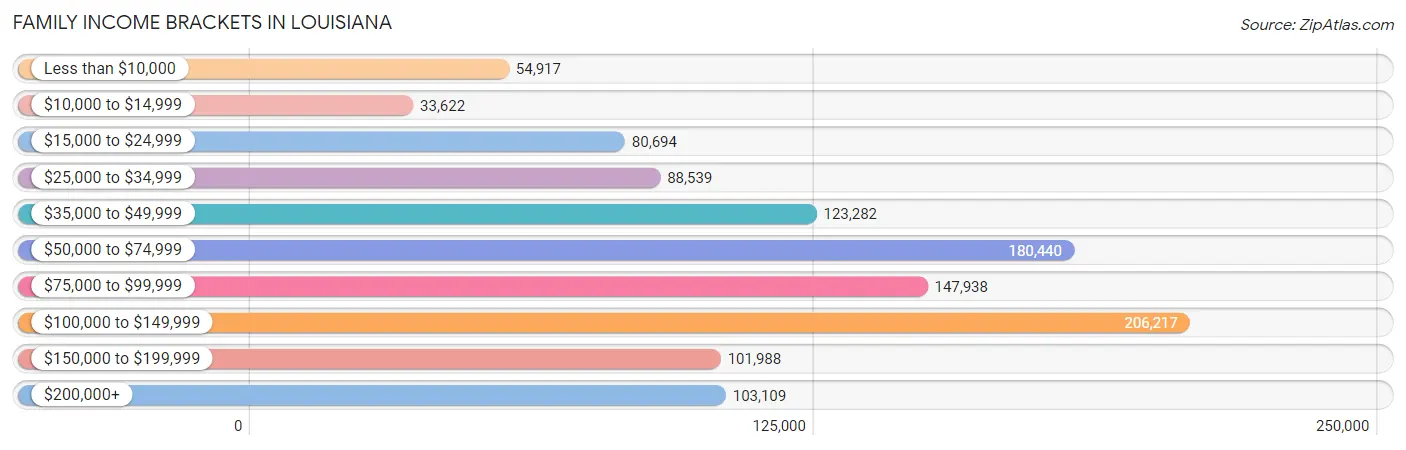
| Income Bracket | # Families | % Families |
| Less than $10,000 | 54,917 | 4.9% |
| $10,000 to $14,999 | 33,622 | 3.0% |
| $15,000 to $24,999 | 80,694 | 7.2% |
| $25,000 to $34,999 | 88,539 | 7.9% |
| $35,000 to $49,999 | 123,282 | 11.0% |
| $50,000 to $74,999 | 180,440 | 16.1% |
| $75,000 to $99,999 | 147,938 | 13.2% |
| $100,000 to $149,999 | 206,217 | 18.4% |
| $150,000 to $199,999 | 101,988 | 9.1% |
| $200,000+ | 103,109 | 9.2% |
Family Income by Famaliy Size in Louisiana
4-person families (193,230 | 17.2%) account for the highest median family income in Louisiana with $95,801 per family, while 2-person families (534,369 | 47.7%) have the highest median income of $32,841 per family member.
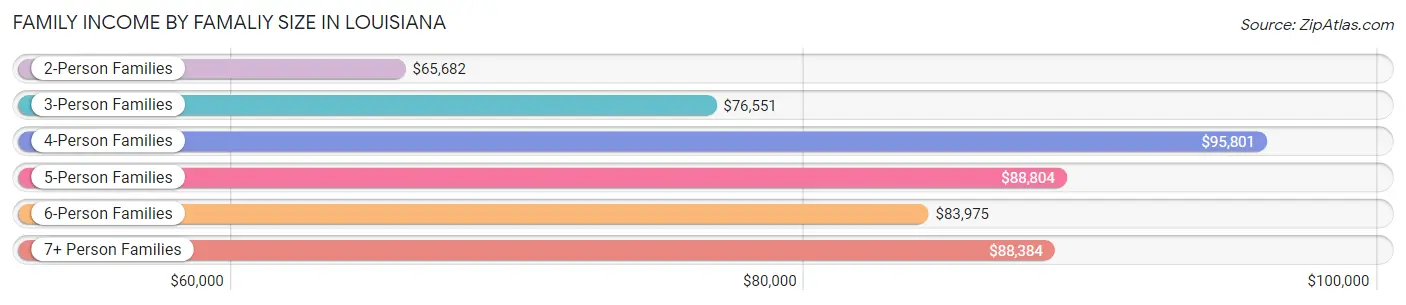
| Income Bracket | # Families | Median Income |
| 2-Person Families | 534,369 (47.7%) | $65,682 |
| 3-Person Families | 262,711 (23.4%) | $76,551 |
| 4-Person Families | 193,230 (17.2%) | $95,801 |
| 5-Person Families | 86,282 (7.7%) | $88,804 |
| 6-Person Families | 29,051 (2.6%) | $83,975 |
| 7+ Person Families | 15,102 (1.3%) | $88,384 |
| Total | 1,120,745 (100.0%) | $74,911 |
Family Income by Number of Earners in Louisiana
The median family income in Louisiana is $74,911, with families comprising 3+ earners (92,079) having the highest median family income of $134,855, while families with no earners (192,461) have the lowest median family income of $33,837, accounting for 8.2% and 17.2% of families, respectively.
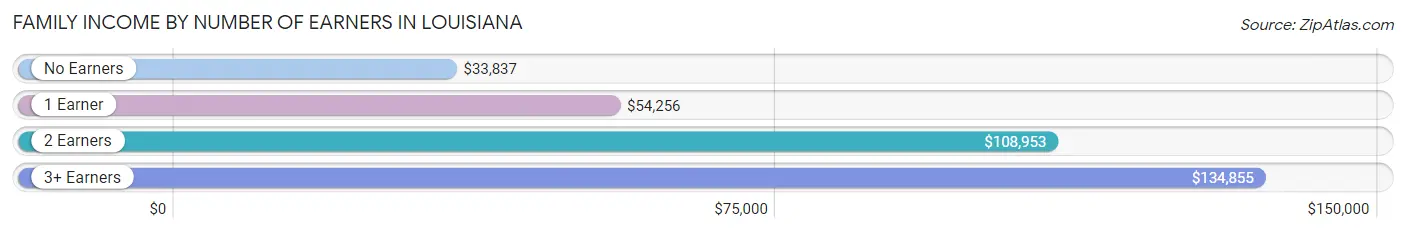
| Number of Earners | # Families | Median Income |
| No Earners | 192,461 (17.2%) | $33,837 |
| 1 Earner | 412,374 (36.8%) | $54,256 |
| 2 Earners | 423,831 (37.8%) | $108,953 |
| 3+ Earners | 92,079 (8.2%) | $134,855 |
| Total | 1,120,745 (100.0%) | $74,911 |
Household Income in Louisiana
Household Income Brackets in Louisiana
With 280,677 households falling in the category, the $50,000 to $74,999 income range is the most frequent in Louisiana, accounting for 15.9% of all households. In contrast, only 105,916 households (6.0%) fall into the $10,000 to $14,999 income bracket, making it the least populous group.
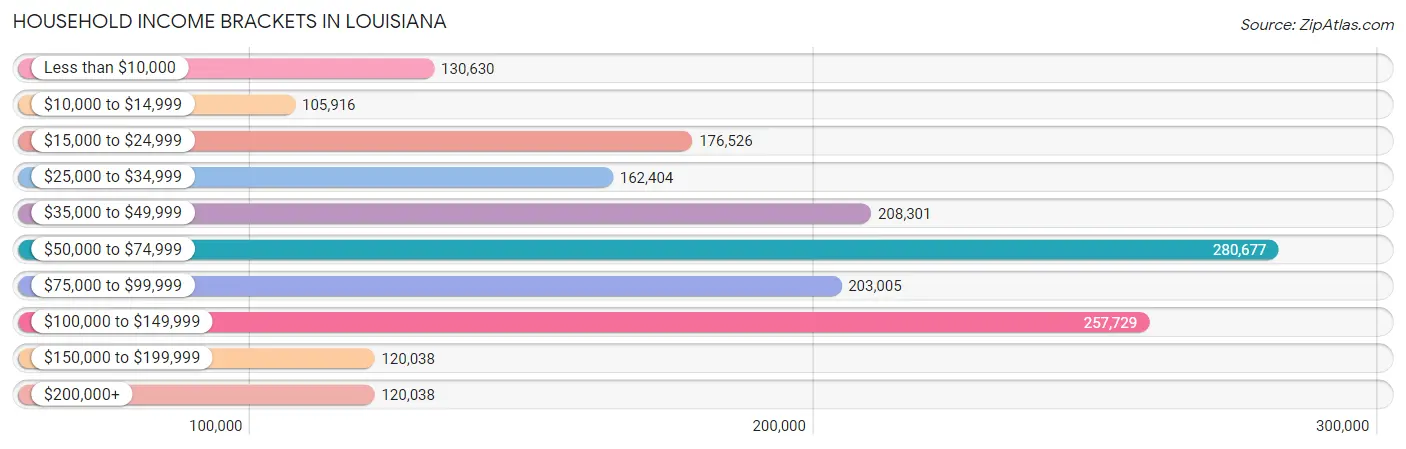
| Income Bracket | # Households | % Households |
| Less than $10,000 | 130,630 | 7.4% |
| $10,000 to $14,999 | 105,916 | 6.0% |
| $15,000 to $24,999 | 176,526 | 10.0% |
| $25,000 to $34,999 | 162,404 | 9.2% |
| $35,000 to $49,999 | 208,301 | 11.8% |
| $50,000 to $74,999 | 280,677 | 15.9% |
| $75,000 to $99,999 | 203,005 | 11.5% |
| $100,000 to $149,999 | 257,729 | 14.6% |
| $150,000 to $199,999 | 120,038 | 6.8% |
| $200,000+ | 120,038 | 6.8% |
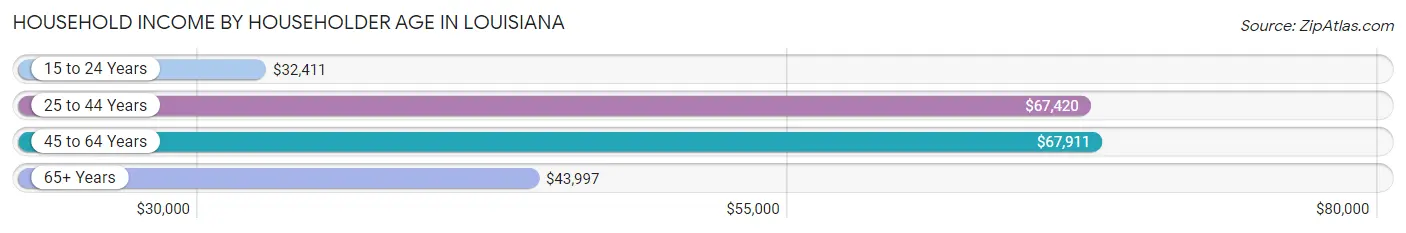
Household Income by Householder Age in Louisiana
The median household income in Louisiana is $57,852, with the highest median household income of $67,911 found in the 45 to 64 years age bracket for the primary householder. A total of 642,525 households (36.4%) fall into this category. Meanwhile, the 15 to 24 years age bracket for the primary householder has the lowest median household income of $32,411, with 68,087 households (3.9%) in this group.
| Income Bracket | # Households | Median Income |
| 15 to 24 Years | 68,087 (3.9%) | $32,411 |
| 25 to 44 Years | 581,594 (33.0%) | $67,420 |
| 45 to 64 Years | 642,525 (36.4%) | $67,911 |
| 65+ Years | 473,058 (26.8%) | $43,997 |
| Total | 1,765,264 (100.0%) | $57,852 |
Poverty in Louisiana
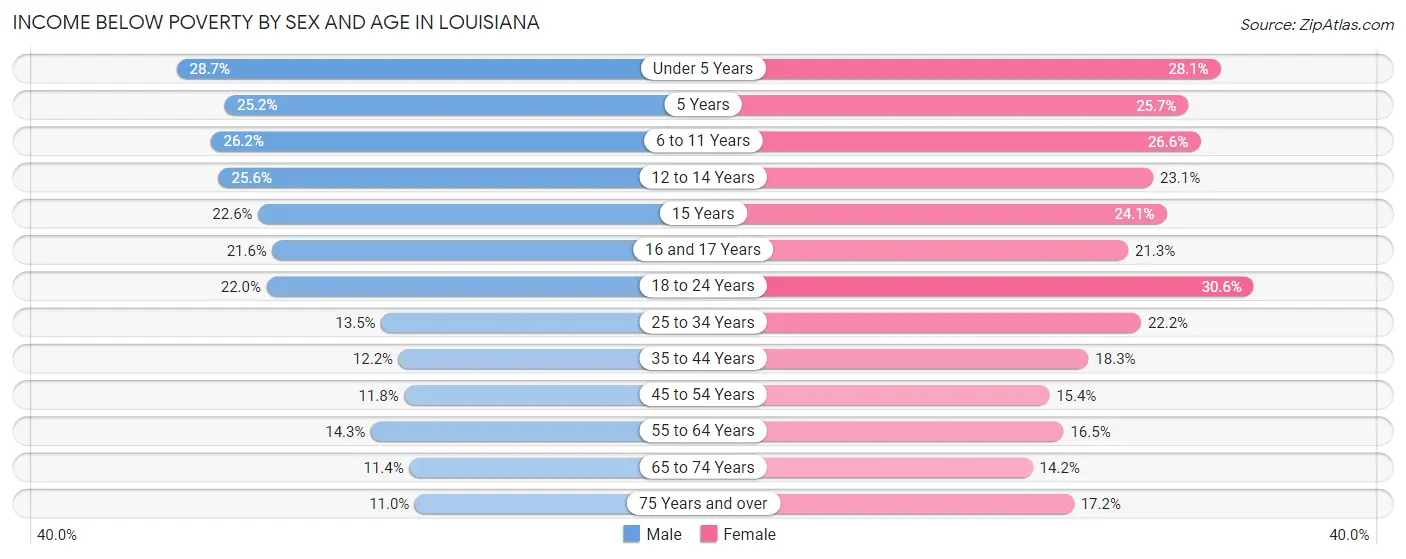
Income Below Poverty by Sex and Age in Louisiana
With 16.8% poverty level for males and 20.4% for females among the residents of Louisiana, under 5 year old males and 18 to 24 year old females are the most vulnerable to poverty, with 41,778 males (28.7%) and 59,881 females (30.6%) in their respective age groups living below the poverty level.
| Age Bracket | Male | Female |
| Under 5 Years | 41,778 (28.7%) | 39,305 (28.1%) |
| 5 Years | 7,410 (25.2%) | 7,111 (25.7%) |
| 6 to 11 Years | 47,202 (26.2%) | 45,995 (26.6%) |
| 12 to 14 Years | 24,812 (25.6%) | 21,501 (23.1%) |
| 15 Years | 7,270 (22.6%) | 6,996 (24.1%) |
| 16 and 17 Years | 13,287 (21.6%) | 12,623 (21.2%) |
| 18 to 24 Years | 44,309 (22.0%) | 59,881 (30.6%) |
| 25 to 34 Years | 40,530 (13.5%) | 70,197 (22.2%) |
| 35 to 44 Years | 34,867 (12.2%) | 55,162 (18.3%) |
| 45 to 54 Years | 30,506 (11.8%) | 42,301 (15.4%) |
| 55 to 64 Years | 40,183 (14.3%) | 50,709 (16.5%) |
| 65 to 74 Years | 23,555 (11.4%) | 33,725 (14.2%) |
| 75 Years and over | 12,549 (11.0%) | 28,274 (17.2%) |
| Total | 368,258 (16.8%) | 473,780 (20.4%) |
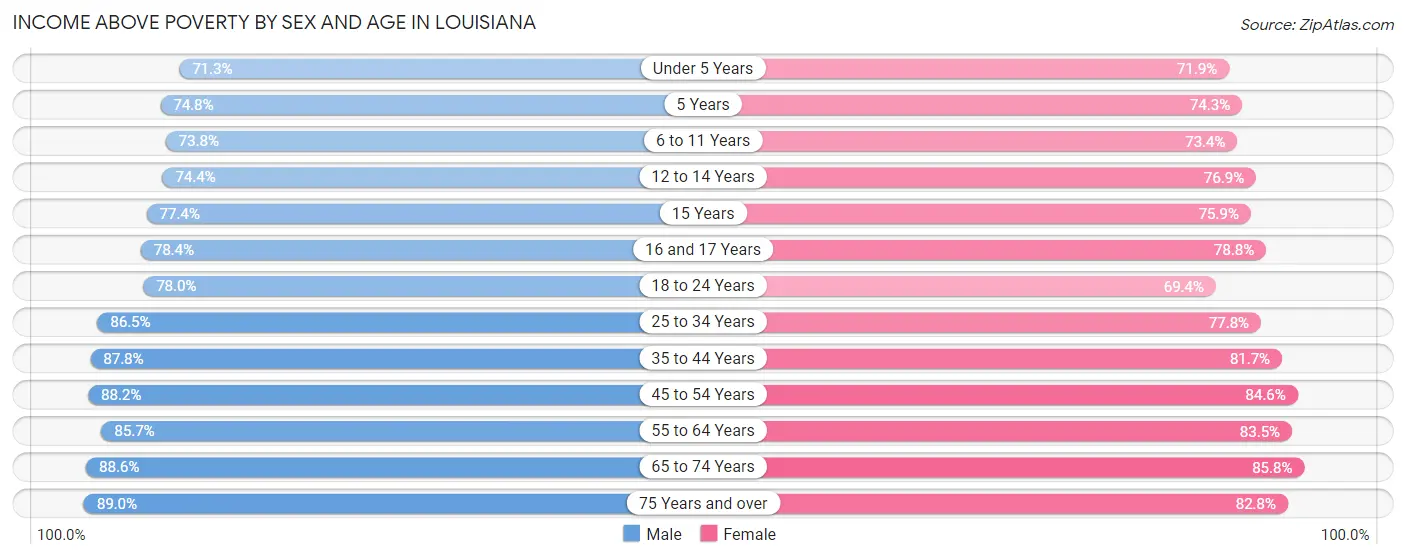
Income Above Poverty by Sex and Age in Louisiana
According to the poverty statistics in Louisiana, males aged 75 years and over and females aged 65 to 74 years are the age groups that are most secure financially, with 89.0% of males and 85.8% of females in these age groups living above the poverty line.
| Age Bracket | Male | Female |
| Under 5 Years | 103,746 (71.3%) | 100,525 (71.9%) |
| 5 Years | 22,010 (74.8%) | 20,541 (74.3%) |
| 6 to 11 Years | 133,031 (73.8%) | 127,001 (73.4%) |
| 12 to 14 Years | 72,135 (74.4%) | 71,518 (76.9%) |
| 15 Years | 24,836 (77.4%) | 22,038 (75.9%) |
| 16 and 17 Years | 48,274 (78.4%) | 46,766 (78.7%) |
| 18 to 24 Years | 156,922 (78.0%) | 135,958 (69.4%) |
| 25 to 34 Years | 259,421 (86.5%) | 245,931 (77.8%) |
| 35 to 44 Years | 250,700 (87.8%) | 246,152 (81.7%) |
| 45 to 54 Years | 228,323 (88.2%) | 232,362 (84.6%) |
| 55 to 64 Years | 241,666 (85.7%) | 257,401 (83.5%) |
| 65 to 74 Years | 182,747 (88.6%) | 204,270 (85.8%) |
| 75 Years and over | 101,516 (89.0%) | 135,965 (82.8%) |
| Total | 1,825,327 (83.2%) | 1,846,428 (79.6%) |
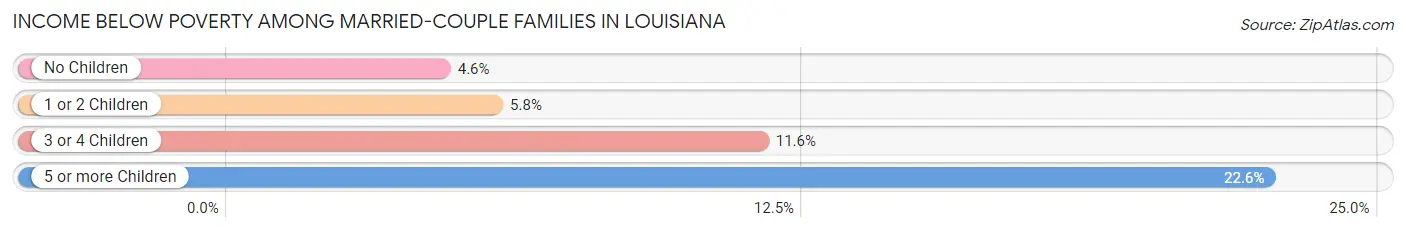
Income Below Poverty Among Married-Couple Families in Louisiana
The poverty statistics for married-couple families in Louisiana show that 5.7% or 42,897 of the total 755,959 families live below the poverty line. Families with 5 or more children have the highest poverty rate of 22.6%, comprising of 1,224 families. On the other hand, families with no children have the lowest poverty rate of 4.6%, which includes 20,804 families.
| Children | Above Poverty | Below Poverty |
| No Children | 428,819 (95.4%) | 20,804 (4.6%) |
| 1 or 2 Children | 226,283 (94.2%) | 13,845 (5.8%) |
| 3 or 4 Children | 53,765 (88.4%) | 7,024 (11.6%) |
| 5 or more Children | 4,195 (77.4%) | 1,224 (22.6%) |
| Total | 713,062 (94.3%) | 42,897 (5.7%) |
Income Below Poverty Among Single-Parent Households in Louisiana
According to the poverty data in Louisiana, 20.0% or 18,201 single-father households and 34.7% or 94,957 single-mother households are living below the poverty line. Among single-father households, those with 5 or more children have the highest poverty rate, with 213 households (40.8%) experiencing poverty. Likewise, among single-mother households, those with 5 or more children have the highest poverty rate, with 2,629 households (78.8%) falling below the poverty line.
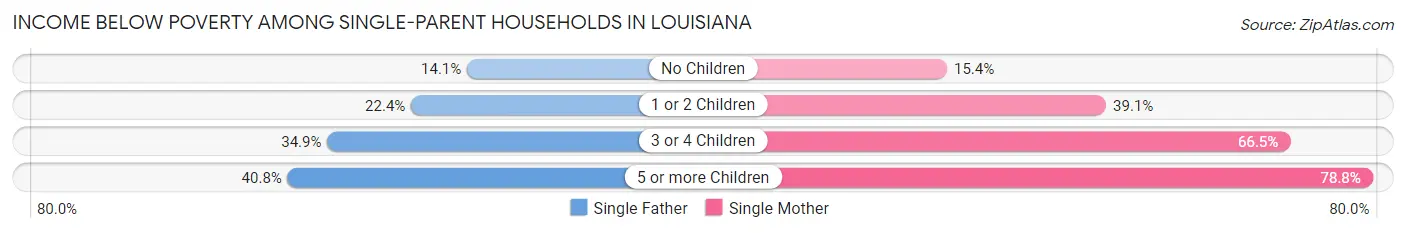
| Children | Single Father | Single Mother |
| No Children | 5,523 (14.1%) | 14,846 (15.4%) |
| 1 or 2 Children | 9,765 (22.4%) | 54,547 (39.1%) |
| 3 or 4 Children | 2,700 (34.9%) | 22,935 (66.5%) |
| 5 or more Children | 213 (40.8%) | 2,629 (78.8%) |
| Total | 18,201 (20.0%) | 94,957 (34.7%) |
Income Below Poverty Among Married-Couple vs Single-Parent Households in Louisiana
The poverty data for Louisiana shows that 42,897 of the married-couple family households (5.7%) and 113,158 of the single-parent households (31.0%) are living below the poverty level. Within the married-couple family households, those with 5 or more children have the highest poverty rate, with 1,224 households (22.6%) falling below the poverty line. Among the single-parent households, those with 5 or more children have the highest poverty rate, with 2,842 household (73.7%) living below poverty.
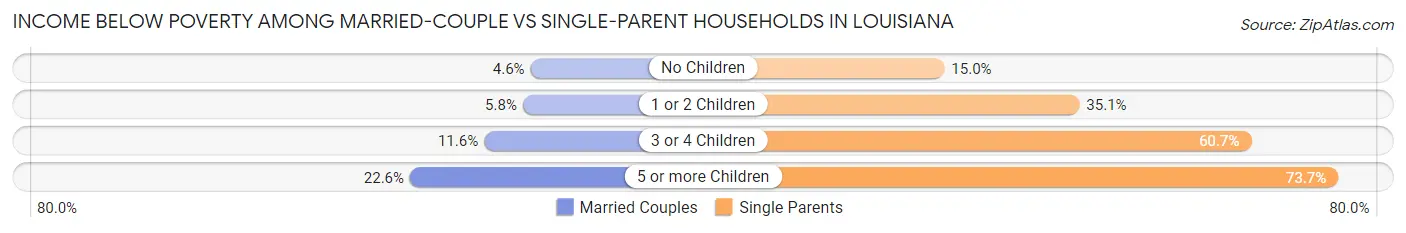
| Children | Married-Couple Families | Single-Parent Households |
| No Children | 20,804 (4.6%) | 20,369 (15.0%) |
| 1 or 2 Children | 13,845 (5.8%) | 64,312 (35.1%) |
| 3 or 4 Children | 7,024 (11.6%) | 25,635 (60.7%) |
| 5 or more Children | 1,224 (22.6%) | 2,842 (73.7%) |
| Total | 42,897 (5.7%) | 113,158 (31.0%) |
Largest Zip Codes by Population in Louisiana
The largest zip codes in Louisiana by population are 70726 (60,707), 70072 (55,332), 70065 (50,210), 70769 (48,856), and 70301 (47,429).
1.70726
60,707 (1.31%)
2.70072
55,332 (1.19%)
3.70065
50,210 (1.08%)
4.70769
48,856 (1.05%)
5.70301
47,429 (1.02%)
6.70737
45,958 (0.99%)
7.70816
44,610 (0.96%)
8.71111
42,953 (0.93%)
9.70056
42,627 (0.92%)
10.70810
42,219 (0.91%)
11.70605
40,870 (0.88%)
12.70058
40,856 (0.88%)
13.70433
40,598 (0.87%)
14.70003
40,529 (0.87%)
15.70001
40,071 (0.86%)
16.71203
40,063 (0.86%)
17.70508
39,962 (0.86%)
18.70506
39,926 (0.86%)
19.70458
39,555 (0.85%)
20.70570
38,498 (0.83%)
21.70560
37,763 (0.81%)
22.70118
36,800 (0.79%)
23.70808
36,716 (0.79%)
24.70119
36,028 (0.78%)
25.71360
35,832 (0.77%)
26.70122
35,147 (0.76%)
27.71291
34,606 (0.75%)
28.71107
33,632 (0.72%)
29.70817
33,478 (0.72%)
30.71106
33,470 (0.72%)
Largest Cities by Population in Louisiana
The largest cities in Louisiana by population are New Orleans (380,408), Baton Rouge (225,500), Shreveport (186,183), Metairie (140,046), and Lafayette (121,706).
380,408 (8.20%)
225,500 (4.86%)
186,183 (4.01%)
4.Metairie
140,046 (3.02%)
121,706 (2.62%)
82,430 (1.78%)
7.Kenner
65,785 (1.42%)
62,971 (1.36%)
9.Monroe
47,631 (1.03%)
10.Alexandria
45,133 (0.97%)
11.Prairieville
34,215 (0.74%)
12.Houma
33,094 (0.71%)
13.Marrero
32,003 (0.69%)
14.Central
29,518 (0.64%)
15.Laplace
28,956 (0.62%)
16.Slidell
28,690 (0.62%)
17.New Iberia
28,363 (0.61%)
18.Terrytown
26,105 (0.56%)
19.Ruston
22,282 (0.48%)
20.Chalmette
22,192 (0.48%)
21.Harvey
21,485 (0.46%)
22.Sulphur
21,286 (0.46%)
23.Bayou Cane
21,142 (0.46%)
24.Hammond
20,239 (0.44%)
25.Zachary
19,401 (0.42%)
26.Shenandoah
18,561 (0.40%)
27.Natchitoches
17,908 (0.39%)
28.Gretna
17,640 (0.38%)
29.Estelle
17,091 (0.37%)
30.Youngsville
15,990 (0.34%)
Largest Counties by Population in Louisiana
The largest counties in Louisiana by population are East Baton Rouge Parish (454,369), Jefferson Parish (436,171), Orleans Parish (380,408), St. Tammany Parish (266,168), and Lafayette Parish (243,175).
454,369 (9.79%)
436,171 (9.40%)
380,408 (8.20%)
266,168 (5.74%)
243,175 (5.24%)
236,259 (5.09%)
210,770 (4.54%)
159,585 (3.44%)
143,425 (3.09%)
133,953 (2.89%)
129,536 (2.79%)
128,877 (2.78%)
126,973 (2.74%)
108,862 (2.35%)
97,220 (2.10%)
82,574 (1.78%)
69,958 (1.51%)
57,674 (1.24%)
57,202 (1.23%)
52,191 (1.12%)
51,856 (1.12%)
49,114 (1.06%)
48,452 (1.04%)
48,323 (1.04%)
45,514 (0.98%)
44,038 (0.95%)
41,986 (0.90%)
39,529 (0.85%)
37,478 (0.81%)
36,761 (0.79%)
Race in Louisiana
The most populous races in Louisiana are White / Caucasian (2,758,714 | 59.5%), Black / African American (1,464,582 | 31.6%), and Hispanic or Latino (255,584 | 5.5%).
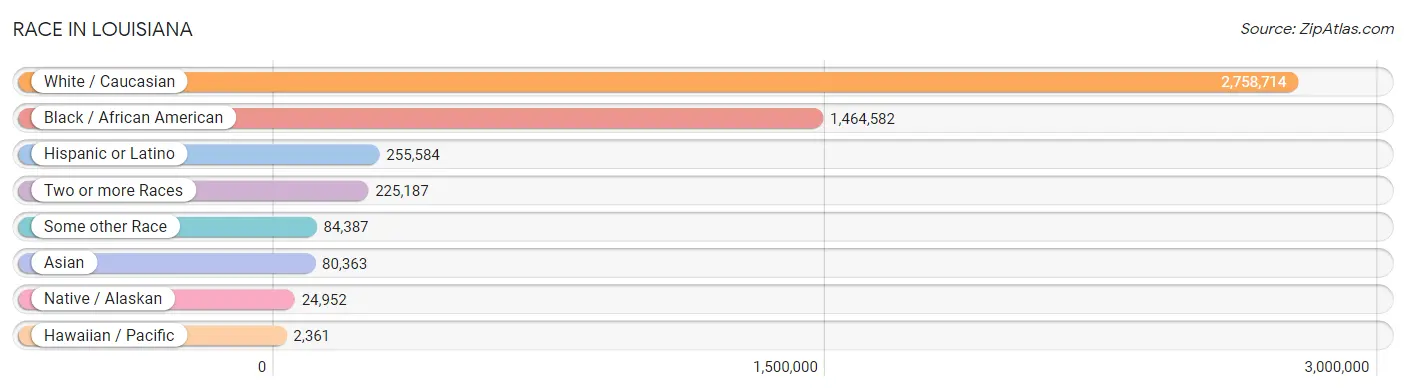
| Race | # Population | % Population |
| Asian | 80,363 | 1.7% |
| Black / African American | 1,464,582 | 31.6% |
| Hawaiian / Pacific | 2,361 | 0.1% |
| Hispanic or Latino | 255,584 | 5.5% |
| Native / Alaskan | 24,952 | 0.5% |
| White / Caucasian | 2,758,714 | 59.5% |
| Two or more Races | 225,187 | 4.9% |
| Some other Race | 84,387 | 1.8% |
| Total | 4,640,546 | 100.0% |
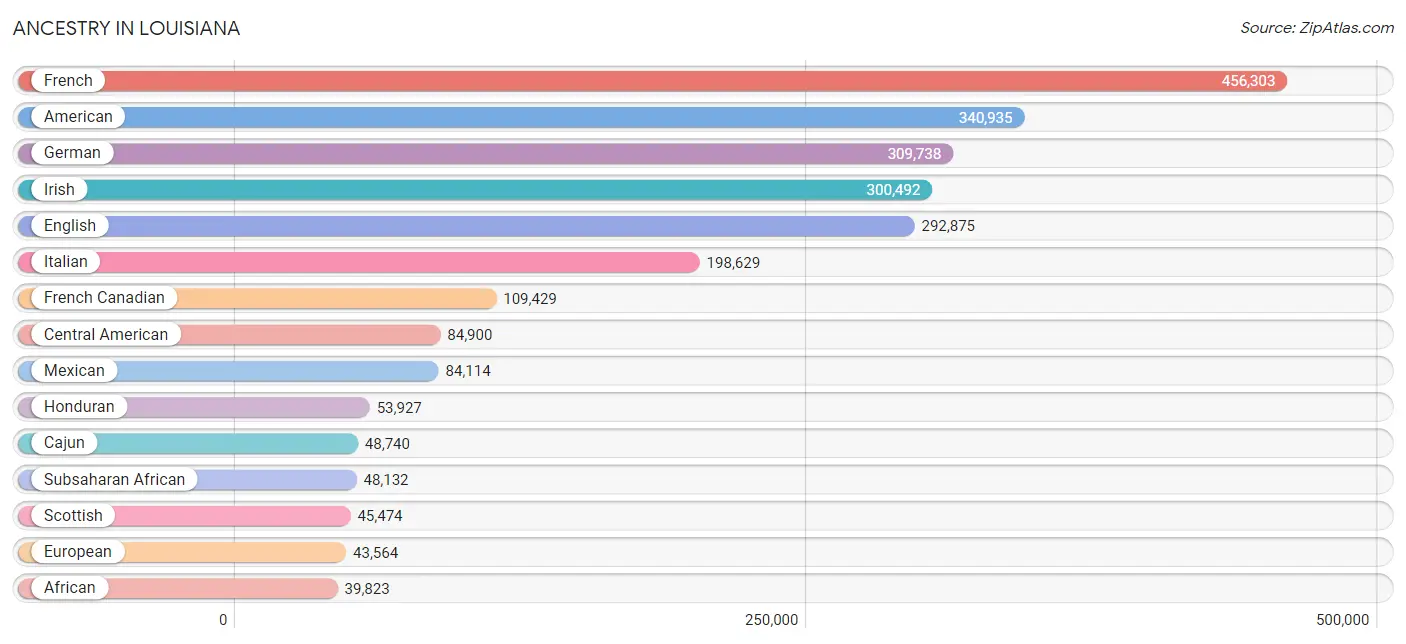
Ancestry in Louisiana
The most populous ancestries reported in Louisiana are French (456,303 | 9.8%), American (340,935 | 7.3%), German (309,738 | 6.7%), Irish (300,492 | 6.5%), and English (292,875 | 6.3%), together accounting for 36.6% of all Louisiana residents.
| Ancestry | # Population | % Population |
| Afghan | 34 | 0.0% |
| African | 39,823 | 0.9% |
| Alaska Native | 77 | 0.0% |
| Alaskan Athabascan | 60 | 0.0% |
| Albanian | 202 | 0.0% |
| Aleut | 29 | 0.0% |
| Alsatian | 66 | 0.0% |
| American | 340,935 | 7.3% |
| Apache | 964 | 0.0% |
| Arab | 21,822 | 0.5% |
| Arapaho | 140 | 0.0% |
| Argentinean | 619 | 0.0% |
| Armenian | 566 | 0.0% |
| Assyrian / Chaldean / Syriac | 33 | 0.0% |
| Australian | 660 | 0.0% |
| Austrian | 2,597 | 0.1% |
| Bahamian | 170 | 0.0% |
| Bangladeshi | 39 | 0.0% |
| Barbadian | 213 | 0.0% |
| Basque | 327 | 0.0% |
| Belgian | 3,444 | 0.1% |
| Belizean | 1,144 | 0.0% |
| Bermudan | 106 | 0.0% |
| Bhutanese | 5,198 | 0.1% |
| Blackfeet | 2,123 | 0.1% |
| Bolivian | 479 | 0.0% |
| Brazilian | 2,757 | 0.1% |
| British | 15,651 | 0.3% |
| British West Indian | 704 | 0.0% |
| Bulgarian | 580 | 0.0% |
| Burmese | 4,919 | 0.1% |
| Cajun | 48,740 | 1.1% |
| Cambodian | 26 | 0.0% |
| Canadian | 3,506 | 0.1% |
| Cape Verdean | 45 | 0.0% |
| Carpatho Rusyn | 6 | 0.0% |
| Celtic | 175 | 0.0% |
| Central American | 84,900 | 1.8% |
| Central American Indian | 2,808 | 0.1% |
| Cherokee | 8,752 | 0.2% |
| Cheyenne | 72 | 0.0% |
| Chickasaw | 506 | 0.0% |
| Chilean | 535 | 0.0% |
| Chinese | 2 | 0.0% |
| Chippewa | 200 | 0.0% |
| Choctaw | 5,617 | 0.1% |
| Colombian | 3,733 | 0.1% |
| Comanche | 177 | 0.0% |
| Costa Rican | 1,596 | 0.0% |
| Cree | 39 | 0.0% |
| Creek | 610 | 0.0% |
| Croatian | 2,860 | 0.1% |
| Crow | 88 | 0.0% |
| Cuban | 11,865 | 0.3% |
| Cypriot | 14 | 0.0% |
| Czech | 3,882 | 0.1% |
| Czechoslovakian | 1,415 | 0.0% |
| Danish | 2,780 | 0.1% |
| Delaware | 85 | 0.0% |
| Dominican | 6,862 | 0.2% |
| Dutch | 16,722 | 0.4% |
| Dutch West Indian | 33 | 0.0% |
| Eastern European | 4,171 | 0.1% |
| Ecuadorian | 1,797 | 0.0% |
| Egyptian | 2,253 | 0.1% |
| English | 292,875 | 6.3% |
| Estonian | 253 | 0.0% |
| Ethiopian | 1,235 | 0.0% |
| European | 43,564 | 0.9% |
| Fijian | 51 | 0.0% |
| Filipino | 617 | 0.0% |
| Finnish | 1,277 | 0.0% |
| French | 456,303 | 9.8% |
| French American Indian | 1,134 | 0.0% |
| French Canadian | 109,429 | 2.4% |
| German | 309,738 | 6.7% |
| German Russian | 18 | 0.0% |
| Ghanaian | 336 | 0.0% |
| Greek | 6,068 | 0.1% |
| Guamanian / Chamorro | 879 | 0.0% |
| Guatemalan | 9,281 | 0.2% |
| Guyanese | 418 | 0.0% |
| Haitian | 4,035 | 0.1% |
| Honduran | 53,927 | 1.2% |
| Hopi | 22 | 0.0% |
| Houma | 9,282 | 0.2% |
| Hungarian | 5,421 | 0.1% |
| Icelander | 213 | 0.0% |
| Indian (Asian) | 17,049 | 0.4% |
| Indonesian | 335 | 0.0% |
| Inupiat | 67 | 0.0% |
| Iranian | 1,857 | 0.0% |
| Iraqi | 444 | 0.0% |
| Irish | 300,492 | 6.5% |
| Iroquois | 545 | 0.0% |
| Israeli | 1,910 | 0.0% |
| Italian | 198,629 | 4.3% |
| Jamaican | 2,966 | 0.1% |
| Japanese | 1,347 | 0.0% |
| Jordanian | 1,743 | 0.0% |
| Kenyan | 616 | 0.0% |
| Kiowa | 53 | 0.0% |
| Korean | 17,245 | 0.4% |
| Laotian | 1,025 | 0.0% |
| Latvian | 298 | 0.0% |
| Lebanese | 6,161 | 0.1% |
| Liberian | 38 | 0.0% |
| Lithuanian | 2,055 | 0.0% |
| Lumbee | 147 | 0.0% |
| Luxembourger | 19 | 0.0% |
| Macedonian | 102 | 0.0% |
| Malaysian | 3,121 | 0.1% |
| Maltese | 115 | 0.0% |
| Menominee | 43 | 0.0% |
| Mexican | 84,114 | 1.8% |
| Mexican American Indian | 2,747 | 0.1% |
| Mongolian | 88 | 0.0% |
| Moroccan | 540 | 0.0% |
| Native Hawaiian | 1,904 | 0.0% |
| Navajo | 874 | 0.0% |
| Nepalese | 83 | 0.0% |
| New Zealander | 10 | 0.0% |
| Nicaraguan | 8,068 | 0.2% |
| Nigerian | 3,362 | 0.1% |
| Northern European | 3,814 | 0.1% |
| Norwegian | 11,575 | 0.3% |
| Okinawan | 15 | 0.0% |
| Osage | 68 | 0.0% |
| Paiute | 6 | 0.0% |
| Pakistani | 1,897 | 0.0% |
| Palestinian | 3,235 | 0.1% |
| Panamanian | 1,554 | 0.0% |
| Paraguayan | 57 | 0.0% |
| Pennsylvania German | 230 | 0.0% |
| Peruvian | 1,542 | 0.0% |
| Polish | 20,959 | 0.4% |
| Portuguese | 3,993 | 0.1% |
| Potawatomi | 104 | 0.0% |
| Pueblo | 163 | 0.0% |
| Puerto Rican | 14,194 | 0.3% |
| Romanian | 2,335 | 0.1% |
| Russian | 7,139 | 0.2% |
| Salvadoran | 8,067 | 0.2% |
| Samoan | 963 | 0.0% |
| Scandinavian | 5,904 | 0.1% |
| Scotch-Irish | 29,483 | 0.6% |
| Scottish | 45,474 | 1.0% |
| Seminole | 293 | 0.0% |
| Senegalese | 156 | 0.0% |
| Serbian | 518 | 0.0% |
| Shoshone | 10 | 0.0% |
| Sierra Leonean | 4 | 0.0% |
| Sioux | 942 | 0.0% |
| Slavic | 416 | 0.0% |
| Slovak | 1,221 | 0.0% |
| Slovene | 572 | 0.0% |
| Somali | 77 | 0.0% |
| South African | 359 | 0.0% |
| South American | 11,117 | 0.2% |
| South American Indian | 237 | 0.0% |
| Spaniard | 9,662 | 0.2% |
| Spanish | 17,711 | 0.4% |
| Spanish American | 515 | 0.0% |
| Spanish American Indian | 236 | 0.0% |
| Sri Lankan | 31,735 | 0.7% |
| Subsaharan African | 48,132 | 1.0% |
| Sudanese | 53 | 0.0% |
| Swedish | 11,477 | 0.3% |
| Swiss | 2,928 | 0.1% |
| Syrian | 1,225 | 0.0% |
| Thai | 14,105 | 0.3% |
| Tlingit-Haida | 33 | 0.0% |
| Tongan | 51 | 0.0% |
| Trinidadian and Tobagonian | 1,336 | 0.0% |
| Tsimshian | 12 | 0.0% |
| Turkish | 1,129 | 0.0% |
| U.S. Virgin Islander | 24 | 0.0% |
| Ugandan | 328 | 0.0% |
| Ukrainian | 2,191 | 0.1% |
| Uruguayan | 151 | 0.0% |
| Ute | 4 | 0.0% |
| Venezuelan | 2,033 | 0.0% |
| Vietnamese | 880 | 0.0% |
| Welsh | 12,625 | 0.3% |
| West Indian | 1,922 | 0.0% |
| Yaqui | 73 | 0.0% |
| Yugoslavian | 689 | 0.0% |
| Zimbabwean | 72 | 0.0% | View All 188 Rows |
Immigrants in Louisiana
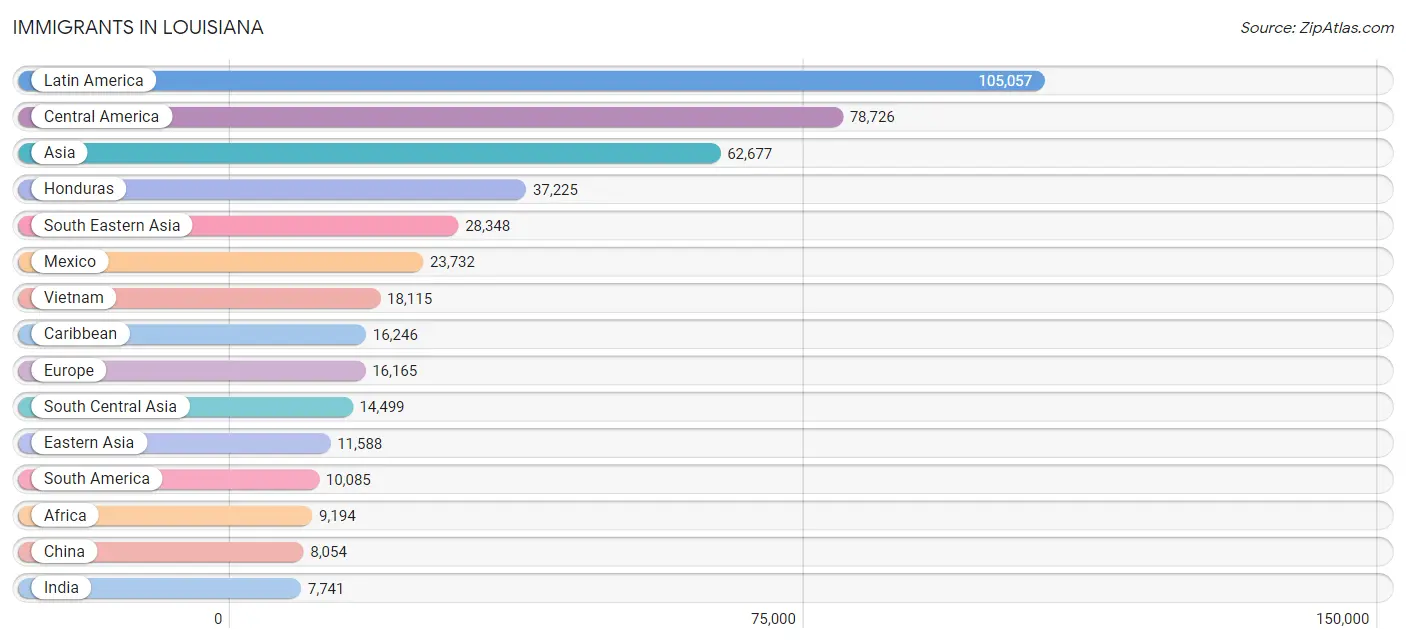
The most numerous immigrant groups reported in Louisiana came from Latin America (105,057 | 2.3%), Central America (78,726 | 1.7%), Asia (62,677 | 1.3%), Honduras (37,225 | 0.8%), and South Eastern Asia (28,348 | 0.6%), together accounting for 6.7% of all Louisiana residents.
| Immigration Origin | # Population | % Population |
| Afghanistan | 79 | 0.0% |
| Africa | 9,194 | 0.2% |
| Albania | 68 | 0.0% |
| Argentina | 286 | 0.0% |
| Armenia | 5 | 0.0% |
| Asia | 62,677 | 1.3% |
| Australia | 369 | 0.0% |
| Austria | 115 | 0.0% |
| Azores | 23 | 0.0% |
| Bahamas | 48 | 0.0% |
| Bangladesh | 1,446 | 0.0% |
| Barbados | 157 | 0.0% |
| Belarus | 43 | 0.0% |
| Belgium | 327 | 0.0% |
| Belize | 864 | 0.0% |
| Bolivia | 318 | 0.0% |
| Bosnia and Herzegovina | 203 | 0.0% |
| Brazil | 2,923 | 0.1% |
| Bulgaria | 372 | 0.0% |
| Cambodia | 483 | 0.0% |
| Cameroon | 505 | 0.0% |
| Canada | 2,933 | 0.1% |
| Caribbean | 16,246 | 0.4% |
| Central America | 78,726 | 1.7% |
| Chile | 227 | 0.0% |
| China | 8,054 | 0.2% |
| Colombia | 1,918 | 0.0% |
| Congo | 19 | 0.0% |
| Costa Rica | 770 | 0.0% |
| Croatia | 247 | 0.0% |
| Cuba | 6,172 | 0.1% |
| Czechoslovakia | 136 | 0.0% |
| Denmark | 65 | 0.0% |
| Dominica | 345 | 0.0% |
| Dominican Republic | 3,999 | 0.1% |
| Eastern Africa | 2,124 | 0.1% |
| Eastern Asia | 11,588 | 0.3% |
| Eastern Europe | 5,320 | 0.1% |
| Ecuador | 1,196 | 0.0% |
| Egypt | 1,613 | 0.0% |
| El Salvador | 4,241 | 0.1% |
| England | 1,517 | 0.0% |
| Eritrea | 37 | 0.0% |
| Ethiopia | 892 | 0.0% |
| Europe | 16,165 | 0.4% |
| Fiji | 7 | 0.0% |
| France | 968 | 0.0% |
| Germany | 3,186 | 0.1% |
| Ghana | 288 | 0.0% |
| Greece | 366 | 0.0% |
| Guatemala | 5,576 | 0.1% |
| Guyana | 505 | 0.0% |
| Haiti | 2,009 | 0.0% |
| Honduras | 37,225 | 0.8% |
| Hong Kong | 328 | 0.0% |
| Hungary | 155 | 0.0% |
| India | 7,741 | 0.2% |
| Indonesia | 399 | 0.0% |
| Iran | 1,368 | 0.0% |
| Iraq | 513 | 0.0% |
| Ireland | 380 | 0.0% |
| Israel | 901 | 0.0% |
| Italy | 905 | 0.0% |
| Jamaica | 1,460 | 0.0% |
| Japan | 1,577 | 0.0% |
| Jordan | 1,370 | 0.0% |
| Kazakhstan | 126 | 0.0% |
| Kenya | 516 | 0.0% |
| Korea | 1,951 | 0.0% |
| Kuwait | 540 | 0.0% |
| Laos | 1,184 | 0.0% |
| Latin America | 105,057 | 2.3% |
| Latvia | 77 | 0.0% |
| Lebanon | 677 | 0.0% |
| Lithuania | 53 | 0.0% |
| Malaysia | 163 | 0.0% |
| Mexico | 23,732 | 0.5% |
| Middle Africa | 581 | 0.0% |
| Moldova | 267 | 0.0% |
| Morocco | 374 | 0.0% |
| Nepal | 1,299 | 0.0% |
| Netherlands | 632 | 0.0% |
| Nicaragua | 4,115 | 0.1% |
| Nigeria | 2,002 | 0.0% |
| North Macedonia | 61 | 0.0% |
| Northern Africa | 2,668 | 0.1% |
| Northern Europe | 3,759 | 0.1% |
| Norway | 154 | 0.0% |
| Oceania | 616 | 0.0% |
| Pakistan | 2,282 | 0.1% |
| Panama | 866 | 0.0% |
| Peru | 880 | 0.0% |
| Philippines | 6,086 | 0.1% |
| Poland | 267 | 0.0% |
| Portugal | 45 | 0.0% |
| Romania | 844 | 0.0% |
| Russia | 1,435 | 0.0% |
| Saudi Arabia | 383 | 0.0% |
| Scotland | 111 | 0.0% |
| Senegal | 89 | 0.0% |
| Serbia | 156 | 0.0% |
| Sierra Leone | 4 | 0.0% |
| Singapore | 190 | 0.0% |
| Somalia | 9 | 0.0% |
| South Africa | 550 | 0.0% |
| South America | 10,085 | 0.2% |
| South Central Asia | 14,499 | 0.3% |
| South Eastern Asia | 28,348 | 0.6% |
| Southern Europe | 1,786 | 0.0% |
| Spain | 389 | 0.0% |
| Sri Lanka | 108 | 0.0% |
| St. Vincent and the Grenadines | 7 | 0.0% |
| Sudan | 59 | 0.0% |
| Sweden | 132 | 0.0% |
| Switzerland | 57 | 0.0% |
| Syria | 540 | 0.0% |
| Taiwan | 947 | 0.0% |
| Thailand | 1,281 | 0.0% |
| Trinidad and Tobago | 1,420 | 0.0% |
| Turkey | 683 | 0.0% |
| Uganda | 244 | 0.0% |
| Ukraine | 720 | 0.0% |
| Uruguay | 146 | 0.0% |
| Venezuela | 1,538 | 0.0% |
| Vietnam | 18,115 | 0.4% |
| West Indies | 40 | 0.0% |
| Western Africa | 2,848 | 0.1% |
| Western Asia | 6,908 | 0.2% |
| Western Europe | 5,287 | 0.1% |
| Yemen | 935 | 0.0% |
| Zaire | 3 | 0.0% |
| Zimbabwe | 153 | 0.0% | View All 132 Rows |
Sex and Age in Louisiana
Sex and Age in Louisiana
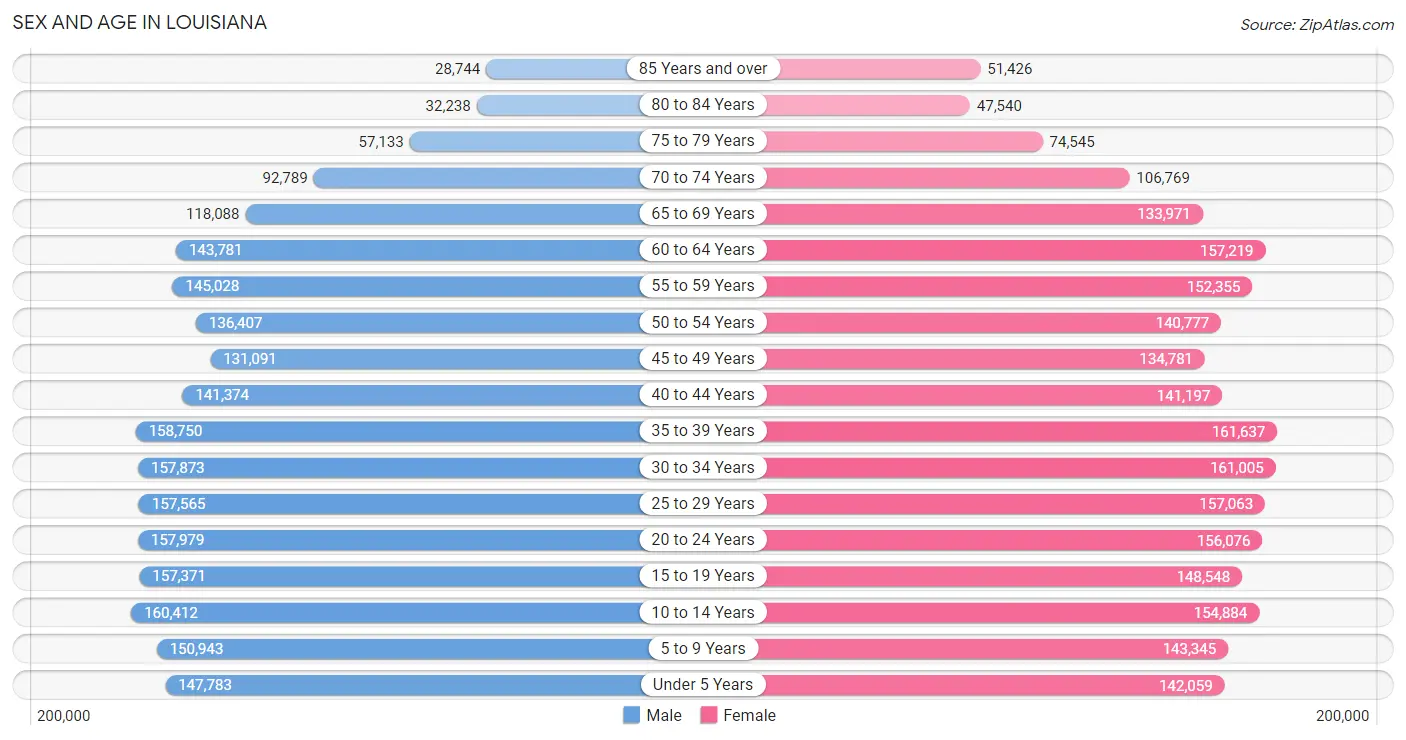
The most populous age groups in Louisiana are 10 to 14 Years (160,412 | 7.0%) for men and 35 to 39 Years (161,637 | 6.8%) for women.
| Age Bracket | Male | Female |
| Under 5 Years | 147,783 (6.5%) | 142,059 (6.0%) |
| 5 to 9 Years | 150,943 (6.6%) | 143,345 (6.1%) |
| 10 to 14 Years | 160,412 (7.0%) | 154,884 (6.6%) |
| 15 to 19 Years | 157,371 (6.9%) | 148,548 (6.3%) |
| 20 to 24 Years | 157,979 (6.9%) | 156,076 (6.6%) |
| 25 to 29 Years | 157,565 (6.9%) | 157,063 (6.6%) |
| 30 to 34 Years | 157,873 (6.9%) | 161,005 (6.8%) |
| 35 to 39 Years | 158,750 (7.0%) | 161,637 (6.8%) |
| 40 to 44 Years | 141,374 (6.2%) | 141,197 (6.0%) |
| 45 to 49 Years | 131,091 (5.8%) | 134,781 (5.7%) |
| 50 to 54 Years | 136,407 (6.0%) | 140,777 (5.9%) |
| 55 to 59 Years | 145,028 (6.4%) | 152,355 (6.4%) |
| 60 to 64 Years | 143,781 (6.3%) | 157,219 (6.7%) |
| 65 to 69 Years | 118,088 (5.2%) | 133,971 (5.7%) |
| 70 to 74 Years | 92,789 (4.1%) | 106,769 (4.5%) |
| 75 to 79 Years | 57,133 (2.5%) | 74,545 (3.2%) |
| 80 to 84 Years | 32,238 (1.4%) | 47,540 (2.0%) |
| 85 Years and over | 28,744 (1.3%) | 51,426 (2.2%) |
| Total | 2,275,349 (100.0%) | 2,365,197 (100.0%) |
Families and Households in Louisiana
Median Family Size in Louisiana
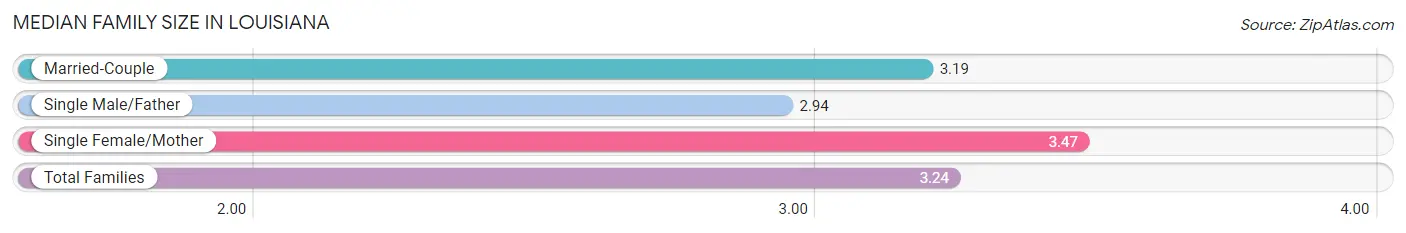
The median family size in Louisiana is 3.24 persons per family, with single female/mother families (273,659 | 24.4%) accounting for the largest median family size of 3.47 persons per family. On the other hand, single male/father families (91,127 | 8.1%) represent the smallest median family size with 2.94 persons per family.
| Family Type | # Families | Family Size |
| Married-Couple | 755,959 (67.4%) | 3.19 |
| Single Male/Father | 91,127 (8.1%) | 2.94 |
| Single Female/Mother | 273,659 (24.4%) | 3.47 |
| Total Families | 1,120,745 (100.0%) | 3.24 |
Median Household Size in Louisiana
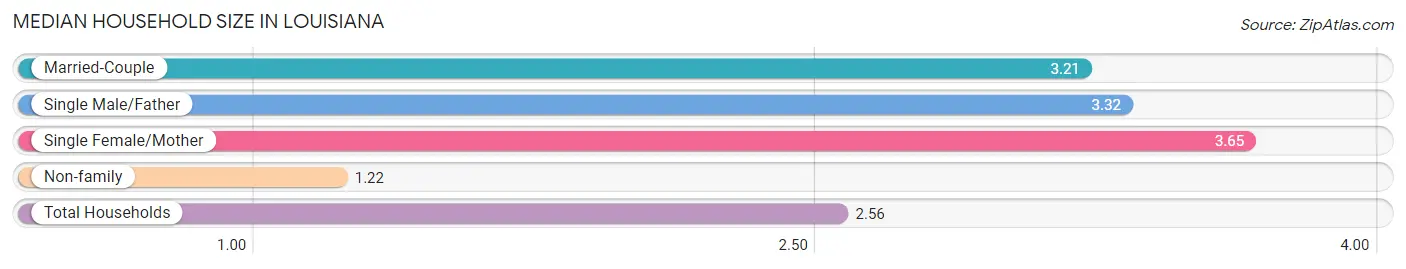
The median household size in Louisiana is 2.56 persons per household, with single female/mother households (273,659 | 15.5%) accounting for the largest median household size of 3.65 persons per household. non-family households (644,519 | 36.5%) represent the smallest median household size with 1.22 persons per household.
| Household Type | # Households | Household Size |
| Married-Couple | 755,959 (42.8%) | 3.21 |
| Single Male/Father | 91,127 (5.2%) | 3.32 |
| Single Female/Mother | 273,659 (15.5%) | 3.65 |
| Non-family | 644,519 (36.5%) | 1.22 |
| Total Households | 1,765,264 (100.0%) | 2.56 |
Household Size by Marriage Status in Louisiana
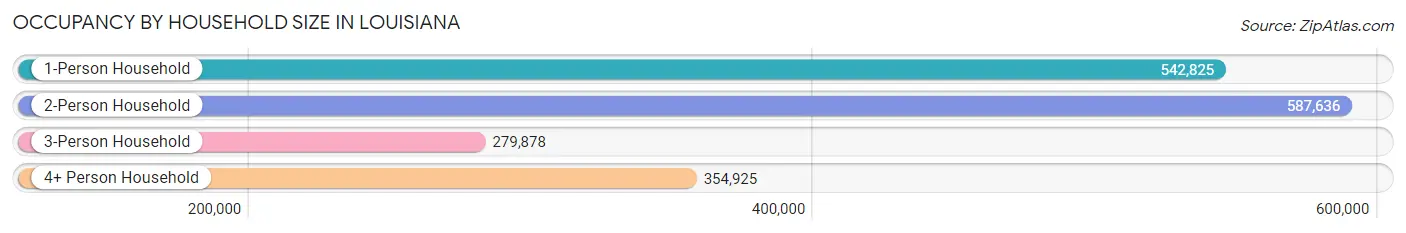
Out of a total of 1,765,264 households in Louisiana, 1,120,745 (63.5%) are family households, while 644,519 (36.5%) are nonfamily households. The most numerous type of family households are 2-person households, comprising 500,396, and the most common type of nonfamily households are 1-person households, comprising 542,825.
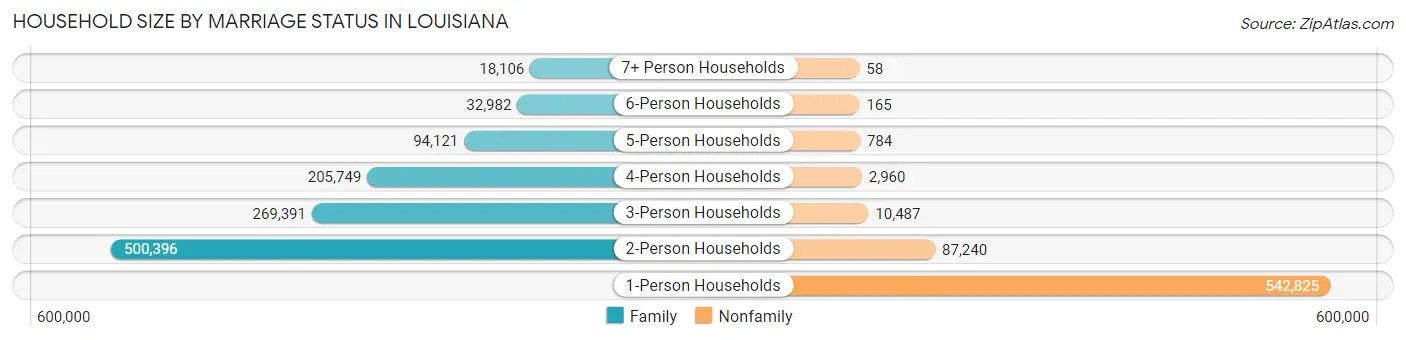
| Household Size | Family Households | Nonfamily Households |
| 1-Person Households | - | 542,825 (30.7%) |
| 2-Person Households | 500,396 (28.3%) | 87,240 (4.9%) |
| 3-Person Households | 269,391 (15.3%) | 10,487 (0.6%) |
| 4-Person Households | 205,749 (11.7%) | 2,960 (0.2%) |
| 5-Person Households | 94,121 (5.3%) | 784 (0.0%) |
| 6-Person Households | 32,982 (1.9%) | 165 (0.0%) |
| 7+ Person Households | 18,106 (1.0%) | 58 (0.0%) |
| Total | 1,120,745 (63.5%) | 644,519 (36.5%) |
Female Fertility in Louisiana
Fertility by Age in Louisiana
Average fertility rate in Louisiana is 55.0 births per 1,000 women. Women in the age bracket of 20 to 34 years have the highest fertility rate with 97.0 births per 1,000 women. Women in the age bracket of 20 to 34 years acount for 75.8% of all women with births.
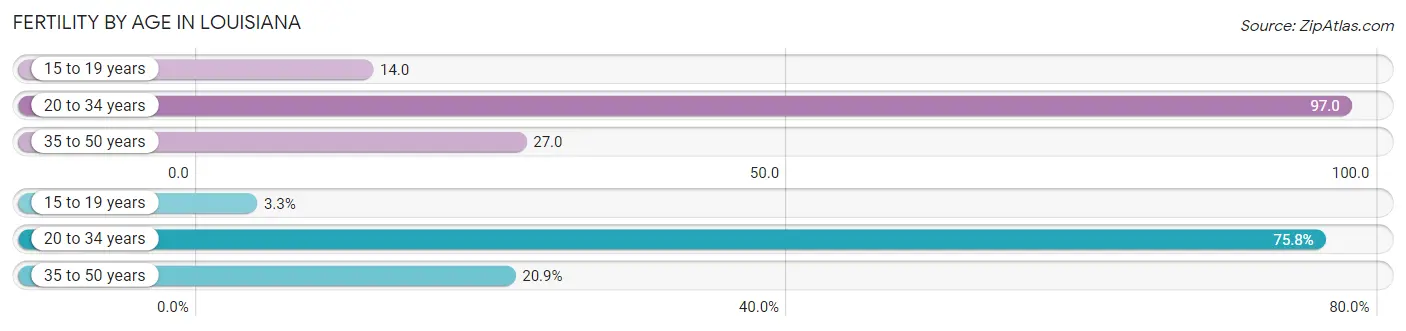
| Age Bracket | Women with Births | Births / 1,000 Women |
| 15 to 19 years | 2,006 (3.3%) | 14.0 |
| 20 to 34 years | 45,815 (75.8%) | 97.0 |
| 35 to 50 years | 12,594 (20.8%) | 27.0 |
| Total | 60,415 (100.0%) | 55.0 |
Fertility by Age by Marriage Status in Louisiana
53.1% of women with births (60,415) in Louisiana are married. The highest percentage of unmarried women with births falls into 15 to 19 years age bracket with 94.9% of them unmarried at the time of birth, while the lowest percentage of unmarried women with births belong to 35 to 50 years age bracket with 28.6% of them unmarried.
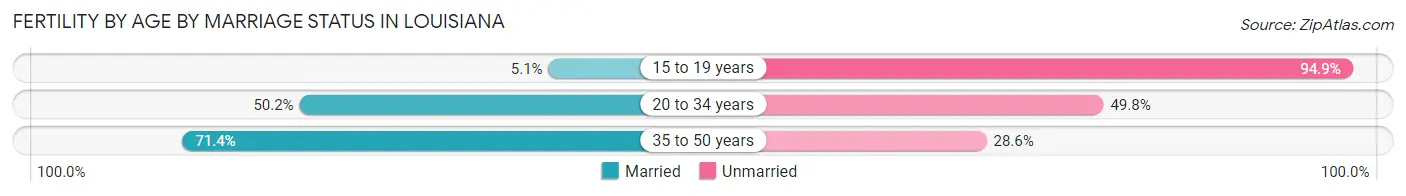
| Age Bracket | Married | Unmarried |
| 15 to 19 years | 102 (5.1%) | 1,904 (94.9%) |
| 20 to 34 years | 22,999 (50.2%) | 22,816 (49.8%) |
| 35 to 50 years | 8,992 (71.4%) | 3,602 (28.6%) |
| Total | 32,080 (53.1%) | 28,335 (46.9%) |
Fertility by Education in Louisiana
Average fertility rate in Louisiana is 55.0 births per 1,000 women. Women with the education attainment of high school diploma have the highest fertility rate of 66.0 births per 1,000 women, while women with the education attainment of less than high school have the lowest fertility at 41.0 births per 1,000 women. Women with the education attainment of college or associate's degree represent 31.1% of all women with births.
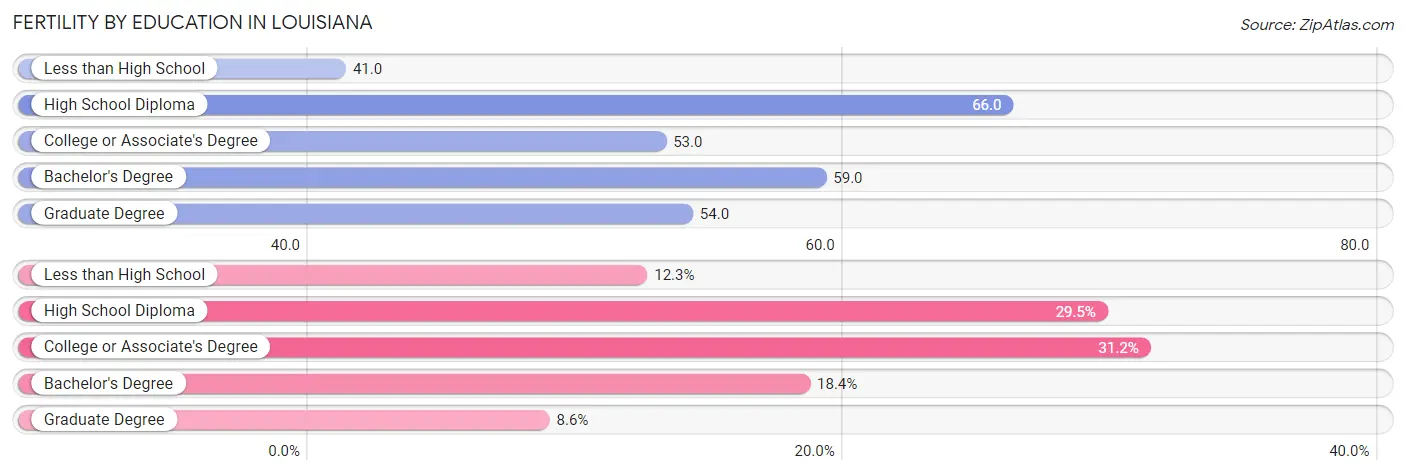
| Educational Attainment | Women with Births | Births / 1,000 Women |
| Less than High School | 7,424 (12.3%) | 41.0 |
| High School Diploma | 17,848 (29.5%) | 66.0 |
| College or Associate's Degree | 18,817 (31.1%) | 53.0 |
| Bachelor's Degree | 11,113 (18.4%) | 59.0 |
| Graduate Degree | 5,213 (8.6%) | 54.0 |
| Total | 60,415 (100.0%) | 55.0 |
Fertility by Education by Marriage Status in Louisiana
46.9% of women with births in Louisiana are unmarried. Women with the educational attainment of graduate degree are most likely to be married with 88.3% of them married at childbirth, while women with the educational attainment of less than high school are least likely to be married with 75.2% of them unmarried at childbirth.
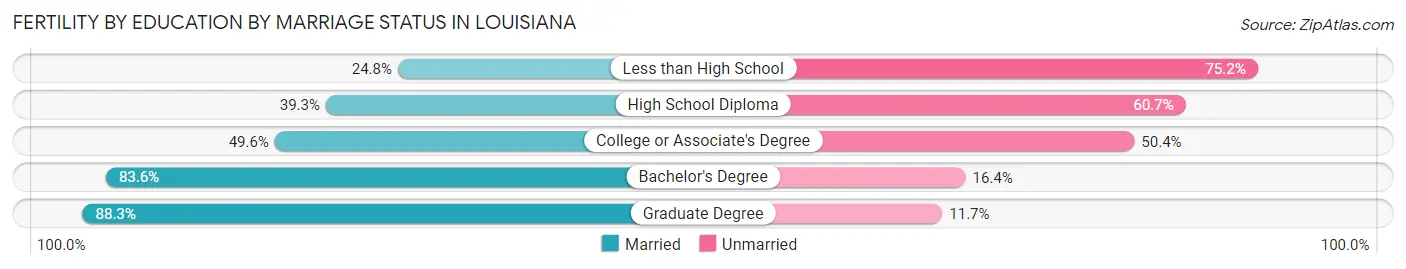
| Educational Attainment | Married | Unmarried |
| Less than High School | 1,841 (24.8%) | 5,583 (75.2%) |
| High School Diploma | 7,014 (39.3%) | 10,834 (60.7%) |
| College or Associate's Degree | 9,333 (49.6%) | 9,484 (50.4%) |
| Bachelor's Degree | 9,290 (83.6%) | 1,823 (16.4%) |
| Graduate Degree | 4,603 (88.3%) | 610 (11.7%) |
| Total | 32,080 (53.1%) | 28,335 (46.9%) |
Employment Characteristics in Louisiana
Employment by Class of Employer in Louisiana
Among the 1,995,269 employed individuals in Louisiana, private company employees (1,325,044 | 66.4%), local government employees (146,148 | 7.3%), and not-for-profit organizations (138,949 | 7.0%) make up the most common classes of employment.
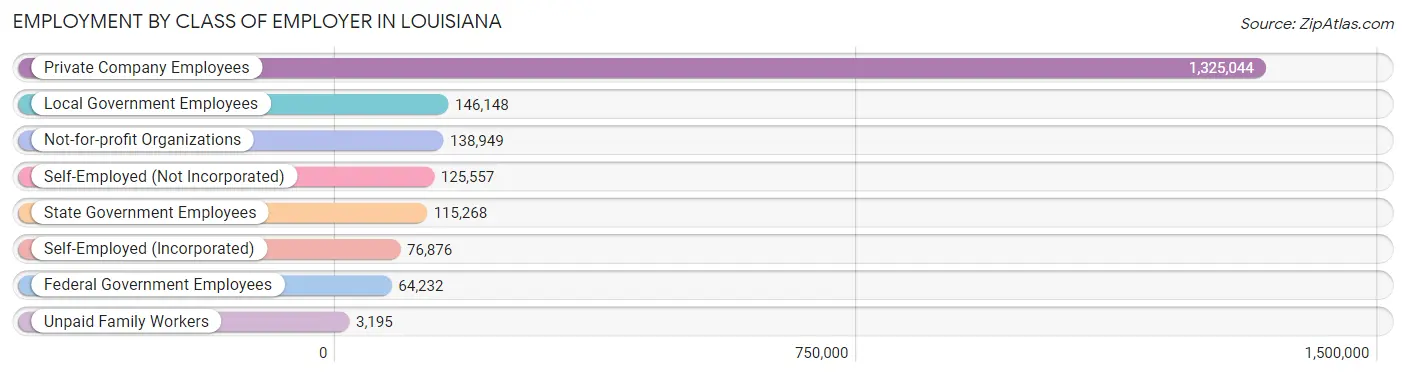
| Employer Class | # Employees | % Employees |
| Private Company Employees | 1,325,044 | 66.4% |
| Self-Employed (Incorporated) | 76,876 | 3.8% |
| Self-Employed (Not Incorporated) | 125,557 | 6.3% |
| Not-for-profit Organizations | 138,949 | 7.0% |
| Local Government Employees | 146,148 | 7.3% |
| State Government Employees | 115,268 | 5.8% |
| Federal Government Employees | 64,232 | 3.2% |
| Unpaid Family Workers | 3,195 | 0.2% |
| Total | 1,995,269 | 100.0% |
Employment Status by Age in Louisiana
According to the labor force statistics for Louisiana, out of the total population over 16 years of age (3,679,895), 59.2% or 2,178,498 individuals are in the labor force, with 6.6% or 143,781 of them unemployed. The age group with the highest labor force participation rate is 35 to 44 years, with 79.5% or 479,352 individuals in the labor force. Within the labor force, the 16 to 19 years age range has the highest percentage of unemployed individuals, with 19.3% or 15,821 of them being unemployed.
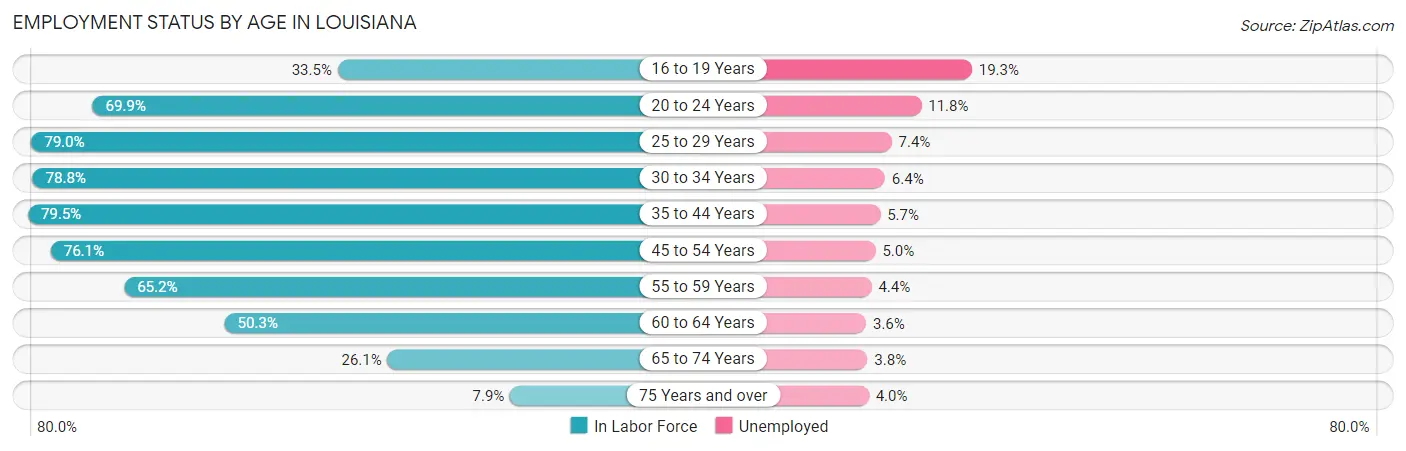
| Age Bracket | In Labor Force | Unemployed |
| 16 to 19 Years | 81,972 (33.5%) | 15,821 (19.3%) |
| 20 to 24 Years | 219,524 (69.9%) | 25,904 (11.8%) |
| 25 to 29 Years | 248,556 (79.0%) | 18,393 (7.4%) |
| 30 to 34 Years | 251,276 (78.8%) | 16,082 (6.4%) |
| 35 to 44 Years | 479,352 (79.5%) | 27,323 (5.7%) |
| 45 to 54 Years | 413,266 (76.1%) | 20,663 (5.0%) |
| 55 to 59 Years | 193,894 (65.2%) | 8,531 (4.4%) |
| 60 to 64 Years | 151,403 (50.3%) | 5,451 (3.6%) |
| 65 to 74 Years | 117,872 (26.1%) | 4,479 (3.8%) |
| 75 Years and over | 23,038 (7.9%) | 922 (4.0%) |
| Total | 2,178,498 (59.2%) | 143,781 (6.6%) |
Employment Status by Educational Attainment in Louisiana
According to labor force statistics for Louisiana, 73.1% of individuals (1,738,247) out of the total population between 25 and 64 years of age (2,377,903) are in the labor force, with 5.5% or 95,604 of them being unemployed. The group with the highest labor force participation rate are those with the educational attainment of bachelor's degree or higher, with 85.8% or 547,862 individuals in the labor force. Within the labor force, individuals with less than high school education have the highest percentage of unemployment, with 12.5% or 18,635 of them being unemployed.
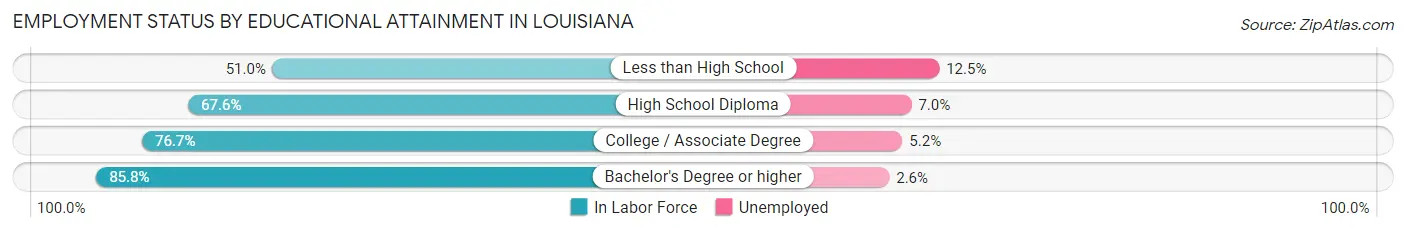
| Educational Attainment | In Labor Force | Unemployed |
| Less than High School | 149,079 (51.0%) | 36,539 (12.5%) |
| High School Diploma | 514,238 (67.6%) | 53,249 (7.0%) |
| College / Associate Degree | 526,431 (76.7%) | 35,690 (5.2%) |
| Bachelor's Degree or higher | 547,862 (85.8%) | 16,602 (2.6%) |
| Total | 1,738,247 (73.1%) | 130,785 (5.5%) |
Employment Occupations by Sex in Louisiana
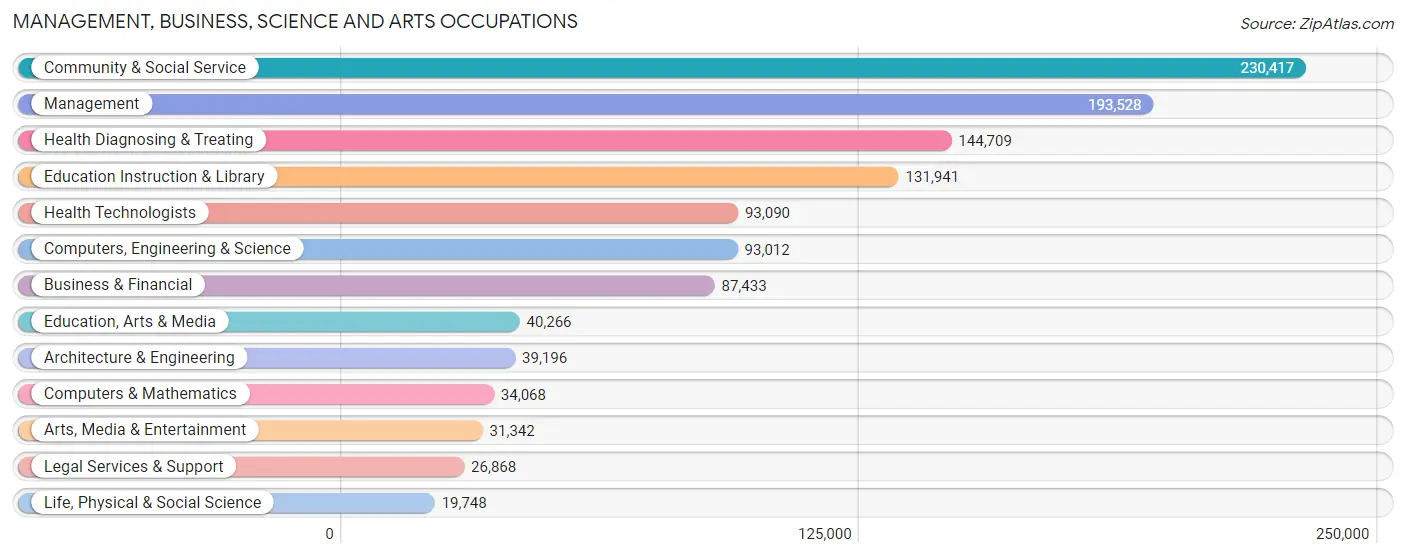
Management, Business, Science and Arts Occupations
The most common Management, Business, Science and Arts occupations in Louisiana are Community & Social Service (230,417 | 11.4%), Management (193,528 | 9.6%), Health Diagnosing & Treating (144,709 | 7.2%), Education Instruction & Library (131,941 | 6.5%), and Health Technologists (93,090 | 4.6%).
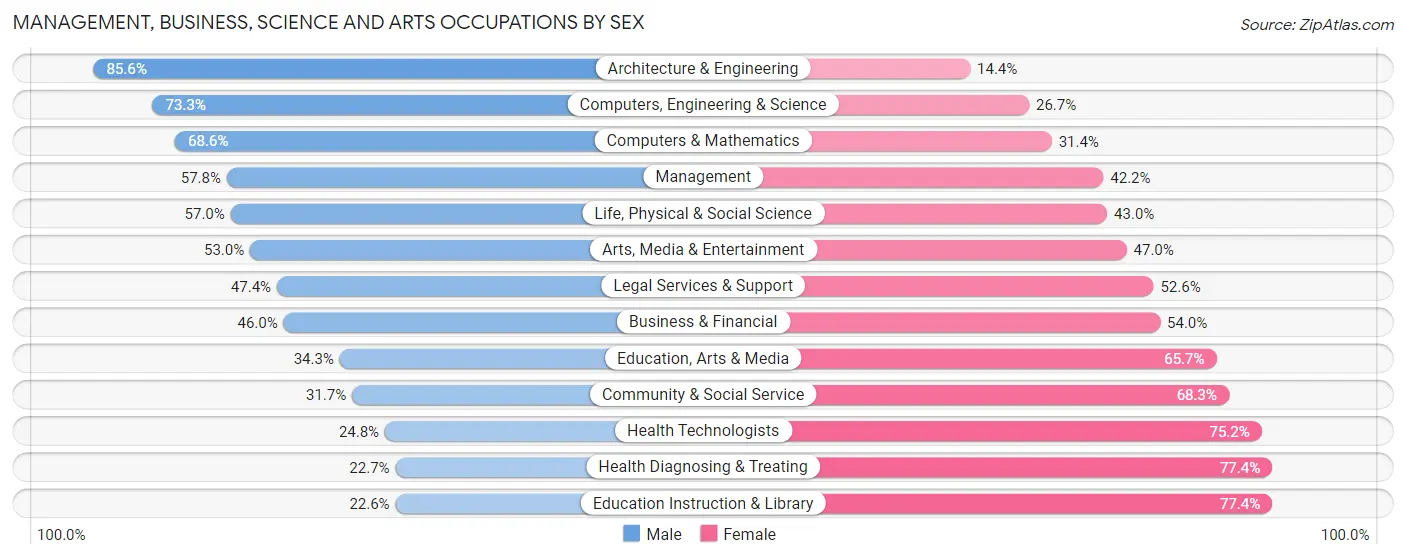
Management, Business, Science and Arts Occupations by Sex
Within the Management, Business, Science and Arts occupations in Louisiana, the most male-oriented occupations are Architecture & Engineering (85.6%), Computers, Engineering & Science (73.3%), and Computers & Mathematics (68.6%), while the most female-oriented occupations are Education Instruction & Library (77.4%), Health Diagnosing & Treating (77.3%), and Health Technologists (75.2%).
| Occupation | Male | Female |
| Management | 111,897 (57.8%) | 81,631 (42.2%) |
| Business & Financial | 40,208 (46.0%) | 47,225 (54.0%) |
| Computers, Engineering & Science | 68,194 (73.3%) | 24,818 (26.7%) |
| Computers & Mathematics | 23,371 (68.6%) | 10,697 (31.4%) |
| Architecture & Engineering | 33,560 (85.6%) | 5,636 (14.4%) |
| Life, Physical & Social Science | 11,263 (57.0%) | 8,485 (43.0%) |
| Community & Social Service | 73,000 (31.7%) | 157,417 (68.3%) |
| Education, Arts & Media | 13,797 (34.3%) | 26,469 (65.7%) |
| Legal Services & Support | 12,727 (47.4%) | 14,141 (52.6%) |
| Education Instruction & Library | 29,875 (22.6%) | 102,066 (77.4%) |
| Arts, Media & Entertainment | 16,601 (53.0%) | 14,741 (47.0%) |
| Health Diagnosing & Treating | 32,771 (22.7%) | 111,938 (77.3%) |
| Health Technologists | 23,110 (24.8%) | 69,980 (75.2%) |
| Total (Category) | 326,070 (43.5%) | 423,029 (56.5%) |
| Total (Overall) | 1,041,142 (51.6%) | 978,057 (48.4%) |
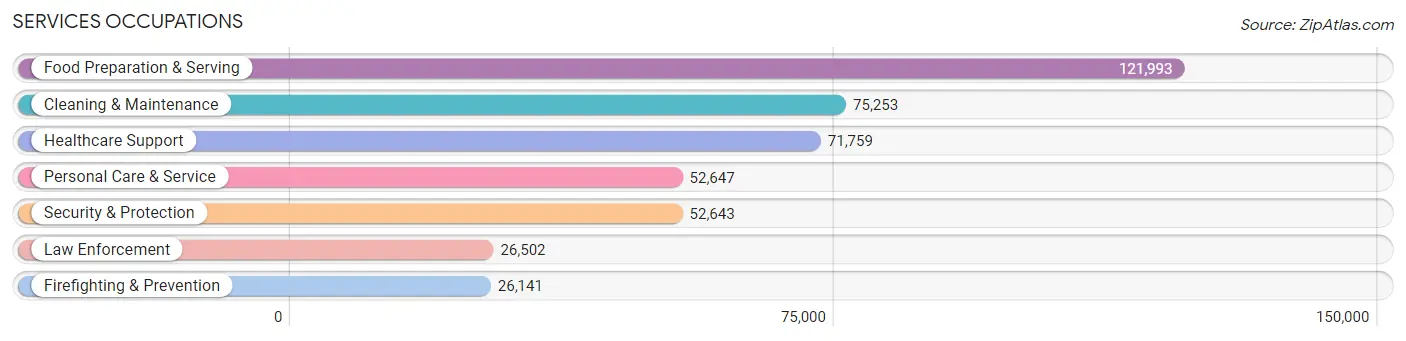
Services Occupations
The most common Services occupations in Louisiana are Food Preparation & Serving (121,993 | 6.0%), Cleaning & Maintenance (75,253 | 3.7%), Healthcare Support (71,759 | 3.5%), Personal Care & Service (52,647 | 2.6%), and Security & Protection (52,643 | 2.6%).
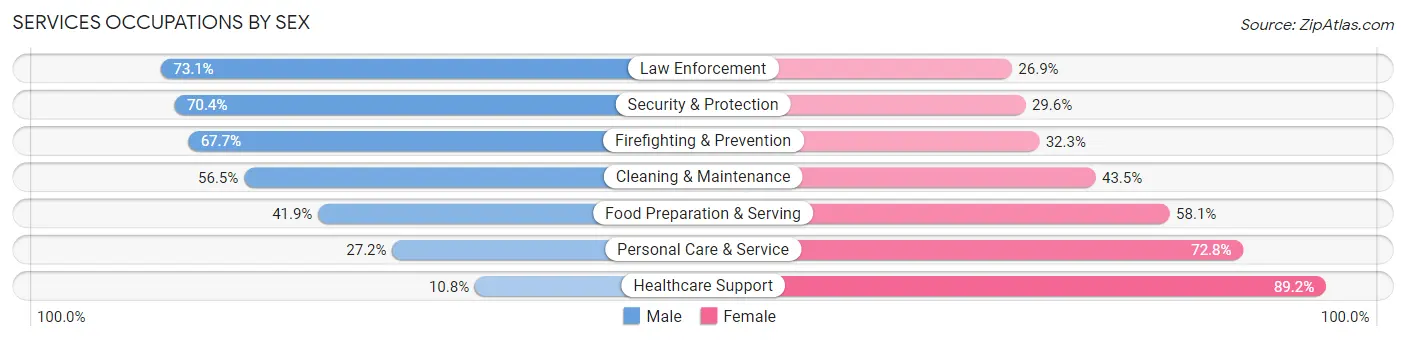
Services Occupations by Sex
Within the Services occupations in Louisiana, the most male-oriented occupations are Law Enforcement (73.1%), Security & Protection (70.4%), and Firefighting & Prevention (67.7%), while the most female-oriented occupations are Healthcare Support (89.2%), Personal Care & Service (72.8%), and Food Preparation & Serving (58.1%).
| Occupation | Male | Female |
| Healthcare Support | 7,760 (10.8%) | 63,999 (89.2%) |
| Security & Protection | 37,068 (70.4%) | 15,575 (29.6%) |
| Firefighting & Prevention | 17,694 (67.7%) | 8,447 (32.3%) |
| Law Enforcement | 19,374 (73.1%) | 7,128 (26.9%) |
| Food Preparation & Serving | 51,064 (41.9%) | 70,929 (58.1%) |
| Cleaning & Maintenance | 42,542 (56.5%) | 32,711 (43.5%) |
| Personal Care & Service | 14,303 (27.2%) | 38,344 (72.8%) |
| Total (Category) | 152,737 (40.8%) | 221,558 (59.2%) |
| Total (Overall) | 1,041,142 (51.6%) | 978,057 (48.4%) |
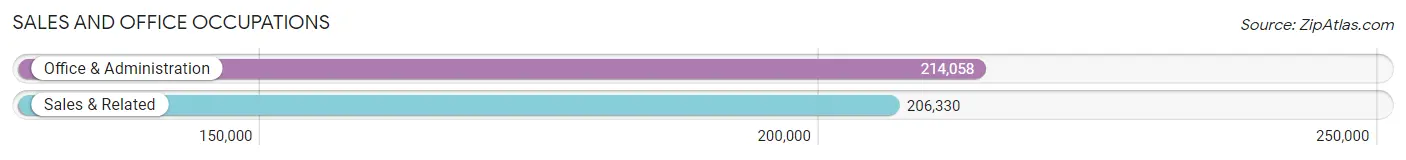
Sales and Office Occupations
The most common Sales and Office occupations in Louisiana are Office & Administration (214,058 | 10.6%), and Sales & Related (206,330 | 10.2%).
Sales and Office Occupations by Sex
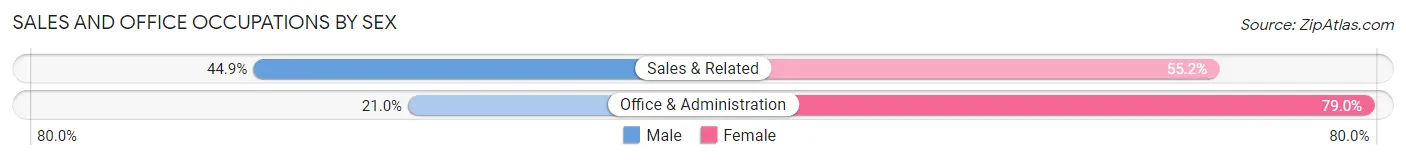
| Occupation | Male | Female |
| Sales & Related | 92,547 (44.9%) | 113,783 (55.1%) |
| Office & Administration | 45,018 (21.0%) | 169,040 (79.0%) |
| Total (Category) | 137,565 (32.7%) | 282,823 (67.3%) |
| Total (Overall) | 1,041,142 (51.6%) | 978,057 (48.4%) |
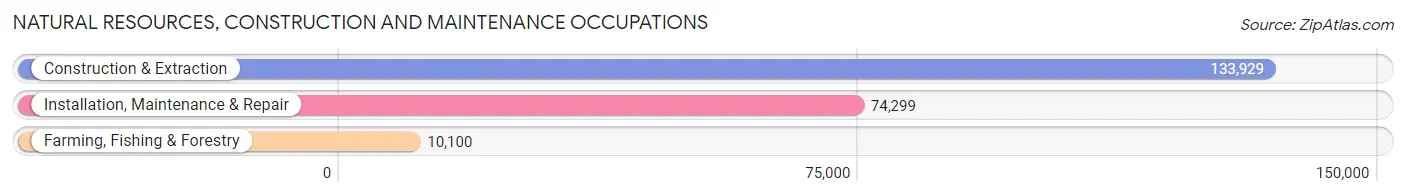
Natural Resources, Construction and Maintenance Occupations
The most common Natural Resources, Construction and Maintenance occupations in Louisiana are Construction & Extraction (133,929 | 6.6%), Installation, Maintenance & Repair (74,299 | 3.7%), and Farming, Fishing & Forestry (10,100 | 0.5%).
Natural Resources, Construction and Maintenance Occupations by Sex
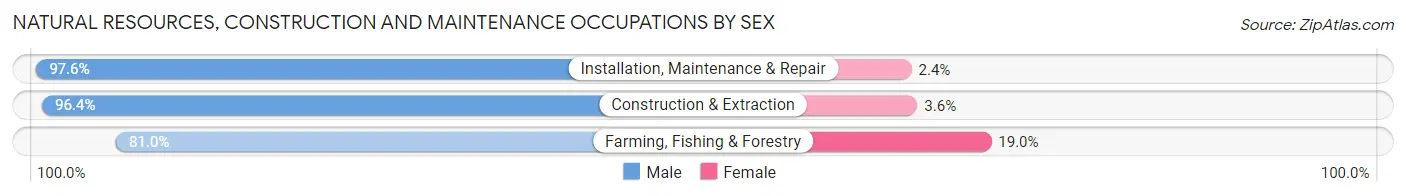
| Occupation | Male | Female |
| Farming, Fishing & Forestry | 8,178 (81.0%) | 1,922 (19.0%) |
| Construction & Extraction | 129,054 (96.4%) | 4,875 (3.6%) |
| Installation, Maintenance & Repair | 72,496 (97.6%) | 1,803 (2.4%) |
| Total (Category) | 209,728 (96.1%) | 8,600 (3.9%) |
| Total (Overall) | 1,041,142 (51.6%) | 978,057 (48.4%) |
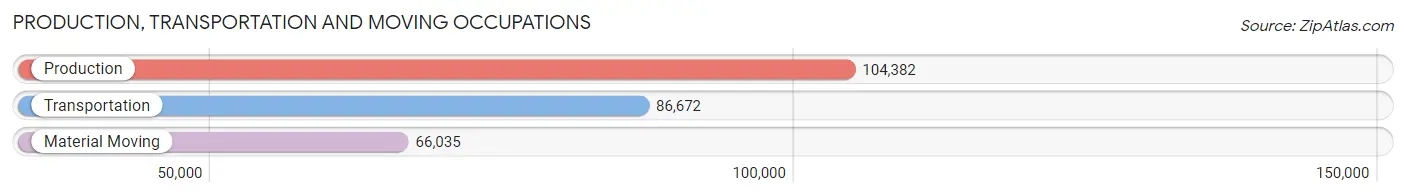
Production, Transportation and Moving Occupations
The most common Production, Transportation and Moving occupations in Louisiana are Production (104,382 | 5.2%), Transportation (86,672 | 4.3%), and Material Moving (66,035 | 3.3%).
Production, Transportation and Moving Occupations by Sex
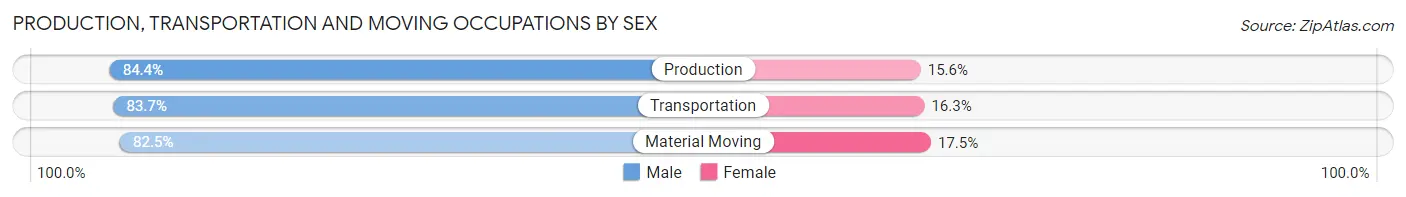
| Occupation | Male | Female |
| Production | 88,056 (84.4%) | 16,326 (15.6%) |
| Transportation | 72,529 (83.7%) | 14,143 (16.3%) |
| Material Moving | 54,457 (82.5%) | 11,578 (17.5%) |
| Total (Category) | 215,042 (83.6%) | 42,047 (16.4%) |
| Total (Overall) | 1,041,142 (51.6%) | 978,057 (48.4%) |
Employment Industries by Sex in Louisiana
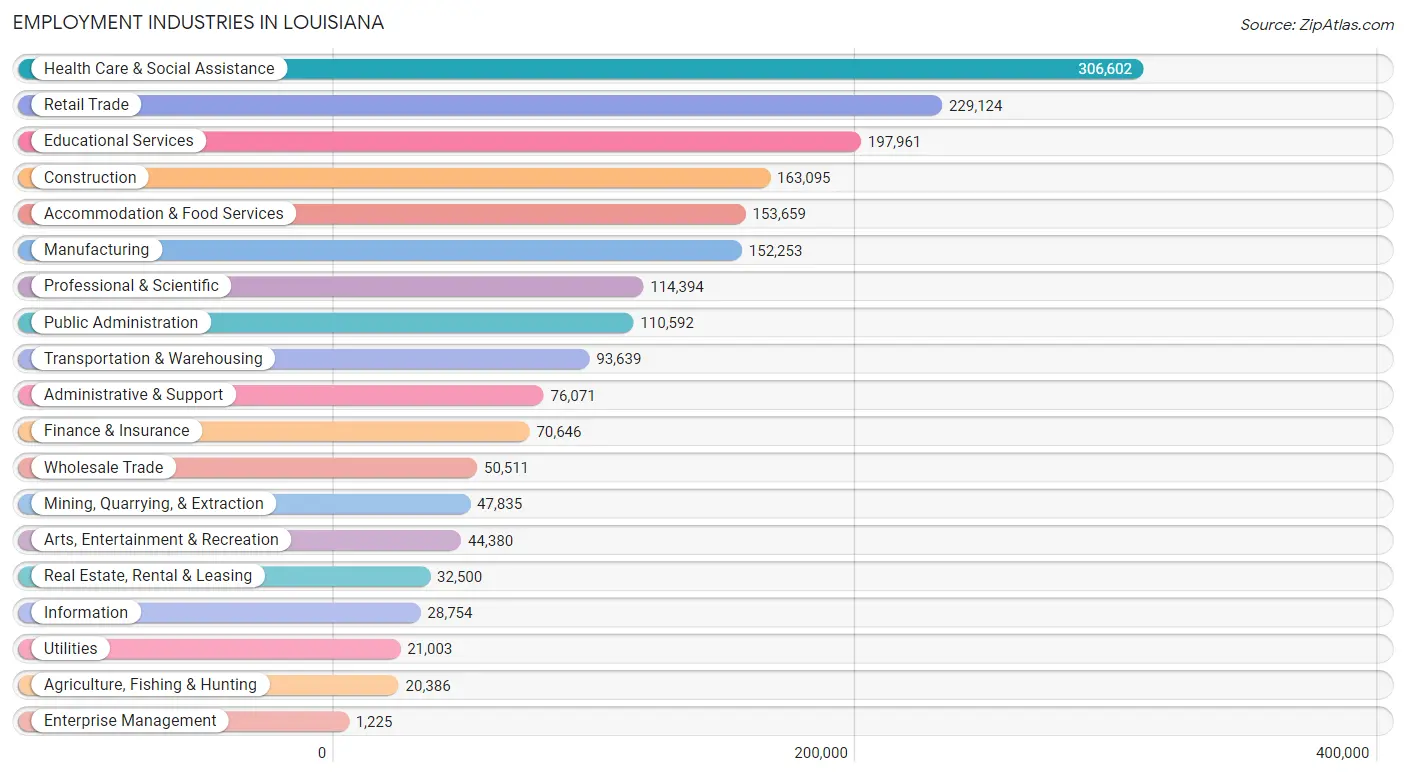
Employment Industries in Louisiana
The major employment industries in Louisiana include Health Care & Social Assistance (306,602 | 15.2%), Retail Trade (229,124 | 11.4%), Educational Services (197,961 | 9.8%), Construction (163,095 | 8.1%), and Accommodation & Food Services (153,659 | 7.6%).
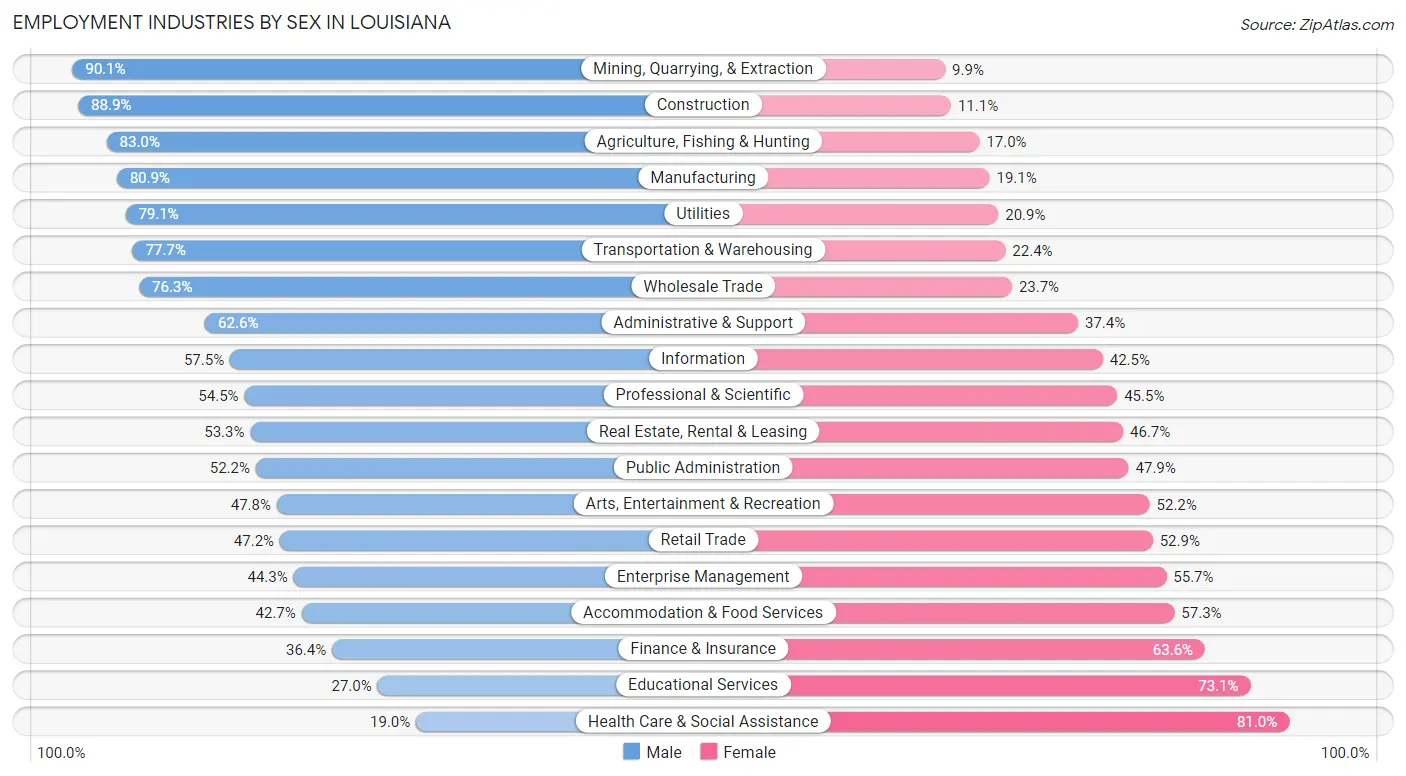
Employment Industries by Sex in Louisiana
The Louisiana industries that see more men than women are Mining, Quarrying, & Extraction (90.1%), Construction (88.9%), and Agriculture, Fishing & Hunting (83.0%), whereas the industries that tend to have a higher number of women are Health Care & Social Assistance (81.0%), Educational Services (73.1%), and Finance & Insurance (63.6%).
| Industry | Male | Female |
| Agriculture, Fishing & Hunting | 16,924 (83.0%) | 3,462 (17.0%) |
| Mining, Quarrying, & Extraction | 43,110 (90.1%) | 4,725 (9.9%) |
| Construction | 145,012 (88.9%) | 18,083 (11.1%) |
| Manufacturing | 123,220 (80.9%) | 29,033 (19.1%) |
| Wholesale Trade | 38,535 (76.3%) | 11,976 (23.7%) |
| Retail Trade | 108,021 (47.1%) | 121,103 (52.8%) |
| Transportation & Warehousing | 72,715 (77.6%) | 20,924 (22.4%) |
| Utilities | 16,618 (79.1%) | 4,385 (20.9%) |
| Information | 16,532 (57.5%) | 12,222 (42.5%) |
| Finance & Insurance | 25,686 (36.4%) | 44,960 (63.6%) |
| Real Estate, Rental & Leasing | 17,318 (53.3%) | 15,182 (46.7%) |
| Professional & Scientific | 62,340 (54.5%) | 52,054 (45.5%) |
| Enterprise Management | 543 (44.3%) | 682 (55.7%) |
| Administrative & Support | 47,639 (62.6%) | 28,432 (37.4%) |
| Educational Services | 53,344 (27.0%) | 144,617 (73.1%) |
| Health Care & Social Assistance | 58,144 (19.0%) | 248,458 (81.0%) |
| Arts, Entertainment & Recreation | 21,212 (47.8%) | 23,168 (52.2%) |
| Accommodation & Food Services | 65,563 (42.7%) | 88,096 (57.3%) |
| Public Administration | 57,676 (52.1%) | 52,916 (47.8%) |
| Total | 1,041,142 (51.6%) | 978,057 (48.4%) |
Education in Louisiana
School Enrollment in Louisiana
The most common levels of schooling among the 1,143,045 students in Louisiana are middle school (251,130 | 22.0%), high school (242,467 | 21.2%), and elementary school (235,552 | 20.6%).
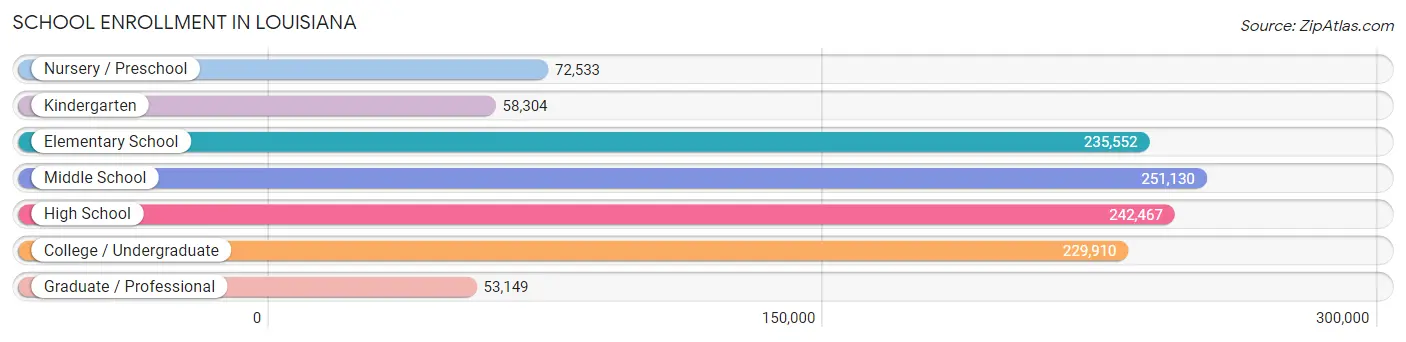
| School Level | # Students | % Students |
| Nursery / Preschool | 72,533 | 6.4% |
| Kindergarten | 58,304 | 5.1% |
| Elementary School | 235,552 | 20.6% |
| Middle School | 251,130 | 22.0% |
| High School | 242,467 | 21.2% |
| College / Undergraduate | 229,910 | 20.1% |
| Graduate / Professional | 53,149 | 4.6% |
| Total | 1,143,045 | 100.0% |
School Enrollment by Age by Funding Source in Louisiana
Out of a total of 1,143,045 students who are enrolled in schools in Louisiana, 227,466 (19.9%) attend a private institution, while the remaining 915,579 (80.1%) are enrolled in public schools. The age group of 3 to 4 year olds has the highest likelihood of being enrolled in private schools, with 22,108 (37.6% in the age bracket) enrolled. Conversely, the age group of 18 to 19 year olds has the lowest likelihood of being enrolled in a private school, with 71,413 (82.9% in the age bracket) attending a public institution.
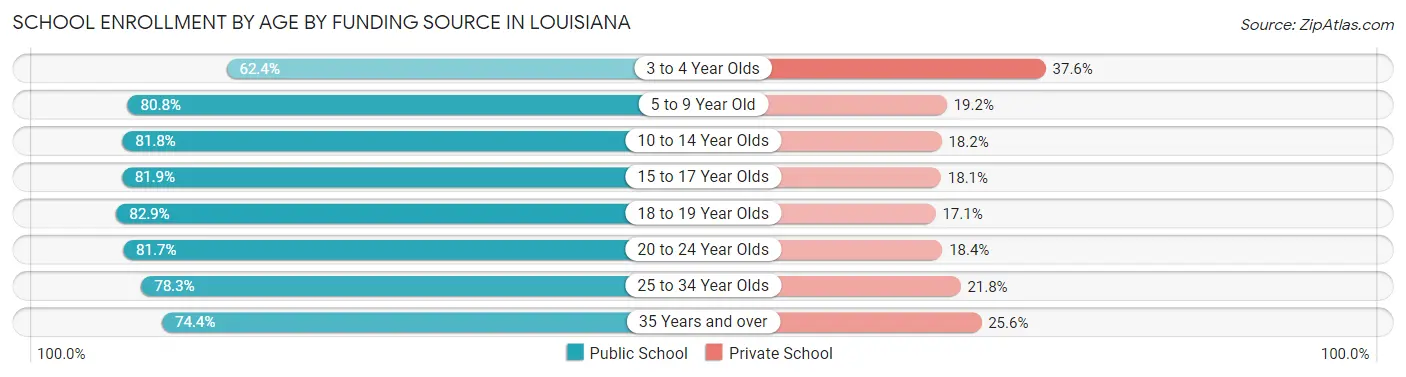
| Age Bracket | Public School | Private School |
| 3 to 4 Year Olds | 36,659 (62.4%) | 22,108 (37.6%) |
| 5 to 9 Year Old | 225,568 (80.8%) | 53,607 (19.2%) |
| 10 to 14 Year Olds | 249,710 (81.8%) | 55,644 (18.2%) |
| 15 to 17 Year Olds | 143,840 (81.9%) | 31,797 (18.1%) |
| 18 to 19 Year Olds | 71,413 (82.9%) | 14,729 (17.1%) |
| 20 to 24 Year Olds | 96,358 (81.7%) | 21,649 (18.3%) |
| 25 to 34 Year Olds | 52,577 (78.2%) | 14,618 (21.7%) |
| 35 Years and over | 39,248 (74.4%) | 13,520 (25.6%) |
| Total | 915,579 (80.1%) | 227,466 (19.9%) |
Educational Attainment by Field of Study in Louisiana
Business (163,707 | 18.9%), education (129,195 | 14.9%), science & technology (108,787 | 12.6%), liberal arts & history (64,389 | 7.4%), and arts & humanities (59,972 | 6.9%) are the most common fields of study among 864,512 individuals in Louisiana who have obtained a bachelor's degree or higher.
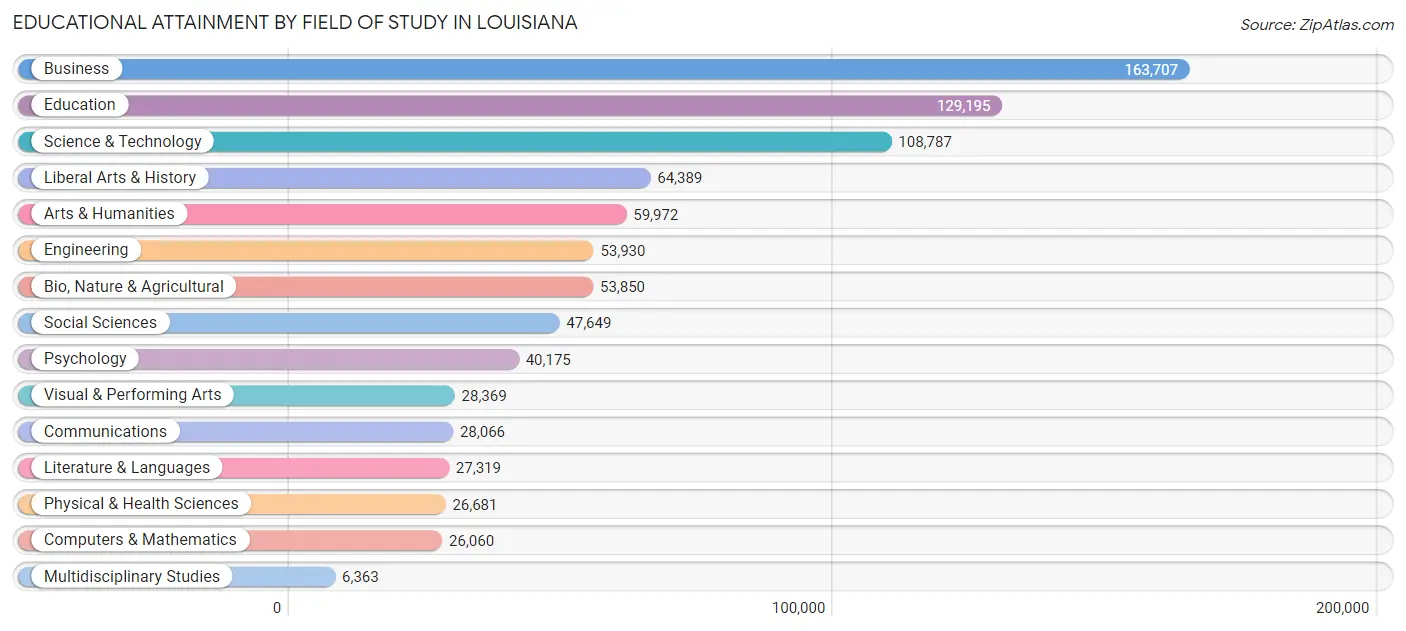
| Field of Study | # Graduates | % Graduates |
| Computers & Mathematics | 26,060 | 3.0% |
| Bio, Nature & Agricultural | 53,850 | 6.2% |
| Physical & Health Sciences | 26,681 | 3.1% |
| Psychology | 40,175 | 4.6% |
| Social Sciences | 47,649 | 5.5% |
| Engineering | 53,930 | 6.2% |
| Multidisciplinary Studies | 6,363 | 0.7% |
| Science & Technology | 108,787 | 12.6% |
| Business | 163,707 | 18.9% |
| Education | 129,195 | 14.9% |
| Literature & Languages | 27,319 | 3.2% |
| Liberal Arts & History | 64,389 | 7.4% |
| Visual & Performing Arts | 28,369 | 3.3% |
| Communications | 28,066 | 3.3% |
| Arts & Humanities | 59,972 | 6.9% |
| Total | 864,512 | 100.0% |
Transportation & Commute in Louisiana
Vehicle Availability by Sex in Louisiana
The most prevalent vehicle ownership categories in Louisiana are males with 2 vehicles (465,280, accounting for 45.2%) and females with 2 vehicles (389,410, making up 49.1%).
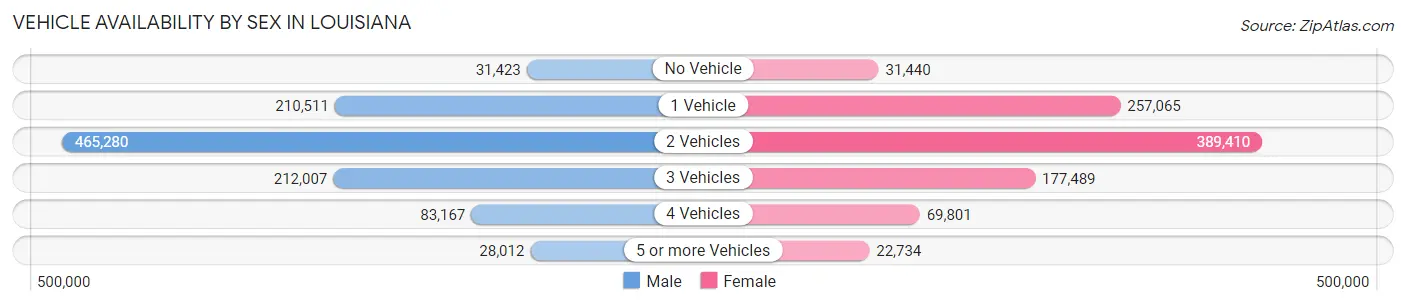
| Vehicles Available | Male | Female |
| No Vehicle | 31,423 (3.0%) | 31,440 (3.3%) |
| 1 Vehicle | 210,511 (20.4%) | 257,065 (27.1%) |
| 2 Vehicles | 465,280 (45.2%) | 389,410 (41.1%) |
| 3 Vehicles | 212,007 (20.6%) | 177,489 (18.7%) |
| 4 Vehicles | 83,167 (8.1%) | 69,801 (7.4%) |
| 5 or more Vehicles | 28,012 (2.7%) | 22,734 (2.4%) |
| Total | 1,030,400 (100.0%) | 947,939 (100.0%) |
Commute Time in Louisiana
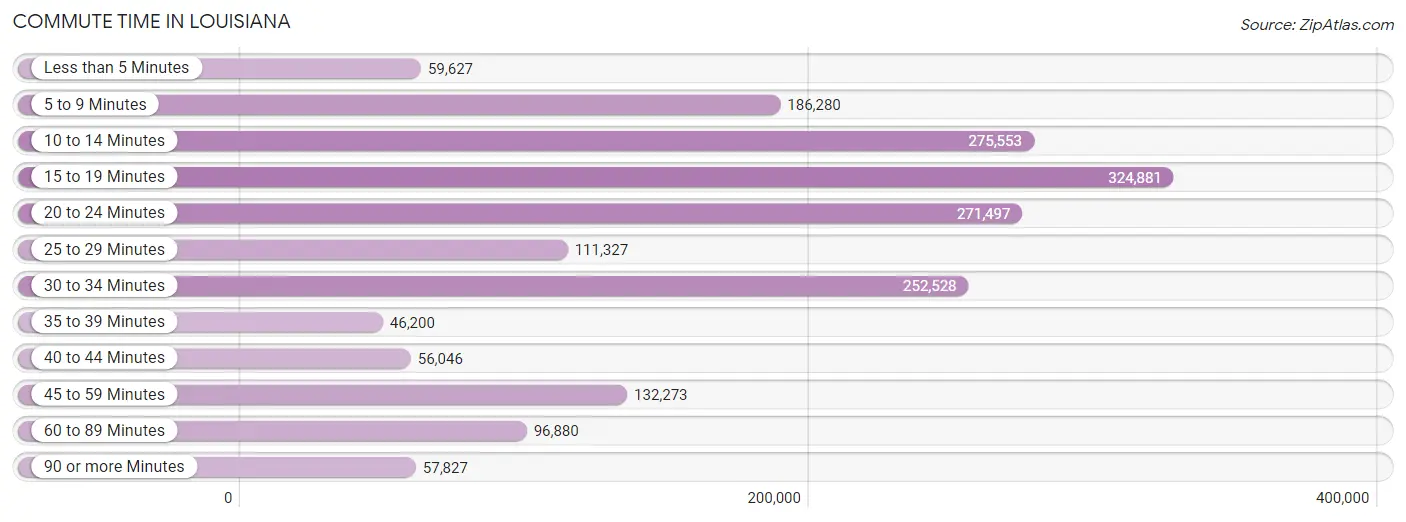
The most frequently occuring commute durations in Louisiana are 15 to 19 minutes (324,881 commuters, 17.4%), 10 to 14 minutes (275,553 commuters, 14.7%), and 20 to 24 minutes (271,497 commuters, 14.5%).
| Commute Time | # Commuters | % Commuters |
| Less than 5 Minutes | 59,627 | 3.2% |
| 5 to 9 Minutes | 186,280 | 10.0% |
| 10 to 14 Minutes | 275,553 | 14.7% |
| 15 to 19 Minutes | 324,881 | 17.4% |
| 20 to 24 Minutes | 271,497 | 14.5% |
| 25 to 29 Minutes | 111,327 | 5.9% |
| 30 to 34 Minutes | 252,528 | 13.5% |
| 35 to 39 Minutes | 46,200 | 2.5% |
| 40 to 44 Minutes | 56,046 | 3.0% |
| 45 to 59 Minutes | 132,273 | 7.1% |
| 60 to 89 Minutes | 96,880 | 5.2% |
| 90 or more Minutes | 57,827 | 3.1% |
Commute Time by Sex in Louisiana
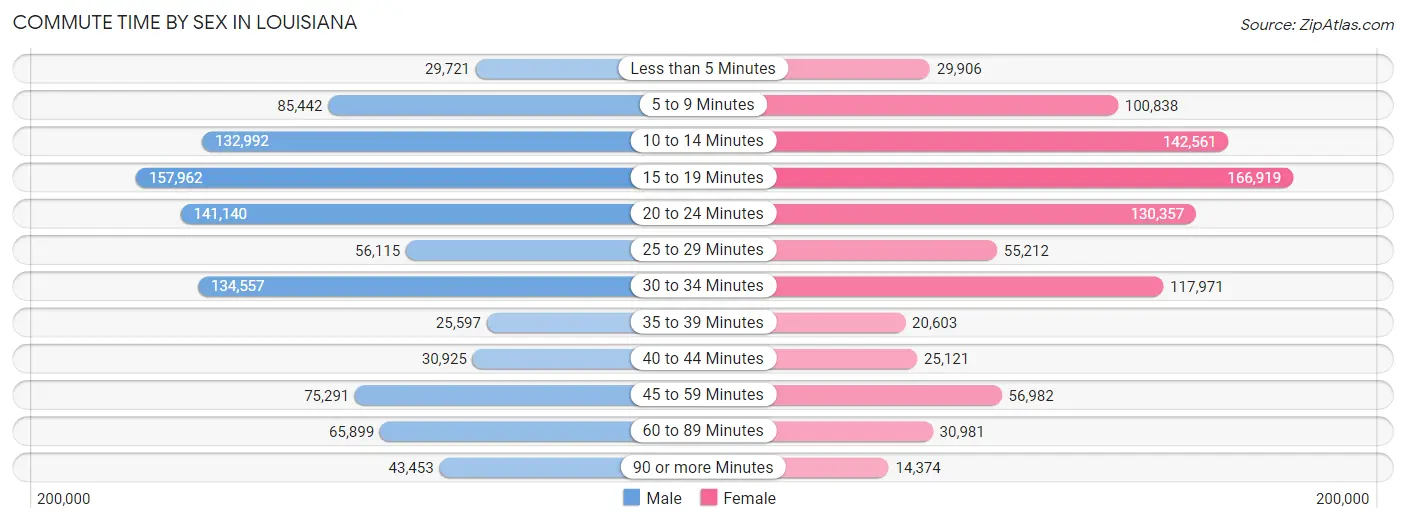
The most common commute times in Louisiana are 15 to 19 minutes (157,962 commuters, 16.1%) for males and 15 to 19 minutes (166,919 commuters, 18.7%) for females.
| Commute Time | Male | Female |
| Less than 5 Minutes | 29,721 (3.0%) | 29,906 (3.4%) |
| 5 to 9 Minutes | 85,442 (8.7%) | 100,838 (11.3%) |
| 10 to 14 Minutes | 132,992 (13.6%) | 142,561 (16.0%) |
| 15 to 19 Minutes | 157,962 (16.1%) | 166,919 (18.7%) |
| 20 to 24 Minutes | 141,140 (14.4%) | 130,357 (14.6%) |
| 25 to 29 Minutes | 56,115 (5.7%) | 55,212 (6.2%) |
| 30 to 34 Minutes | 134,557 (13.7%) | 117,971 (13.2%) |
| 35 to 39 Minutes | 25,597 (2.6%) | 20,603 (2.3%) |
| 40 to 44 Minutes | 30,925 (3.2%) | 25,121 (2.8%) |
| 45 to 59 Minutes | 75,291 (7.7%) | 56,982 (6.4%) |
| 60 to 89 Minutes | 65,899 (6.7%) | 30,981 (3.5%) |
| 90 or more Minutes | 43,453 (4.4%) | 14,374 (1.6%) |
Time of Departure to Work by Sex in Louisiana
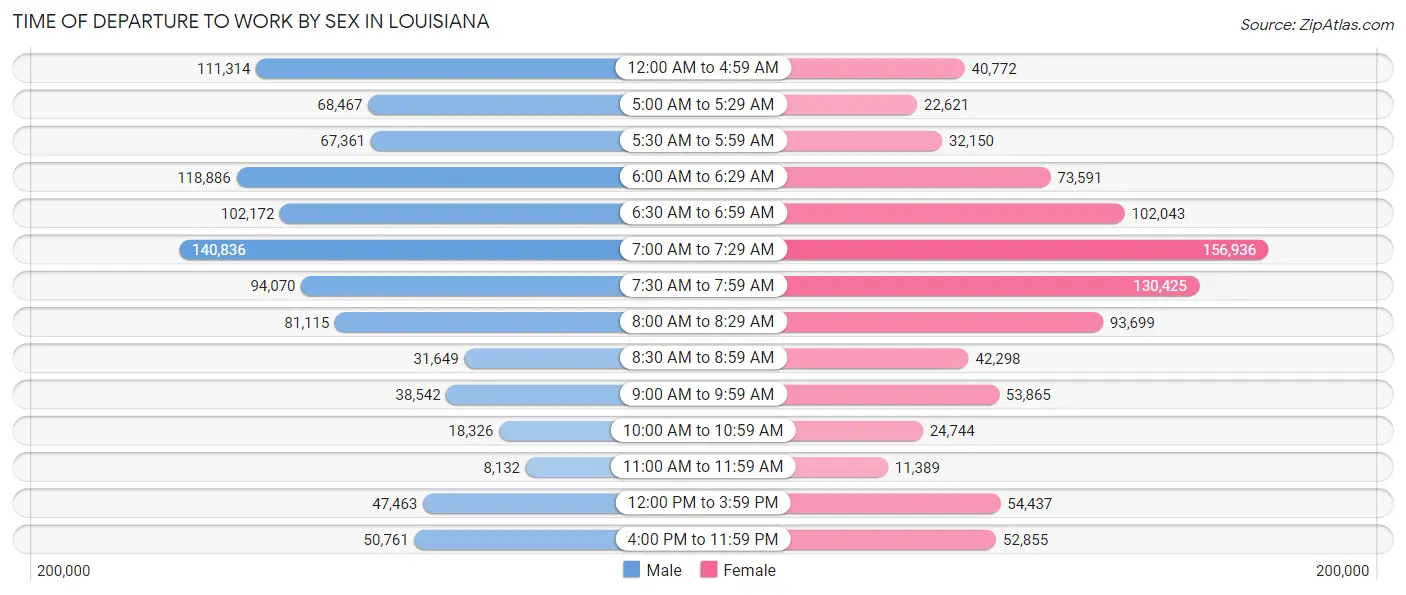
The most frequent times of departure to work in Louisiana are 7:00 AM to 7:29 AM (140,836, 14.4%) for males and 7:00 AM to 7:29 AM (156,936, 17.6%) for females.
| Time of Departure | Male | Female |
| 12:00 AM to 4:59 AM | 111,314 (11.4%) | 40,772 (4.6%) |
| 5:00 AM to 5:29 AM | 68,467 (7.0%) | 22,621 (2.5%) |
| 5:30 AM to 5:59 AM | 67,361 (6.9%) | 32,150 (3.6%) |
| 6:00 AM to 6:29 AM | 118,886 (12.1%) | 73,591 (8.3%) |
| 6:30 AM to 6:59 AM | 102,172 (10.4%) | 102,043 (11.4%) |
| 7:00 AM to 7:29 AM | 140,836 (14.4%) | 156,936 (17.6%) |
| 7:30 AM to 7:59 AM | 94,070 (9.6%) | 130,425 (14.6%) |
| 8:00 AM to 8:29 AM | 81,115 (8.3%) | 93,699 (10.5%) |
| 8:30 AM to 8:59 AM | 31,649 (3.2%) | 42,298 (4.7%) |
| 9:00 AM to 9:59 AM | 38,542 (3.9%) | 53,865 (6.0%) |
| 10:00 AM to 10:59 AM | 18,326 (1.9%) | 24,744 (2.8%) |
| 11:00 AM to 11:59 AM | 8,132 (0.8%) | 11,389 (1.3%) |
| 12:00 PM to 3:59 PM | 47,463 (4.9%) | 54,437 (6.1%) |
| 4:00 PM to 11:59 PM | 50,761 (5.2%) | 52,855 (5.9%) |
| Total | 979,094 (100.0%) | 891,825 (100.0%) |
Housing Occupancy in Louisiana
Occupancy by Ownership in Louisiana
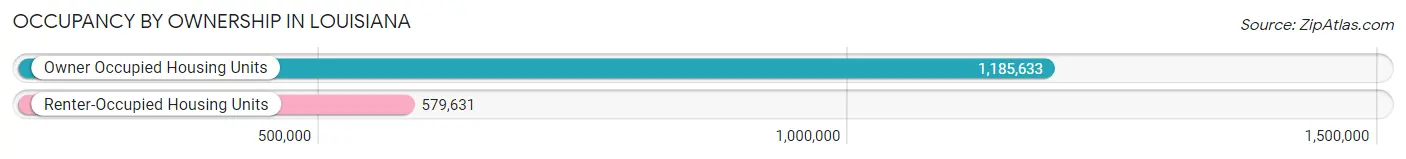
Of the total 1,765,264 dwellings in Louisiana, owner-occupied units account for 1,185,633 (67.2%), while renter-occupied units make up 579,631 (32.8%).
| Occupancy | # Housing Units | % Housing Units |
| Owner Occupied Housing Units | 1,185,633 | 67.2% |
| Renter-Occupied Housing Units | 579,631 | 32.8% |
| Total Occupied Housing Units | 1,765,264 | 100.0% |
Occupancy by Household Size in Louisiana
| Household Size | # Housing Units | % Housing Units |
| 1-Person Household | 542,825 | 30.7% |
| 2-Person Household | 587,636 | 33.3% |
| 3-Person Household | 279,878 | 15.9% |
| 4+ Person Household | 354,925 | 20.1% |
| Total Housing Units | 1,765,264 | 100.0% |
Occupancy by Ownership by Household Size in Louisiana
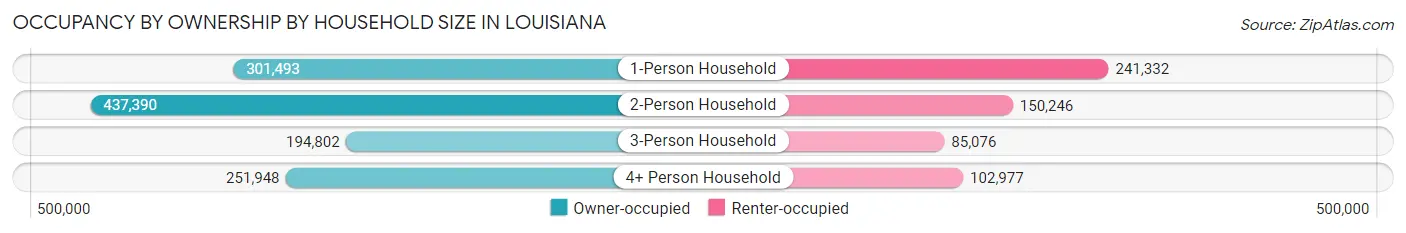
| Household Size | Owner-occupied | Renter-occupied |
| 1-Person Household | 301,493 (55.5%) | 241,332 (44.5%) |
| 2-Person Household | 437,390 (74.4%) | 150,246 (25.6%) |
| 3-Person Household | 194,802 (69.6%) | 85,076 (30.4%) |
| 4+ Person Household | 251,948 (71.0%) | 102,977 (29.0%) |
| Total Housing Units | 1,185,633 (67.2%) | 579,631 (32.8%) |
Occupancy by Educational Attainment in Louisiana
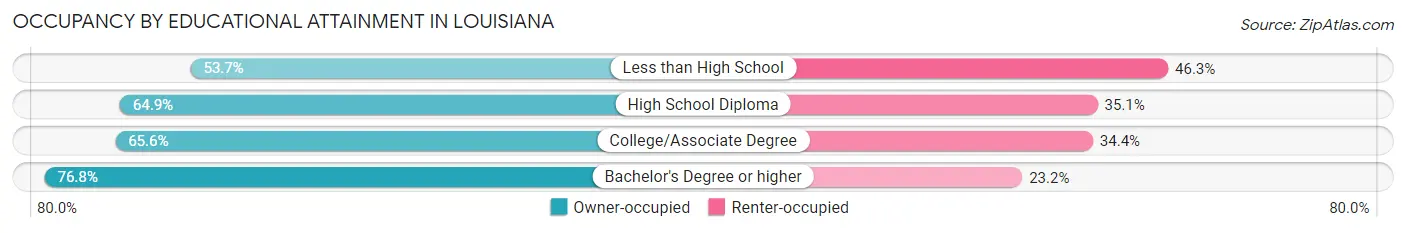
| Household Size | Owner-occupied | Renter-occupied |
| Less than High School | 110,446 (53.7%) | 95,267 (46.3%) |
| High School Diploma | 347,573 (64.9%) | 188,131 (35.1%) |
| College/Associate Degree | 345,278 (65.6%) | 180,938 (34.4%) |
| Bachelor's Degree or higher | 382,336 (76.8%) | 115,295 (23.2%) |
Occupancy by Age of Householder in Louisiana
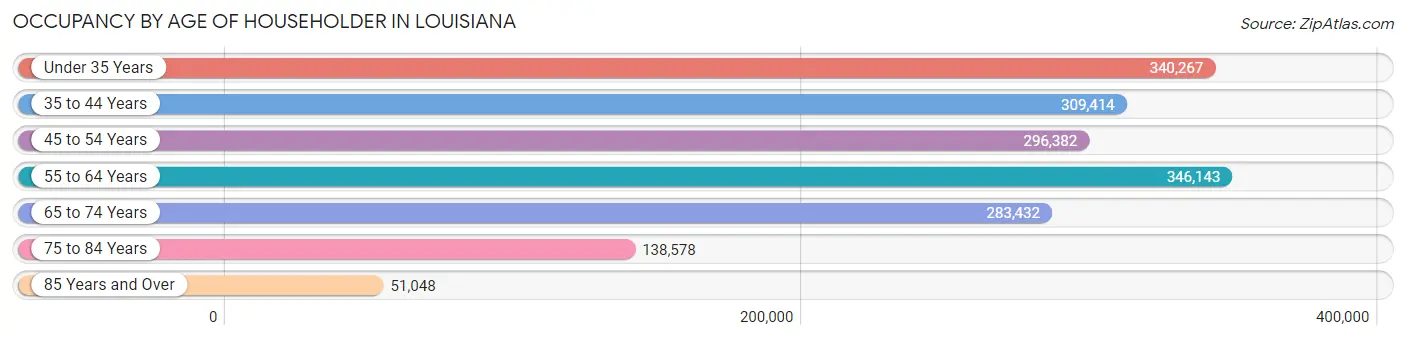
| Age Bracket | # Households | % Households |
| Under 35 Years | 340,267 | 19.3% |
| 35 to 44 Years | 309,414 | 17.5% |
| 45 to 54 Years | 296,382 | 16.8% |
| 55 to 64 Years | 346,143 | 19.6% |
| 65 to 74 Years | 283,432 | 16.1% |
| 75 to 84 Years | 138,578 | 7.9% |
| 85 Years and Over | 51,048 | 2.9% |
| Total | 1,765,264 | 100.0% |
Housing Finances in Louisiana
Median Income by Occupancy in Louisiana
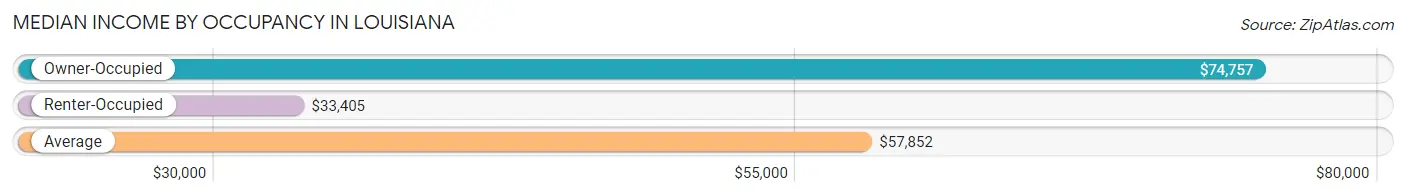
| Occupancy Type | # Households | Median Income |
| Owner-Occupied | 1,185,633 (67.2%) | $74,757 |
| Renter-Occupied | 579,631 (32.8%) | $33,405 |
| Average | 1,765,264 (100.0%) | $57,852 |
Occupancy by Householder Income Bracket in Louisiana
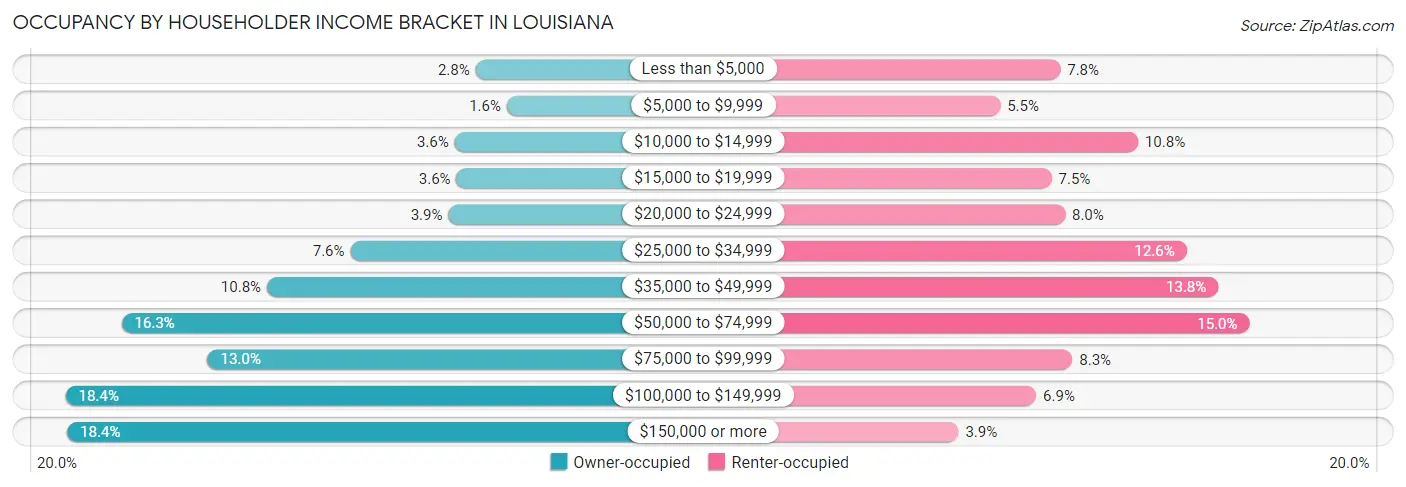
| Income Bracket | Owner-occupied | Renter-occupied |
| Less than $5,000 | 33,417 (2.8%) | 45,214 (7.8%) |
| $5,000 to $9,999 | 19,287 (1.6%) | 31,936 (5.5%) |
| $10,000 to $14,999 | 42,971 (3.6%) | 62,385 (10.8%) |
| $15,000 to $19,999 | 42,056 (3.5%) | 43,285 (7.5%) |
| $20,000 to $24,999 | 45,778 (3.9%) | 46,244 (8.0%) |
| $25,000 to $34,999 | 90,015 (7.6%) | 73,085 (12.6%) |
| $35,000 to $49,999 | 127,726 (10.8%) | 80,038 (13.8%) |
| $50,000 to $74,999 | 193,338 (16.3%) | 86,969 (15.0%) |
| $75,000 to $99,999 | 154,517 (13.0%) | 47,869 (8.3%) |
| $100,000 to $149,999 | 218,619 (18.4%) | 39,860 (6.9%) |
| $150,000 or more | 217,909 (18.4%) | 22,746 (3.9%) |
| Total | 1,185,633 (100.0%) | 579,631 (100.0%) |
Monthly Housing Cost Tiers in Louisiana
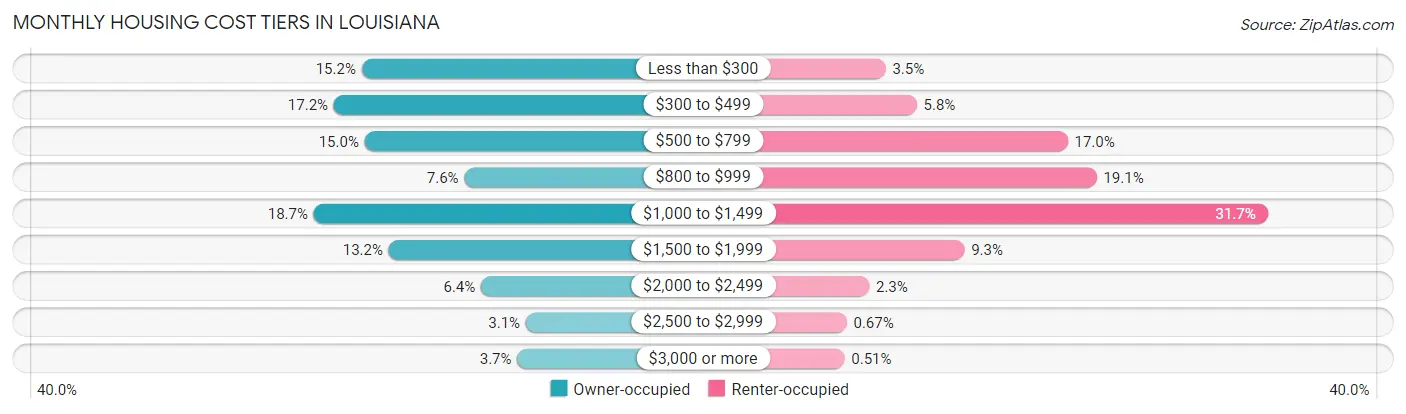
| Monthly Cost | Owner-occupied | Renter-occupied |
| Less than $300 | 179,881 (15.2%) | 20,514 (3.5%) |
| $300 to $499 | 204,129 (17.2%) | 33,788 (5.8%) |
| $500 to $799 | 177,271 (14.9%) | 98,262 (17.0%) |
| $800 to $999 | 90,256 (7.6%) | 110,605 (19.1%) |
| $1,000 to $1,499 | 221,751 (18.7%) | 183,622 (31.7%) |
| $1,500 to $1,999 | 156,208 (13.2%) | 54,123 (9.3%) |
| $2,000 to $2,499 | 75,671 (6.4%) | 13,516 (2.3%) |
| $2,500 to $2,999 | 36,520 (3.1%) | 3,864 (0.7%) |
| $3,000 or more | 43,946 (3.7%) | 2,964 (0.5%) |
| Total | 1,185,633 (100.0%) | 579,631 (100.0%) |
Physical Housing Characteristics in Louisiana
Housing Structures in Louisiana
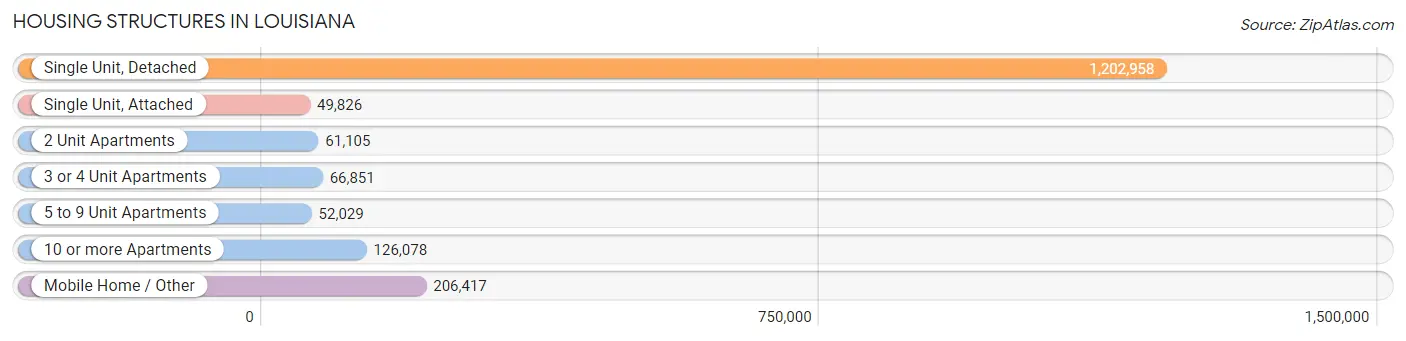
| Structure Type | # Housing Units | % Housing Units |
| Single Unit, Detached | 1,202,958 | 68.1% |
| Single Unit, Attached | 49,826 | 2.8% |
| 2 Unit Apartments | 61,105 | 3.5% |
| 3 or 4 Unit Apartments | 66,851 | 3.8% |
| 5 to 9 Unit Apartments | 52,029 | 2.9% |
| 10 or more Apartments | 126,078 | 7.1% |
| Mobile Home / Other | 206,417 | 11.7% |
| Total | 1,765,264 | 100.0% |
Housing Structures by Occupancy in Louisiana
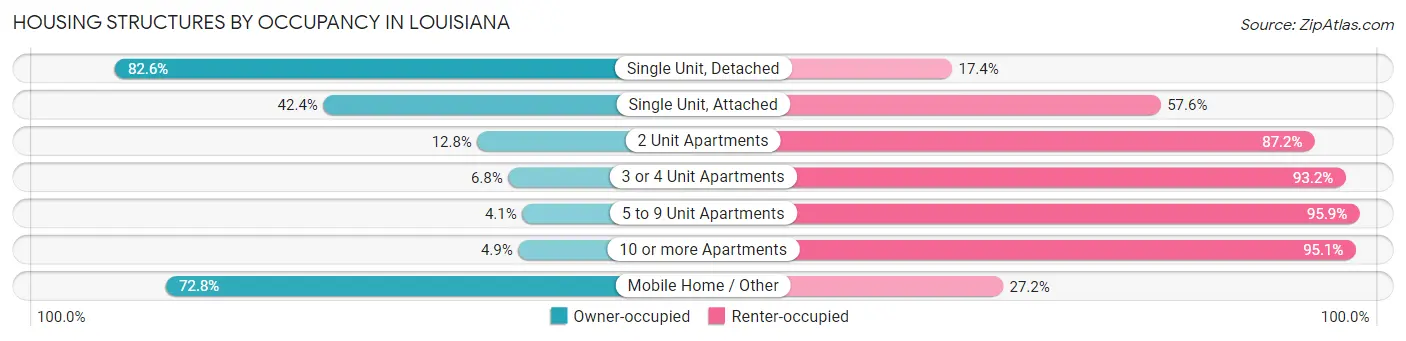
| Structure Type | Owner-occupied | Renter-occupied |
| Single Unit, Detached | 993,592 (82.6%) | 209,366 (17.4%) |
| Single Unit, Attached | 21,137 (42.4%) | 28,689 (57.6%) |
| 2 Unit Apartments | 7,796 (12.8%) | 53,309 (87.2%) |
| 3 or 4 Unit Apartments | 4,562 (6.8%) | 62,289 (93.2%) |
| 5 to 9 Unit Apartments | 2,150 (4.1%) | 49,879 (95.9%) |
| 10 or more Apartments | 6,164 (4.9%) | 119,914 (95.1%) |
| Mobile Home / Other | 150,232 (72.8%) | 56,185 (27.2%) |
| Total | 1,185,633 (67.2%) | 579,631 (32.8%) |
Housing Structures by Number of Rooms in Louisiana
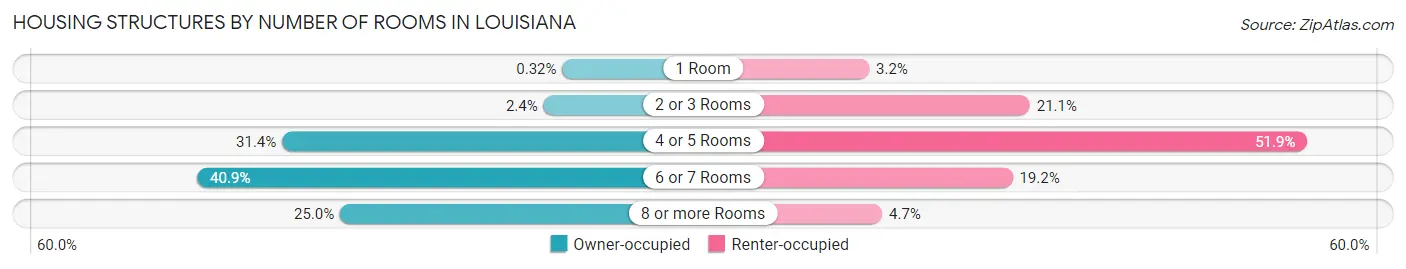
| Number of Rooms | Owner-occupied | Renter-occupied |
| 1 Room | 3,814 (0.3%) | 18,777 (3.2%) |
| 2 or 3 Rooms | 28,563 (2.4%) | 122,141 (21.1%) |
| 4 or 5 Rooms | 372,550 (31.4%) | 300,597 (51.9%) |
| 6 or 7 Rooms | 484,359 (40.8%) | 110,975 (19.2%) |
| 8 or more Rooms | 296,347 (25.0%) | 27,141 (4.7%) |
| Total | 1,185,633 (100.0%) | 579,631 (100.0%) |
Housing Structure by Heating Type in Louisiana
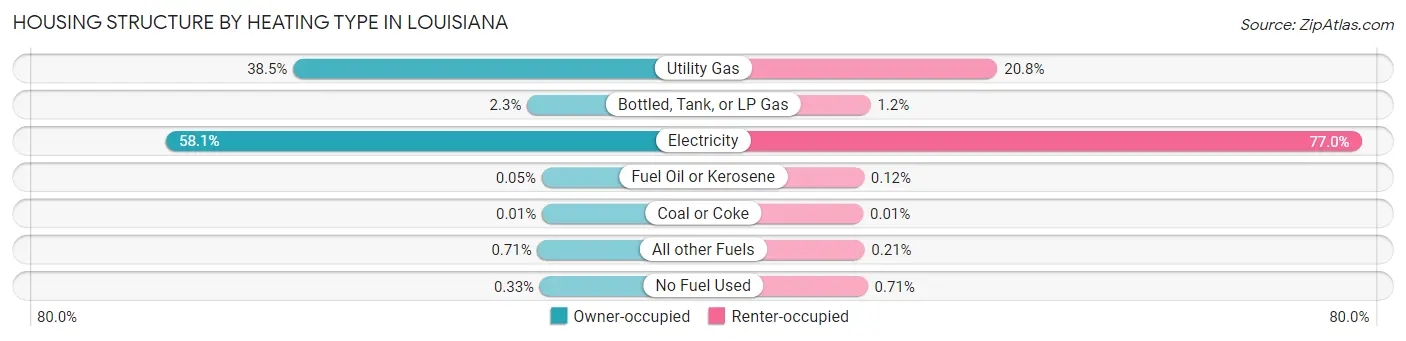
| Heating Type | Owner-occupied | Renter-occupied |
| Utility Gas | 456,221 (38.5%) | 120,277 (20.7%) |
| Bottled, Tank, or LP Gas | 27,238 (2.3%) | 6,656 (1.1%) |
| Electricity | 689,100 (58.1%) | 446,574 (77.0%) |
| Fuel Oil or Kerosene | 643 (0.1%) | 702 (0.1%) |
| Coal or Coke | 80 (0.0%) | 75 (0.0%) |
| All other Fuels | 8,426 (0.7%) | 1,245 (0.2%) |
| No Fuel Used | 3,925 (0.3%) | 4,102 (0.7%) |
| Total | 1,185,633 (100.0%) | 579,631 (100.0%) |
Household Vehicle Usage in Louisiana
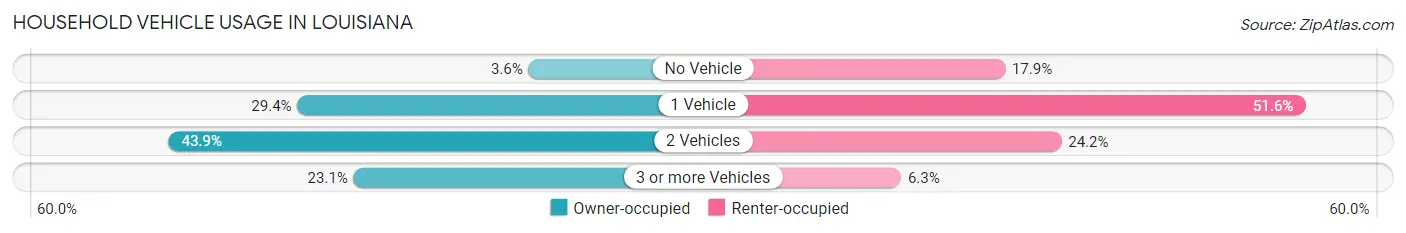
| Vehicles per Household | Owner-occupied | Renter-occupied |
| No Vehicle | 42,140 (3.5%) | 103,922 (17.9%) |
| 1 Vehicle | 349,105 (29.4%) | 298,816 (51.5%) |
| 2 Vehicles | 520,087 (43.9%) | 140,499 (24.2%) |
| 3 or more Vehicles | 274,301 (23.1%) | 36,394 (6.3%) |
| Total | 1,185,633 (100.0%) | 579,631 (100.0%) |
Real Estate & Mortgages in Louisiana
Real Estate and Mortgage Overview in Louisiana
| Characteristic | Without Mortgage | With Mortgage |
| Housing Units | 566,195 | 619,438 |
| Median Property Value | $162,100 | $225,300 |
| Median Household Income | $53,634 | $150,493 |
| Monthly Housing Costs | $396 | $42,312 |
| Real Estate Taxes | $692 | $79,050 |
Property Value by Mortgage Status in Louisiana
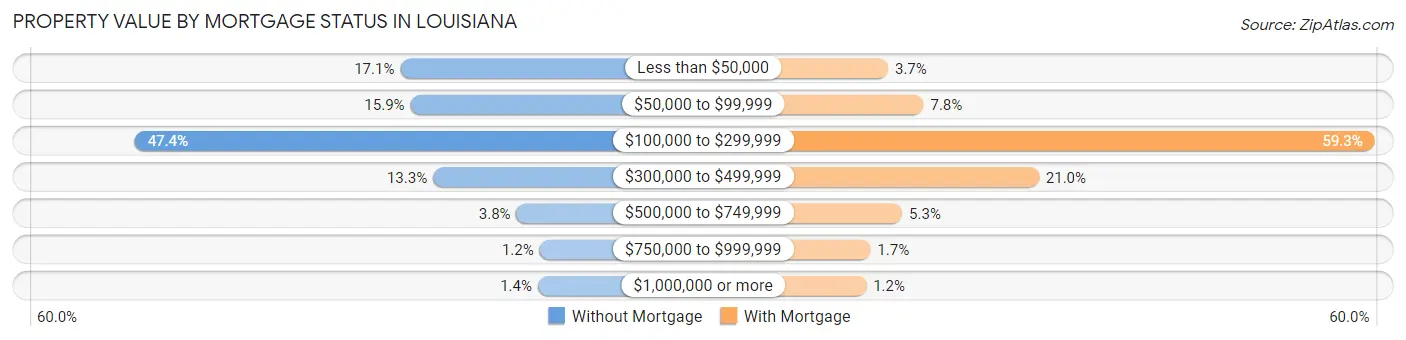
| Property Value | Without Mortgage | With Mortgage |
| Less than $50,000 | 96,676 (17.1%) | 22,994 (3.7%) |
| $50,000 to $99,999 | 90,069 (15.9%) | 48,145 (7.8%) |
| $100,000 to $299,999 | 268,411 (47.4%) | 367,400 (59.3%) |
| $300,000 to $499,999 | 75,491 (13.3%) | 129,791 (20.9%) |
| $500,000 to $749,999 | 21,449 (3.8%) | 33,045 (5.3%) |
| $750,000 to $999,999 | 6,483 (1.1%) | 10,523 (1.7%) |
| $1,000,000 or more | 7,616 (1.3%) | 7,540 (1.2%) |
| Total | 566,195 (100.0%) | 619,438 (100.0%) |
Household Income by Mortgage Status in Louisiana
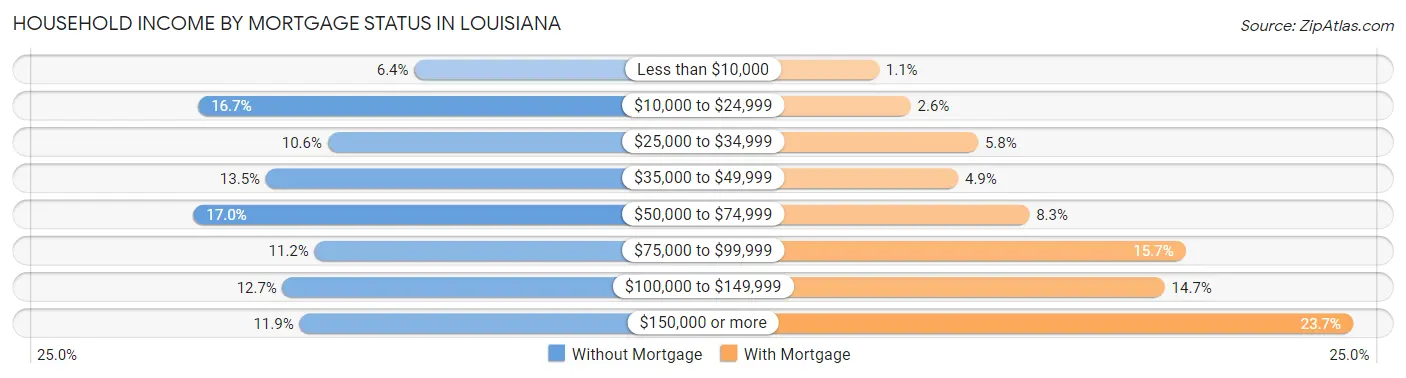
| Household Income | Without Mortgage | With Mortgage |
| Less than $10,000 | 36,458 (6.4%) | 6,867 (1.1%) |
| $10,000 to $24,999 | 94,712 (16.7%) | 16,246 (2.6%) |
| $25,000 to $34,999 | 59,805 (10.6%) | 36,093 (5.8%) |
| $35,000 to $49,999 | 76,504 (13.5%) | 30,210 (4.9%) |
| $50,000 to $74,999 | 96,010 (17.0%) | 51,222 (8.3%) |
| $75,000 to $99,999 | 63,334 (11.2%) | 97,328 (15.7%) |
| $100,000 to $149,999 | 71,956 (12.7%) | 91,183 (14.7%) |
| $150,000 or more | 67,416 (11.9%) | 146,663 (23.7%) |
| Total | 566,195 (100.0%) | 619,438 (100.0%) |
Property Value to Household Income Ratio in Louisiana
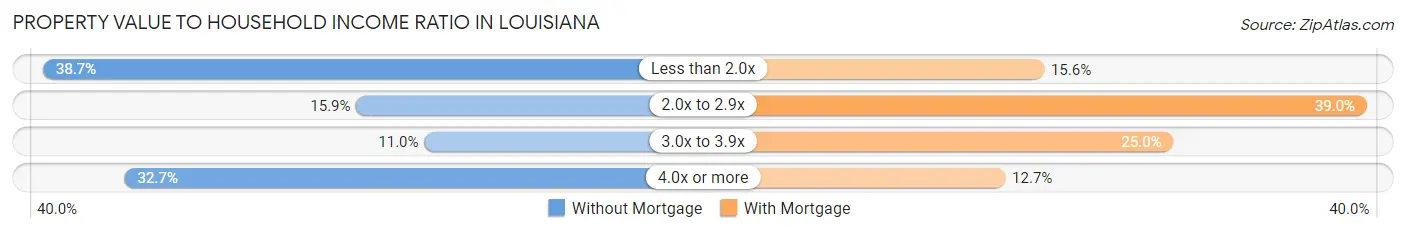
| Value-to-Income Ratio | Without Mortgage | With Mortgage |
| Less than 2.0x | 218,934 (38.7%) | 96,292 (15.5%) |
| 2.0x to 2.9x | 90,005 (15.9%) | 241,667 (39.0%) |
| 3.0x to 3.9x | 62,078 (11.0%) | 154,638 (25.0%) |
| 4.0x or more | 185,351 (32.7%) | 78,869 (12.7%) |
| Total | 566,195 (100.0%) | 619,438 (100.0%) |
Real Estate Taxes by Mortgage Status in Louisiana
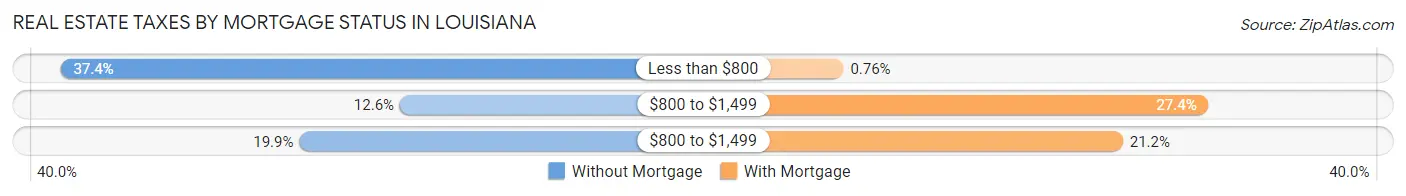
| Property Taxes | Without Mortgage | With Mortgage |
| Less than $800 | 211,662 (37.4%) | 4,682 (0.8%) |
| $800 to $1,499 | 71,228 (12.6%) | 169,998 (27.4%) |
| $800 to $1,499 | 112,836 (19.9%) | 131,121 (21.2%) |
| Total | 566,195 (100.0%) | 619,438 (100.0%) |
Health & Disability in Louisiana
Health Insurance Coverage by Age in Louisiana
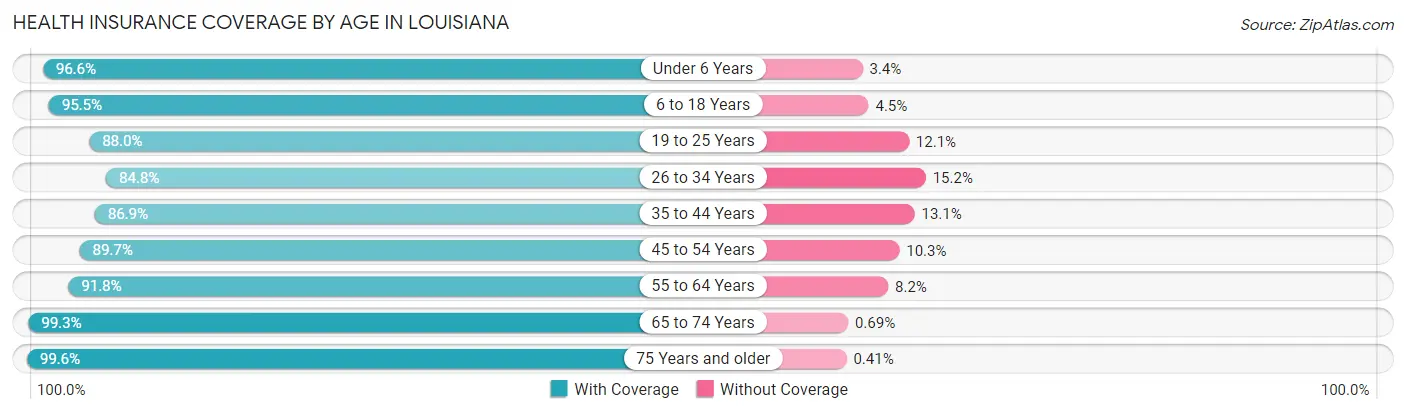
| Age Bracket | With Coverage | Without Coverage |
| Under 6 Years | 336,026 (96.6%) | 11,844 (3.4%) |
| 6 to 18 Years | 758,756 (95.5%) | 35,935 (4.5%) |
| 19 to 25 Years | 369,730 (87.9%) | 50,643 (12.0%) |
| 26 to 34 Years | 469,458 (84.8%) | 84,073 (15.2%) |
| 35 to 44 Years | 506,096 (86.9%) | 76,286 (13.1%) |
| 45 to 54 Years | 477,456 (89.7%) | 54,603 (10.3%) |
| 55 to 64 Years | 541,551 (91.8%) | 48,206 (8.2%) |
| 65 to 74 Years | 441,234 (99.3%) | 3,063 (0.7%) |
| 75 Years and older | 277,164 (99.6%) | 1,140 (0.4%) |
| Total | 4,177,471 (91.9%) | 365,793 (8.1%) |
Health Insurance Coverage by Citizenship Status in Louisiana
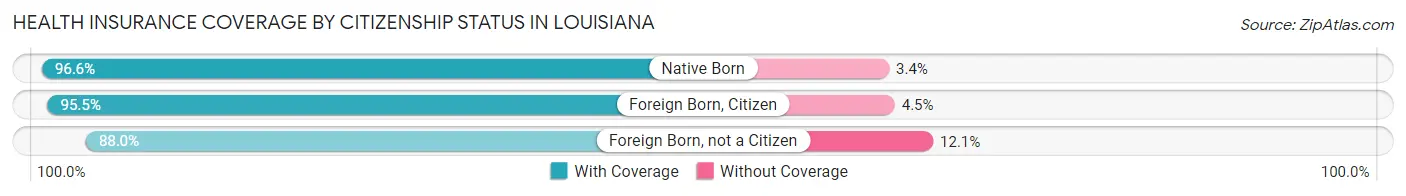
| Citizenship Status | With Coverage | Without Coverage |
| Native Born | 336,026 (96.6%) | 11,844 (3.4%) |
| Foreign Born, Citizen | 758,756 (95.5%) | 35,935 (4.5%) |
| Foreign Born, not a Citizen | 369,730 (87.9%) | 50,643 (12.0%) |
Health Insurance Coverage by Household Income in Louisiana
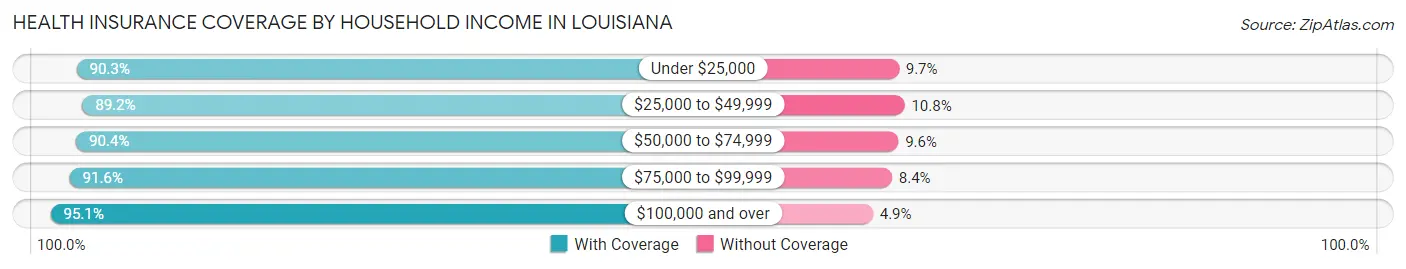
| Household Income | With Coverage | Without Coverage |
| Under $25,000 | 711,304 (90.3%) | 76,791 (9.7%) |
| $25,000 to $49,999 | 766,878 (89.2%) | 92,936 (10.8%) |
| $50,000 to $74,999 | 646,775 (90.4%) | 68,964 (9.6%) |
| $75,000 to $99,999 | 516,900 (91.6%) | 47,639 (8.4%) |
| $100,000 and over | 1,495,484 (95.1%) | 76,540 (4.9%) |
Public vs Private Health Insurance Coverage by Age in Louisiana
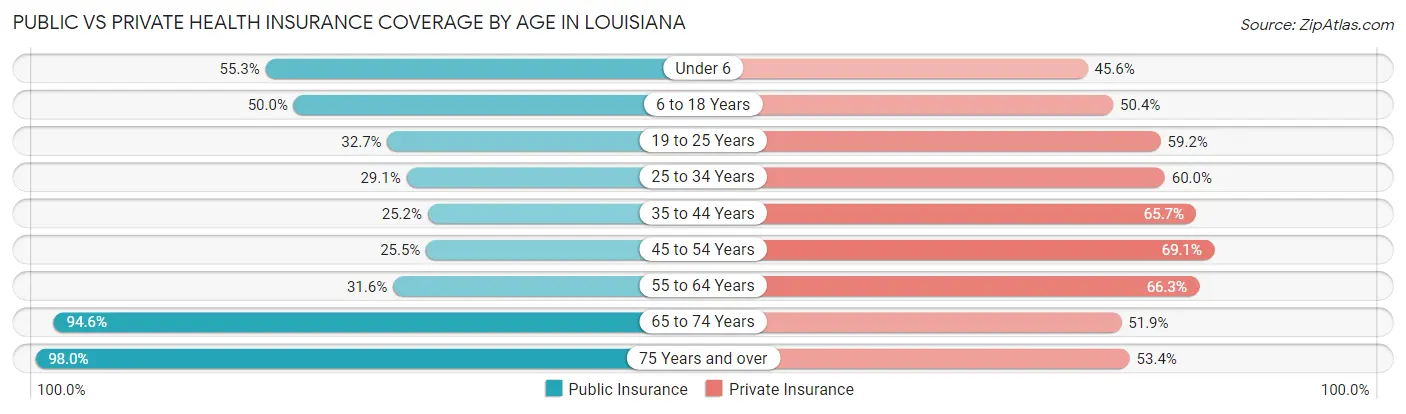
| Age Bracket | Public Insurance | Private Insurance |
| Under 6 | 192,258 (55.3%) | 158,660 (45.6%) |
| 6 to 18 Years | 397,700 (50.0%) | 400,263 (50.4%) |
| 19 to 25 Years | 137,289 (32.7%) | 248,824 (59.2%) |
| 25 to 34 Years | 161,177 (29.1%) | 331,871 (60.0%) |
| 35 to 44 Years | 146,525 (25.2%) | 382,684 (65.7%) |
| 45 to 54 Years | 135,438 (25.5%) | 367,376 (69.1%) |
| 55 to 64 Years | 186,493 (31.6%) | 390,718 (66.2%) |
| 65 to 74 Years | 420,363 (94.6%) | 230,547 (51.9%) |
| 75 Years and over | 272,819 (98.0%) | 148,694 (53.4%) |
| Total | 2,050,062 (45.1%) | 2,659,637 (58.5%) |
Disability Status by Sex by Age in Louisiana
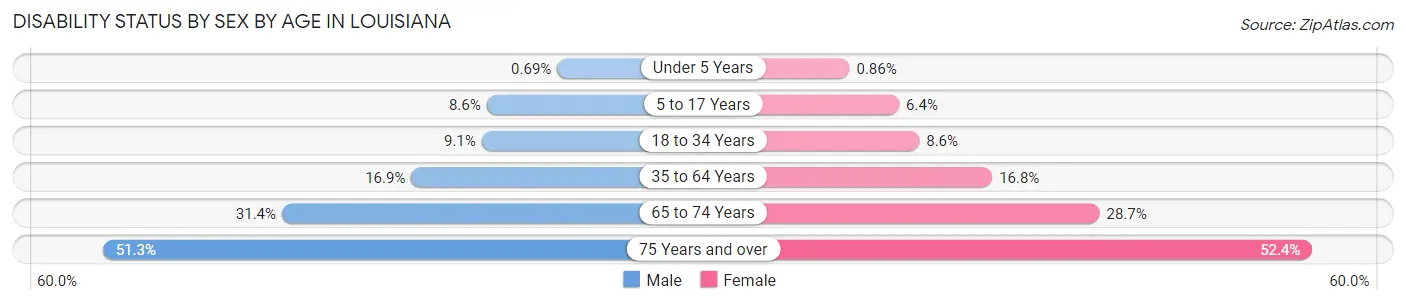
| Age Bracket | Male | Female |
| Under 5 Years | 1,023 (0.7%) | 1,226 (0.9%) |
| 5 to 17 Years | 34,636 (8.6%) | 24,714 (6.4%) |
| 18 to 34 Years | 46,002 (9.1%) | 45,687 (8.6%) |
| 35 to 64 Years | 139,121 (16.9%) | 147,938 (16.8%) |
| 65 to 74 Years | 64,677 (31.4%) | 68,332 (28.7%) |
| 75 Years and over | 58,517 (51.3%) | 86,039 (52.4%) |
Disability Class by Sex by Age in Louisiana
Disability Class: Hearing Difficulty
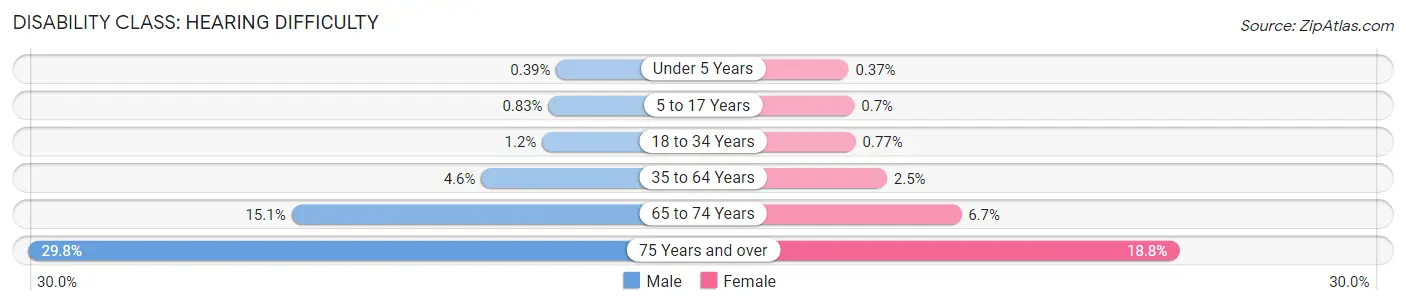
| Age Bracket | Male | Female |
| Under 5 Years | 581 (0.4%) | 528 (0.4%) |
| 5 to 17 Years | 3,372 (0.8%) | 2,725 (0.7%) |
| 18 to 34 Years | 5,972 (1.2%) | 4,054 (0.8%) |
| 35 to 64 Years | 37,538 (4.6%) | 22,144 (2.5%) |
| 65 to 74 Years | 31,241 (15.1%) | 15,837 (6.7%) |
| 75 Years and over | 33,970 (29.8%) | 30,836 (18.8%) |
Disability Class: Vision Difficulty
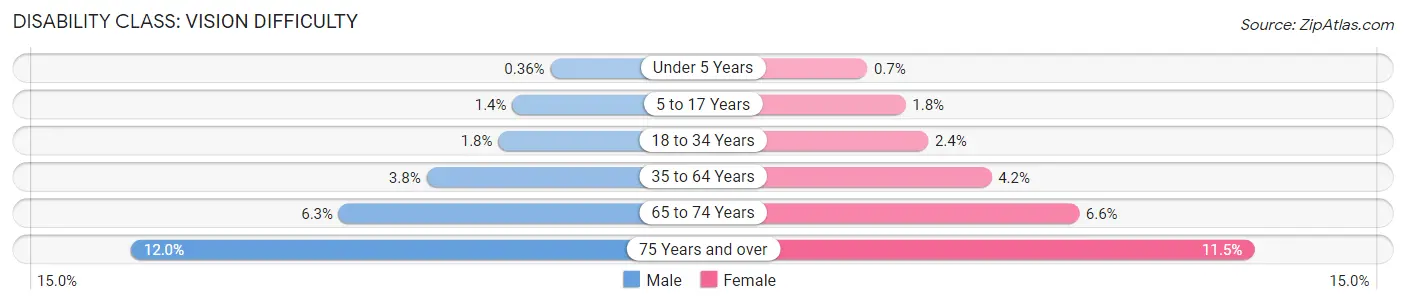
| Age Bracket | Male | Female |
| Under 5 Years | 537 (0.4%) | 988 (0.7%) |
| 5 to 17 Years | 5,771 (1.4%) | 6,856 (1.8%) |
| 18 to 34 Years | 9,162 (1.8%) | 12,736 (2.4%) |
| 35 to 64 Years | 31,293 (3.8%) | 36,770 (4.2%) |
| 65 to 74 Years | 12,889 (6.2%) | 15,708 (6.6%) |
| 75 Years and over | 13,738 (12.0%) | 18,854 (11.5%) |
Disability Class: Cognitive Difficulty
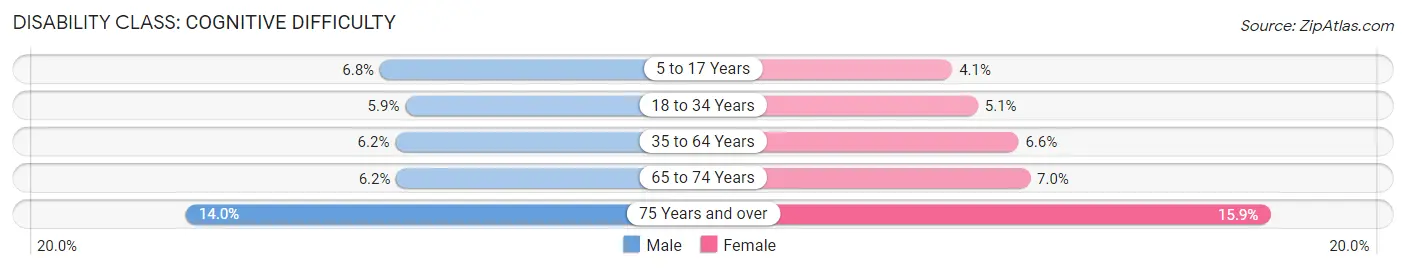
| Age Bracket | Male | Female |
| 5 to 17 Years | 27,591 (6.8%) | 15,842 (4.1%) |
| 18 to 34 Years | 29,641 (5.9%) | 26,737 (5.1%) |
| 35 to 64 Years | 51,250 (6.2%) | 57,930 (6.6%) |
| 65 to 74 Years | 12,796 (6.2%) | 16,626 (7.0%) |
| 75 Years and over | 15,981 (14.0%) | 26,122 (15.9%) |
Disability Class: Ambulatory Difficulty
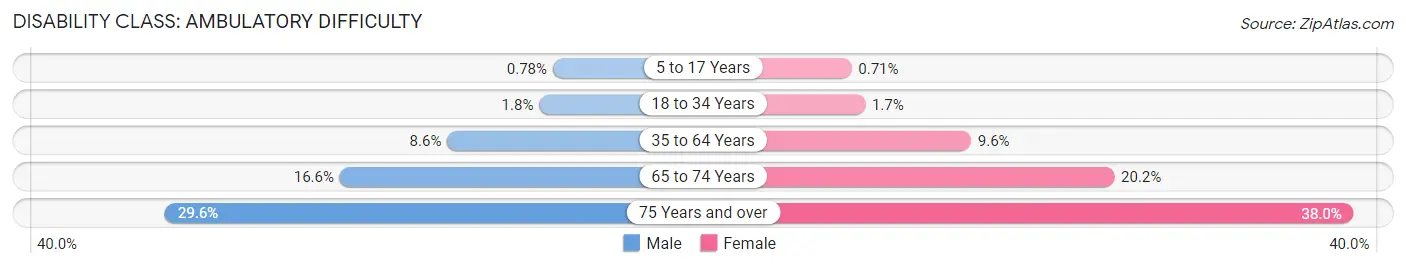
| Age Bracket | Male | Female |
| 5 to 17 Years | 3,144 (0.8%) | 2,739 (0.7%) |
| 18 to 34 Years | 9,059 (1.8%) | 9,084 (1.7%) |
| 35 to 64 Years | 70,734 (8.6%) | 84,586 (9.6%) |
| 65 to 74 Years | 34,256 (16.6%) | 48,127 (20.2%) |
| 75 Years and over | 33,740 (29.6%) | 62,414 (38.0%) |
Disability Class: Self-Care Difficulty
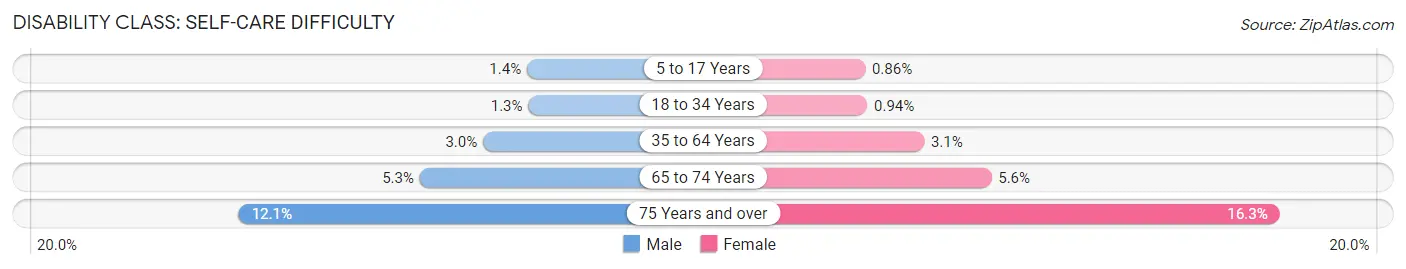
| Age Bracket | Male | Female |
| 5 to 17 Years | 5,476 (1.3%) | 3,307 (0.9%) |
| 18 to 34 Years | 6,564 (1.3%) | 4,991 (0.9%) |
| 35 to 64 Years | 24,502 (3.0%) | 26,975 (3.0%) |
| 65 to 74 Years | 11,000 (5.3%) | 13,203 (5.6%) |
| 75 Years and over | 13,743 (12.0%) | 26,690 (16.3%) |
Technology Access in Louisiana
Computing Device Access in Louisiana
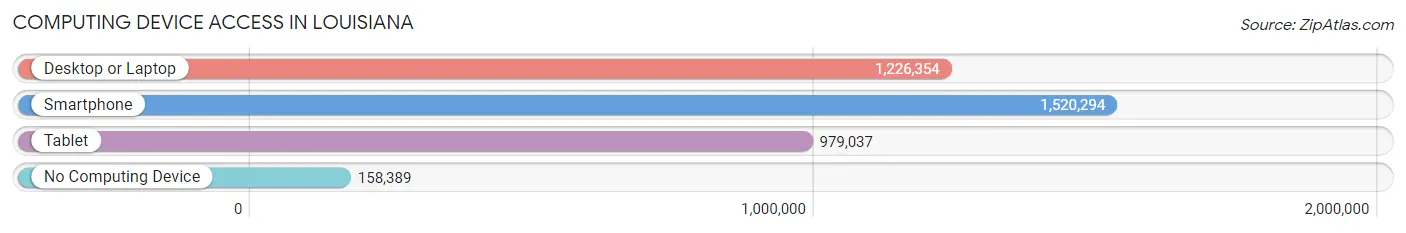
| Device Type | # Households | % Households |
| Desktop or Laptop | 1,226,354 | 69.5% |
| Smartphone | 1,520,294 | 86.1% |
| Tablet | 979,037 | 55.5% |
| No Computing Device | 158,389 | 9.0% |
| Total | 1,765,264 | 100.0% |
Internet Access in Louisiana
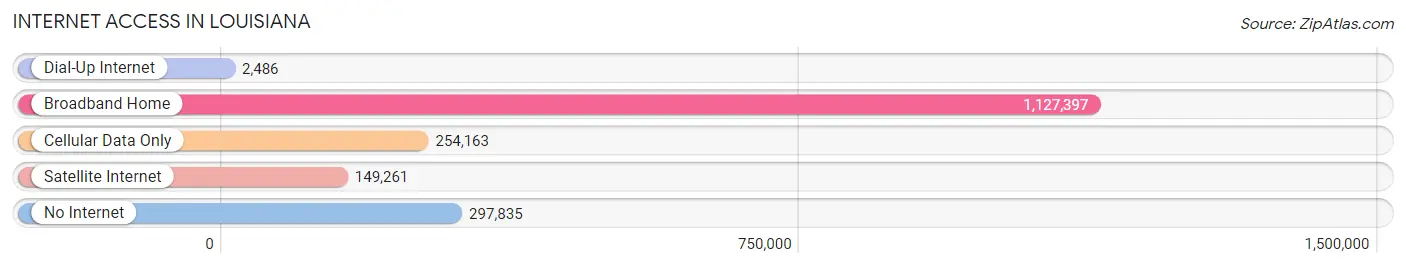
| Internet Type | # Households | % Households |
| Dial-Up Internet | 2,486 | 0.1% |
| Broadband Home | 1,127,397 | 63.9% |
| Cellular Data Only | 254,163 | 14.4% |
| Satellite Internet | 149,261 | 8.5% |
| No Internet | 297,835 | 16.9% |
| Total | 1,765,264 | 100.0% |
Louisiana Summary
Louisiana is a state located in the southern region of the United States. It is bordered by Arkansas to the north, Mississippi to the east, and the Gulf of Mexico to the south and west. Louisiana is the 25th most populous state in the United States, with an estimated population of 4.6 million people in 2019.
History
The area that is now Louisiana was first inhabited by Native American tribes, including the Choctaw, Houma, and Chitimacha. The first Europeans to explore the area were the Spanish, who arrived in the 16th century. The French then established a colony in the area in 1699, naming it Louisiana in honor of King Louis XIV. The French colony was ceded to Spain in 1763, and then to the United States in 1803 as part of the Louisiana Purchase.
Louisiana became the 18th state in the Union in 1812. During the Civil War, Louisiana seceded from the Union and joined the Confederate States of America. After the war, Louisiana was readmitted to the Union in 1868.
Geography
Louisiana is located in the southern region of the United States. It is bordered by Arkansas to the north, Mississippi to the east, and the Gulf of Mexico to the south and west. Louisiana is the 33rd largest state in the United States, with an area of 51,843 square miles.
The state is divided into five regions: the Northshore, the Southshore, the Central Gulf Coast, the Mississippi Delta, and the Ouachita Mountains. The state is home to a variety of landscapes, including swamps, bayous, and coastal wetlands. The highest point in the state is Driskill Mountain, which has an elevation of 535 feet.
Economy
Louisiana has a diverse economy, with a variety of industries contributing to its overall economic output. The state’s largest industries include oil and gas, agriculture, manufacturing, and tourism.
Oil and gas are the state’s largest industry, accounting for over one-third of the state’s total economic output. Louisiana is home to a number of oil and gas companies, including Chevron, Shell, and ExxonMobil.
Agriculture is also an important part of the state’s economy. Louisiana is the leading producer of crawfish in the United States, and is also a major producer of cotton, soybeans, rice, and sugarcane.
Manufacturing is another major industry in Louisiana. The state is home to a number of manufacturing companies, including Boeing, General Electric, and Northrop Grumman.
Tourism is also an important part of the state’s economy. Louisiana is home to a number of popular tourist destinations, including New Orleans, Baton Rouge, and Shreveport.
Demographics
As of 2019, Louisiana had an estimated population of 4.6 million people. The state is racially diverse, with the largest racial groups being White (60.7%), African American (32.5%), and Hispanic or Latino (4.2%).
The largest cities in Louisiana are New Orleans, Baton Rouge, Shreveport, and Lafayette. The state’s capital is Baton Rouge.
Louisiana is home to a number of major universities, including Louisiana State University, Tulane University, and the University of Louisiana at Lafayette. The state is also home to a number of professional sports teams, including the New Orleans Saints (NFL), the New Orleans Pelicans (NBA), and the New Orleans Baby Cakes (minor league baseball).
Common Questions
When was Louisiana Incorporated?
Louisiana was Incorporated into the Union on Apr 30, 1812.
What is the Total Area of Louisiana?
Total Area of Louisiana is 51,988 Square Miles.
What is the Total Land Area of Louisiana?
Total Land Area of Louisiana is 43,199 Square Miles.
What is the Total Water Area of Louisiana?
Total Water Area of Louisiana is 8,789 Square Miles.
What is the Average Elevation in Louisiana?
Average Elevation in Louisiana is 100 Feet.
What is the Highest Elevation in Louisiana?
Highest Elevation in Louisiana is 535 Feet.
What is the Lowest Elevation in Louisiana?
Lowest Elevation in Louisiana is -8 Feet.
What is the Population Density in Louisiana?
Population Density in Louisiana is 107.4 People per Square Mile.
What is Per Capita Income in Louisiana?
Per Capita income in Louisiana is $32,981.
What is the Median Family Income in Louisiana?
Median Family Income in Louisiana is $74,911.
What is the Median Household income in Louisiana?
Median Household Income in Louisiana is $57,852.
What is Income or Wage Gap in Louisiana?
Income or Wage Gap in Louisiana is 37.0%.
Women in Louisiana earn 63.0 cents for every dollar earned by a man.
What is Family Income Deficit in Louisiana?
Family Income Deficit in Louisiana is $10,997.
Families that are below poverty line in Louisiana earn $10,997 less on average than the poverty threshold level.
What is Inequality or Gini Index in Louisiana?
Inequality or Gini Index in Louisiana is 0.50.
What is the Total Population of Louisiana?
Total Population of Louisiana is 4,640,546.
What is the Total Male Population of Louisiana?
Total Male Population of Louisiana is 2,275,349.
What is the Total Female Population of Louisiana?
Total Female Population of Louisiana is 2,365,197.
What is the Ratio of Males per 100 Females in Louisiana?
There are 96.20 Males per 100 Females in Louisiana.
What is the Ratio of Females per 100 Males in Louisiana?
There are 103.95 Females per 100 Males in Louisiana.
What is the Median Population Age in Louisiana?
Median Population Age in Louisiana is 37.6 Years.
What is the Average Family Size in Louisiana
Average Family Size in Louisiana is 3.2 People.
What is the Average Household Size in Louisiana
Average Household Size in Louisiana is 2.6 People.
How Large is the Labor Force in Louisiana?
There are 2,178,498 People in the Labor Forcein in Louisiana.
What is the Percentage of People in the Labor Force in Louisiana?
59.2% of People are in the Labor Force in Louisiana.
What is the Unemployment Rate in Louisiana?
Unemployment Rate in Louisiana is 6.6%.