Cities with the Highest Percentage of Population Employed in Installation, Maintenance & Repair in Pennsylvania
RELATED REPORTS & OPTIONS
Installation, Maintenance & Repair
Pennsylvania
Compare Cities
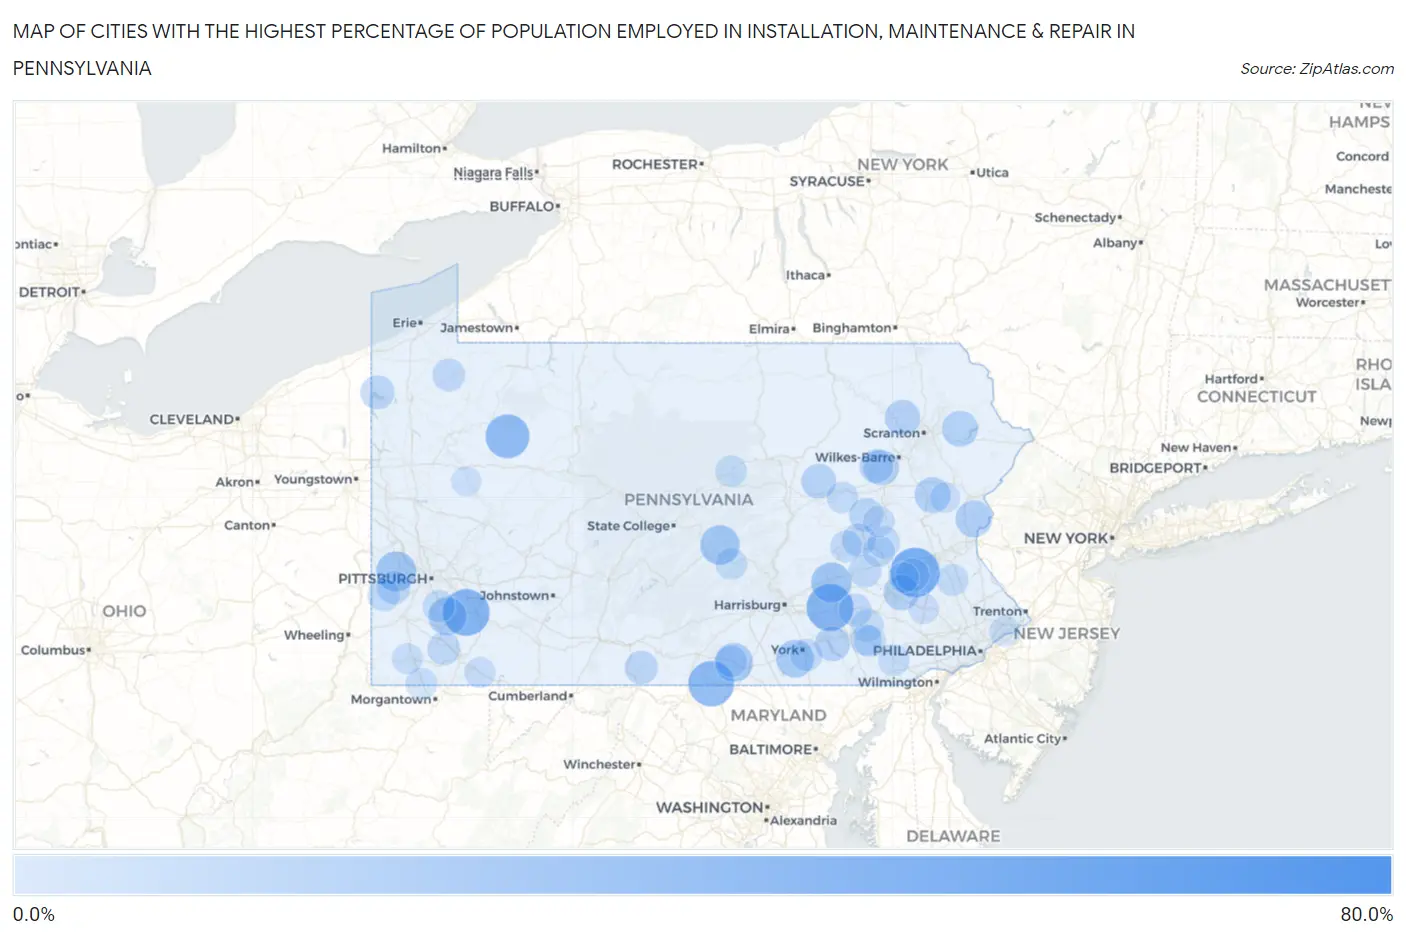
Map of Cities with the Highest Percentage of Population Employed in Installation, Maintenance & Repair in Pennsylvania
0.0%
80.0%
Cities with the Highest Percentage of Population Employed in Installation, Maintenance & Repair in Pennsylvania
| City | % Employed | vs State | vs National | |
| 1. | Fisherville | 66.7% | 3.1%(+63.6)#1 | 3.1%(+63.6)#35 |
| 2. | Jugtown | 62.5% | 3.1%(+59.4)#2 | 3.1%(+59.4)#38 |
| 3. | Bowers | 45.7% | 3.1%(+42.7)#3 | 3.1%(+42.7)#101 |
| 4. | Timber Hills | 40.9% | 3.1%(+37.8)#4 | 3.1%(+37.8)#137 |
| 5. | Yukon | 40.7% | 3.1%(+37.6)#5 | 3.1%(+37.7)#139 |
| 6. | Brooks Mill | 39.8% | 3.1%(+36.7)#6 | 3.1%(+36.7)#145 |
| 7. | Rouzerville | 38.3% | 3.1%(+35.2)#7 | 3.1%(+35.3)#162 |
| 8. | Tylersburg | 35.5% | 3.1%(+32.4)#8 | 3.1%(+32.4)#190 |
| 9. | St. Clair | 35.3% | 3.1%(+32.2)#9 | 3.1%(+32.2)#194 |
| 10. | Olivia | 32.6% | 3.1%(+29.5)#10 | 3.1%(+29.5)#244 |
| 11. | Geeseytown | 31.5% | 3.1%(+28.4)#11 | 3.1%(+28.4)#259 |
| 12. | Trainer Borough | 30.5% | 3.1%(+27.4)#12 | 3.1%(+27.5)#277 |
| 13. | Jonestown | 28.6% | 3.1%(+25.5)#13 | 3.1%(+25.5)#319 |
| 14. | Clinton | 27.9% | 3.1%(+24.8)#14 | 3.1%(+24.8)#333 |
| 15. | Alfarata | 27.4% | 3.1%(+24.3)#15 | 3.1%(+24.3)#345 |
| 16. | Woolrich | 27.1% | 3.1%(+24.0)#16 | 3.1%(+24.0)#355 |
| 17. | Mcknightstown | 25.6% | 3.1%(+22.5)#17 | 3.1%(+22.6)#388 |
| 18. | Webster | 25.0% | 3.1%(+21.9)#18 | 3.1%(+21.9)#415 |
| 19. | Carson Valley | 25.0% | 3.1%(+21.9)#19 | 3.1%(+21.9)#417 |
| 20. | New Salem | 24.2% | 3.1%(+21.1)#20 | 3.1%(+21.1)#450 |
| 21. | Robeson Extension | 23.5% | 3.1%(+20.4)#21 | 3.1%(+20.5)#479 |
| 22. | Roseville Borough | 22.7% | 3.1%(+19.6)#22 | 3.1%(+19.7)#513 |
| 23. | Ackermanville | 22.1% | 3.1%(+19.0)#23 | 3.1%(+19.0)#539 |
| 24. | Towamensing Trails | 20.9% | 3.1%(+17.8)#24 | 3.1%(+17.8)#610 |
| 25. | The Hideout | 20.8% | 3.1%(+17.7)#25 | 3.1%(+17.7)#620 |
| 26. | Stony Creek Mills | 20.3% | 3.1%(+17.2)#26 | 3.1%(+17.2)#657 |
| 27. | Wanamie | 20.2% | 3.1%(+17.1)#27 | 3.1%(+17.1)#663 |
| 28. | Clappertown | 20.0% | 3.1%(+16.9)#28 | 3.1%(+16.9)#679 |
| 29. | Lake Winola | 19.9% | 3.1%(+16.8)#29 | 3.1%(+16.8)#686 |
| 30. | Shirleysburg Borough | 19.3% | 3.1%(+16.2)#30 | 3.1%(+16.2)#714 |
| 31. | Washington Boro | 19.2% | 3.1%(+16.1)#31 | 3.1%(+16.2)#722 |
| 32. | Jerseytown | 18.9% | 3.1%(+15.8)#32 | 3.1%(+15.9)#735 |
| 33. | West Middletown Borough | 18.4% | 3.1%(+15.3)#33 | 3.1%(+15.4)#775 |
| 34. | Royer | 18.2% | 3.1%(+15.1)#34 | 3.1%(+15.1)#804 |
| 35. | Henrietta | 17.5% | 3.1%(+14.4)#35 | 3.1%(+14.4)#862 |
| 36. | Pymatuning North | 17.4% | 3.1%(+14.3)#36 | 3.1%(+14.3)#864 |
| 37. | Brandonville | 17.3% | 3.1%(+14.2)#37 | 3.1%(+14.2)#874 |
| 38. | Glen Lyon | 16.9% | 3.1%(+13.8)#38 | 3.1%(+13.8)#915 |
| 39. | Dryville | 16.4% | 3.1%(+13.3)#39 | 3.1%(+13.3)#978 |
| 40. | Bulger | 16.2% | 3.1%(+13.1)#40 | 3.1%(+13.1)#995 |
| 41. | Seltzer | 16.2% | 3.1%(+13.1)#41 | 3.1%(+13.1)#998 |
| 42. | Needmore | 16.2% | 3.1%(+13.1)#42 | 3.1%(+13.1)#999 |
| 43. | Nottingham | 15.8% | 3.1%(+12.7)#43 | 3.1%(+12.7)#1,047 |
| 44. | Cross Roads Borough | 15.6% | 3.1%(+12.5)#44 | 3.1%(+12.5)#1,061 |
| 45. | Republic | 15.5% | 3.1%(+12.4)#45 | 3.1%(+12.5)#1,066 |
| 46. | East Altoona | 15.4% | 3.1%(+12.3)#46 | 3.1%(+12.3)#1,078 |
| 47. | Lincolnville | 15.4% | 3.1%(+12.3)#47 | 3.1%(+12.3)#1,089 |
| 48. | Strausstown | 15.3% | 3.1%(+12.2)#48 | 3.1%(+12.2)#1,105 |
| 49. | Hopeland | 15.3% | 3.1%(+12.2)#49 | 3.1%(+12.2)#1,109 |
| 50. | Alexandria Borough | 15.3% | 3.1%(+12.2)#50 | 3.1%(+12.2)#1,111 |
| 51. | Cornwall Borough | 15.0% | 3.1%(+12.0)#51 | 3.1%(+12.0)#1,150 |
| 52. | Cross Creek | 14.8% | 3.1%(+11.7)#52 | 3.1%(+11.7)#1,195 |
| 53. | Mckeansburg | 14.7% | 3.1%(+11.6)#53 | 3.1%(+11.6)#1,204 |
| 54. | Marion Heights Borough | 14.6% | 3.1%(+11.6)#54 | 3.1%(+11.6)#1,207 |
| 55. | Tyler Run | 14.6% | 3.1%(+11.5)#55 | 3.1%(+11.5)#1,216 |
| 56. | Farmersville | 14.4% | 3.1%(+11.3)#56 | 3.1%(+11.4)#1,244 |
| 57. | Paint Borough | 14.3% | 3.1%(+11.2)#57 | 3.1%(+11.3)#1,259 |
| 58. | Elrama | 14.3% | 3.1%(+11.2)#58 | 3.1%(+11.2)#1,268 |
| 59. | Newtown | 13.9% | 3.1%(+10.8)#59 | 3.1%(+10.9)#1,350 |
| 60. | Milford Square | 13.9% | 3.1%(+10.8)#60 | 3.1%(+10.8)#1,356 |
| 61. | Newburg | 13.8% | 3.1%(+10.7)#61 | 3.1%(+10.8)#1,376 |
| 62. | Tylersville | 13.6% | 3.1%(+10.5)#62 | 3.1%(+10.6)#1,404 |
| 63. | Beallsville Borough | 13.6% | 3.1%(+10.5)#63 | 3.1%(+10.5)#1,419 |
| 64. | Deer Lake | 13.4% | 3.1%(+10.3)#64 | 3.1%(+10.4)#1,456 |
| 65. | Mexico | 13.4% | 3.1%(+10.3)#65 | 3.1%(+10.3)#1,461 |
| 66. | Yarnell | 13.4% | 3.1%(+10.3)#66 | 3.1%(+10.3)#1,466 |
| 67. | Cashtown | 13.4% | 3.1%(+10.3)#67 | 3.1%(+10.3)#1,469 |
| 68. | Upland Borough | 13.4% | 3.1%(+10.3)#68 | 3.1%(+10.3)#1,474 |
| 69. | Mcelhattan | 13.4% | 3.1%(+10.3)#69 | 3.1%(+10.3)#1,475 |
| 70. | Mount Morris | 13.3% | 3.1%(+10.2)#70 | 3.1%(+10.3)#1,480 |
| 71. | Donegal Borough | 13.3% | 3.1%(+10.2)#71 | 3.1%(+10.3)#1,484 |
| 72. | Gordonville | 13.2% | 3.1%(+10.1)#72 | 3.1%(+10.1)#1,523 |
| 73. | Mainville | 13.1% | 3.1%(+10.0)#73 | 3.1%(+10.0)#1,537 |
| 74. | Ronks | 13.1% | 3.1%(+9.99)#74 | 3.1%(+10.0)#1,543 |
| 75. | Cochranville | 13.0% | 3.1%(+9.93)#75 | 3.1%(+9.96)#1,566 |
| 76. | Fawn Grove Borough | 12.6% | 3.1%(+9.48)#76 | 3.1%(+9.50)#1,675 |
| 77. | Park Crest | 12.6% | 3.1%(+9.46)#77 | 3.1%(+9.49)#1,682 |
| 78. | Landisburg Borough | 12.5% | 3.1%(+9.41)#78 | 3.1%(+9.43)#1,697 |
| 79. | Burnside Borough | 12.5% | 3.1%(+9.41)#79 | 3.1%(+9.43)#1,699 |
| 80. | West Waynesburg | 12.3% | 3.1%(+9.19)#80 | 3.1%(+9.22)#1,749 |
| 81. | Eddington | 12.3% | 3.1%(+9.18)#81 | 3.1%(+9.21)#1,758 |
| 82. | Vintondale Borough | 12.3% | 3.1%(+9.18)#82 | 3.1%(+9.20)#1,759 |
| 83. | New Salem Borough | 12.3% | 3.1%(+9.16)#83 | 3.1%(+9.19)#1,764 |
| 84. | Farmington | 12.0% | 3.1%(+8.91)#84 | 3.1%(+8.93)#1,827 |
| 85. | Morea | 11.8% | 3.1%(+8.67)#85 | 3.1%(+8.70)#1,897 |
| 86. | Casselman Borough | 11.8% | 3.1%(+8.67)#86 | 3.1%(+8.70)#1,900 |
| 87. | Hughestown Borough | 11.6% | 3.1%(+8.50)#87 | 3.1%(+8.52)#1,943 |
| 88. | Lewisberry Borough | 11.5% | 3.1%(+8.45)#88 | 3.1%(+8.47)#1,962 |
| 89. | Townville Borough | 11.5% | 3.1%(+8.45)#89 | 3.1%(+8.47)#1,965 |
| 90. | Elderton Borough | 11.5% | 3.1%(+8.45)#90 | 3.1%(+8.47)#1,966 |
| 91. | Sylvania Borough | 11.5% | 3.1%(+8.40)#91 | 3.1%(+8.43)#1,983 |
| 92. | South Pottstown | 11.3% | 3.1%(+8.26)#92 | 3.1%(+8.28)#2,036 |
| 93. | Sun Valley | 11.1% | 3.1%(+7.98)#93 | 3.1%(+8.00)#2,128 |
| 94. | Monroe Borough | 11.0% | 3.1%(+7.93)#94 | 3.1%(+7.96)#2,137 |
| 95. | Walnuttown | 11.0% | 3.1%(+7.92)#95 | 3.1%(+7.95)#2,139 |
| 96. | Runville | 10.9% | 3.1%(+7.83)#96 | 3.1%(+7.85)#2,164 |
| 97. | Marklesburg Borough | 10.9% | 3.1%(+7.79)#97 | 3.1%(+7.82)#2,184 |
| 98. | Moose Run | 10.7% | 3.1%(+7.65)#98 | 3.1%(+7.68)#2,233 |
| 99. | Fredericksburg | 10.6% | 3.1%(+7.55)#99 | 3.1%(+7.57)#2,271 |
| 100. | Parker | 10.6% | 3.1%(+7.51)#100 | 3.1%(+7.53)#2,289 |
Common Questions
What are the Top 10 Cities with the Highest Percentage of Population Employed in Installation, Maintenance & Repair in Pennsylvania?
Top 10 Cities with the Highest Percentage of Population Employed in Installation, Maintenance & Repair in Pennsylvania are:
#1
45.7%
#2
40.9%
#3
40.7%
#4
38.3%
#5
35.5%
#6
28.6%
#7
27.9%
#8
27.4%
#9
25.6%
#10
25.0%
What city has the Highest Percentage of Population Employed in Installation, Maintenance & Repair in Pennsylvania?
Bowers has the Highest Percentage of Population Employed in Installation, Maintenance & Repair in Pennsylvania with 45.7%.
What is the Percentage of Population Employed in Installation, Maintenance & Repair in the State of Pennsylvania?
Percentage of Population Employed in Installation, Maintenance & Repair in Pennsylvania is 3.1%.
What is the Percentage of Population Employed in Installation, Maintenance & Repair in the United States?
Percentage of Population Employed in Installation, Maintenance & Repair in the United States is 3.1%.