Zip Codes with the Highest Percentage of Population Employed in Installation, Maintenance & Repair in Chula Vista, CA
RELATED REPORTS & OPTIONS
Installation, Maintenance & Repair
Chula Vista
Compare Zip Codes
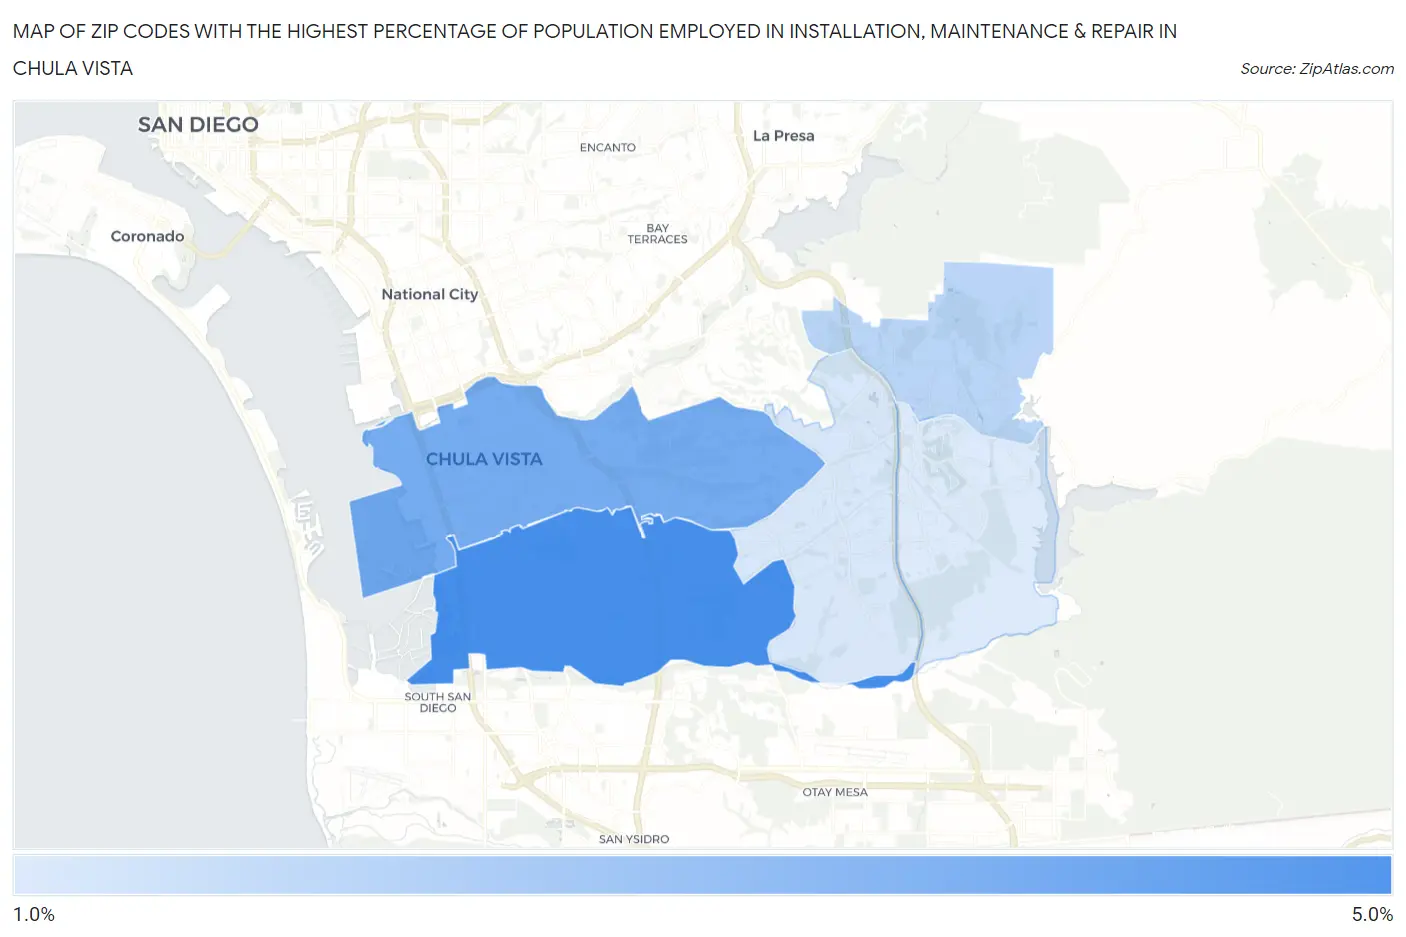
Map of Zip Codes with the Highest Percentage of Population Employed in Installation, Maintenance & Repair in Chula Vista
1.0%
4.3%
Zip Codes with the Highest Percentage of Population Employed in Installation, Maintenance & Repair in Chula Vista, CA
| Zip Code | % Employed | vs State | vs National | |
| 1. | 91911 | 4.3% | 2.6%(+1.75)#281 | 3.1%(+1.24)#11,115 |
| 2. | 91910 | 3.3% | 2.6%(+0.718)#507 | 3.1%(+0.207)#15,683 |
| 3. | 91914 | 1.8% | 2.6%(-0.791)#1,040 | 3.1%(-1.30)#23,048 |
| 4. | 91913 | 1.1% | 2.6%(-1.44)#1,218 | 3.1%(-1.95)#25,531 |
| 5. | 91915 | 1.0% | 2.6%(-1.51)#1,237 | 3.1%(-2.02)#25,787 |
1
Common Questions
What are the Top 3 Zip Codes with the Highest Percentage of Population Employed in Installation, Maintenance & Repair in Chula Vista, CA?
Top 3 Zip Codes with the Highest Percentage of Population Employed in Installation, Maintenance & Repair in Chula Vista, CA are:
What zip code has the Highest Percentage of Population Employed in Installation, Maintenance & Repair in Chula Vista, CA?
91911 has the Highest Percentage of Population Employed in Installation, Maintenance & Repair in Chula Vista, CA with 4.3%.
What is the Percentage of Population Employed in Installation, Maintenance & Repair in Chula Vista, CA?
Percentage of Population Employed in Installation, Maintenance & Repair in Chula Vista is 2.8%.
What is the Percentage of Population Employed in Installation, Maintenance & Repair in California?
Percentage of Population Employed in Installation, Maintenance & Repair in California is 2.6%.
What is the Percentage of Population Employed in Installation, Maintenance & Repair in the United States?
Percentage of Population Employed in Installation, Maintenance & Repair in the United States is 3.1%.