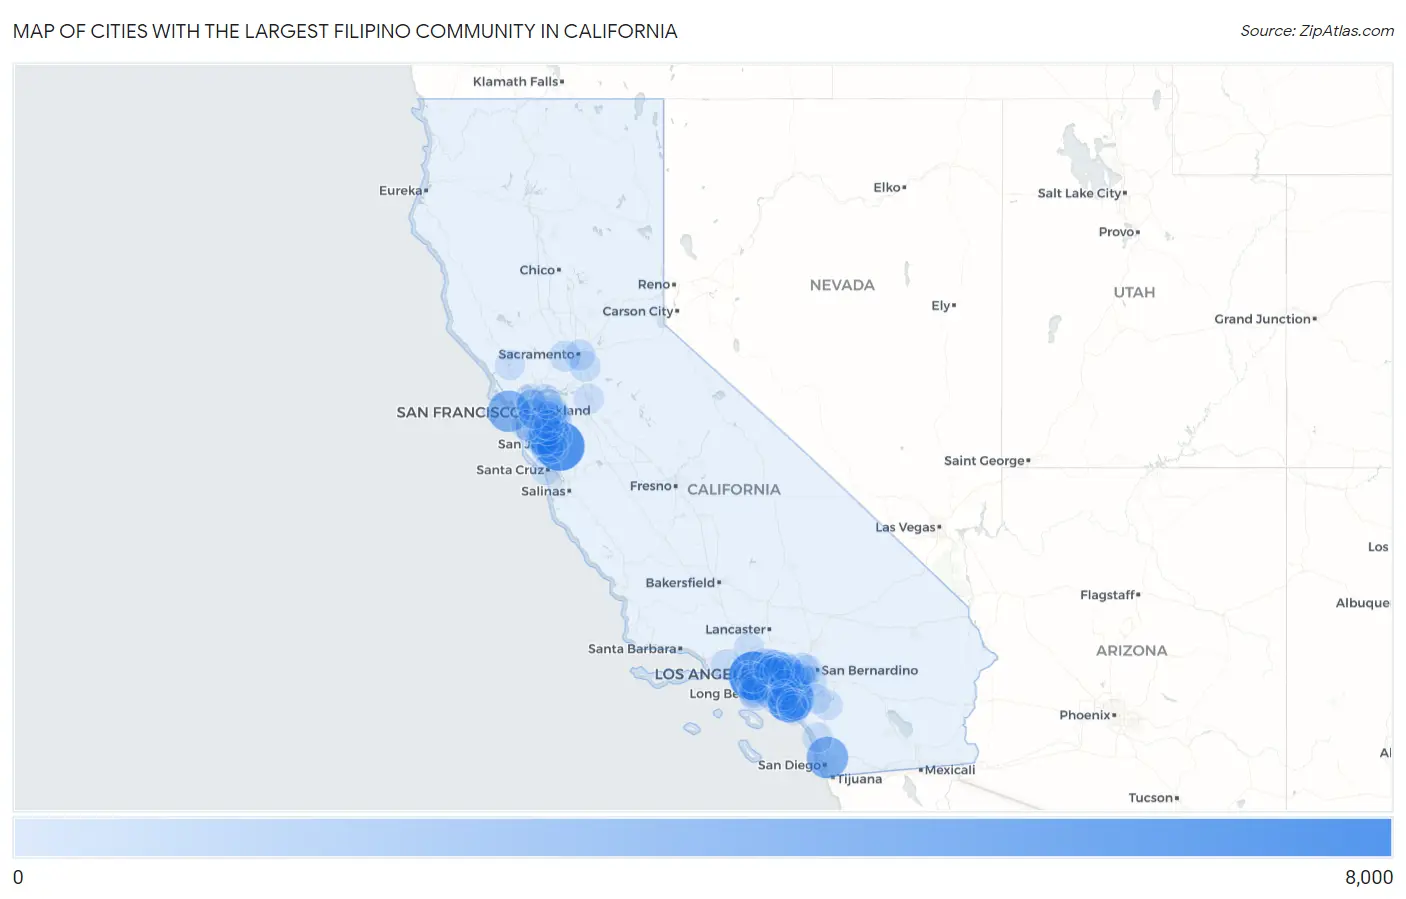
Cities with the Largest Filipino Community in California
RELATED REPORTS & OPTIONS
Filipino
California
Compare Cities
Map of Cities with the Largest Filipino Community in California
0
8,000
Cities with the Largest Filipino Community in California
| City | Filipino | vs State | vs National | |
| 1. | Los Angeles | 7,926 | 120,868(6.56%)#1 | 280,778(2.82%)#2 |
| 2. | San Jose | 7,790 | 120,868(6.45%)#2 | 280,778(2.77%)#3 |
| 3. | Irvine | 7,096 | 120,868(5.87%)#3 | 280,778(2.53%)#4 |
| 4. | San Francisco | 4,722 | 120,868(3.91%)#4 | 280,778(1.68%)#5 |
| 5. | San Diego | 4,660 | 120,868(3.86%)#5 | 280,778(1.66%)#6 |
| 6. | Fremont | 4,063 | 120,868(3.36%)#6 | 280,778(1.45%)#8 |
| 7. | Arcadia | 3,007 | 120,868(2.49%)#7 | 280,778(1.07%)#10 |
| 8. | Rowland Heights | 2,168 | 120,868(1.79%)#8 | 280,778(0.77%)#12 |
| 9. | Diamond Bar | 2,007 | 120,868(1.66%)#9 | 280,778(0.71%)#14 |
| 10. | Chino Hills | 1,927 | 120,868(1.59%)#10 | 280,778(0.69%)#16 |
| 11. | Sunnyvale | 1,848 | 120,868(1.53%)#11 | 280,778(0.66%)#17 |
| 12. | Cupertino | 1,681 | 120,868(1.39%)#12 | 280,778(0.60%)#18 |
| 13. | Mountain View | 1,588 | 120,868(1.31%)#13 | 280,778(0.57%)#19 |
| 14. | Cerritos | 1,497 | 120,868(1.24%)#14 | 280,778(0.53%)#20 |
| 15. | Hacienda Heights | 1,444 | 120,868(1.19%)#15 | 280,778(0.51%)#21 |
| 16. | Santa Clara | 1,401 | 120,868(1.16%)#16 | 280,778(0.50%)#22 |
| 17. | Oakland | 1,307 | 120,868(1.08%)#17 | 280,778(0.47%)#24 |
| 18. | Walnut | 1,231 | 120,868(1.02%)#18 | 280,778(0.44%)#26 |
| 19. | Alhambra | 1,204 | 120,868(1.00%)#19 | 280,778(0.43%)#28 |
| 20. | Pasadena | 1,022 | 120,868(0.85%)#20 | 280,778(0.36%)#30 |
| 21. | Torrance | 1,003 | 120,868(0.83%)#21 | 280,778(0.36%)#32 |
| 22. | Palo Alto | 996 | 120,868(0.82%)#22 | 280,778(0.35%)#33 |
| 23. | Berkeley | 981 | 120,868(0.81%)#23 | 280,778(0.35%)#34 |
| 24. | Saratoga | 967 | 120,868(0.80%)#24 | 280,778(0.34%)#35 |
| 25. | Temple City | 917 | 120,868(0.76%)#25 | 280,778(0.33%)#38 |
| 26. | Fullerton | 888 | 120,868(0.73%)#26 | 280,778(0.32%)#39 |
| 27. | San Marino | 883 | 120,868(0.73%)#27 | 280,778(0.31%)#40 |
| 28. | West Covina | 880 | 120,868(0.73%)#28 | 280,778(0.31%)#41 |
| 29. | Yorba Linda | 878 | 120,868(0.73%)#29 | 280,778(0.31%)#42 |
| 30. | Rancho Cucamonga | 855 | 120,868(0.71%)#30 | 280,778(0.30%)#43 |
| 31. | Rancho Palos Verdes | 833 | 120,868(0.69%)#31 | 280,778(0.30%)#44 |
| 32. | San Mateo | 826 | 120,868(0.68%)#32 | 280,778(0.29%)#46 |
| 33. | East San Gabriel | 801 | 120,868(0.66%)#33 | 280,778(0.29%)#49 |
| 34. | Lake Forest | 797 | 120,868(0.66%)#34 | 280,778(0.28%)#50 |
| 35. | Eastvale | 758 | 120,868(0.63%)#35 | 280,778(0.27%)#51 |
| 36. | Tustin | 719 | 120,868(0.59%)#36 | 280,778(0.26%)#53 |
| 37. | Cypress | 706 | 120,868(0.58%)#37 | 280,778(0.25%)#54 |
| 38. | Anaheim | 703 | 120,868(0.58%)#38 | 280,778(0.25%)#55 |
| 39. | Pleasanton | 694 | 120,868(0.57%)#39 | 280,778(0.25%)#56 |
| 40. | San Ramon | 693 | 120,868(0.57%)#40 | 280,778(0.25%)#57 |
| 41. | Santa Monica | 653 | 120,868(0.54%)#41 | 280,778(0.23%)#60 |
| 42. | San Gabriel | 653 | 120,868(0.54%)#42 | 280,778(0.23%)#61 |
| 43. | Milpitas | 642 | 120,868(0.53%)#43 | 280,778(0.23%)#64 |
| 44. | Brea | 634 | 120,868(0.52%)#44 | 280,778(0.23%)#65 |
| 45. | Riverside | 596 | 120,868(0.49%)#45 | 280,778(0.21%)#68 |
| 46. | Davis | 582 | 120,868(0.48%)#46 | 280,778(0.21%)#69 |
| 47. | Huntington Beach | 581 | 120,868(0.48%)#47 | 280,778(0.21%)#70 |
| 48. | San Dimas | 575 | 120,868(0.48%)#48 | 280,778(0.20%)#72 |
| 49. | Chino | 563 | 120,868(0.47%)#49 | 280,778(0.20%)#75 |
| 50. | Redondo Beach | 562 | 120,868(0.46%)#50 | 280,778(0.20%)#76 |
| 51. | Elk Grove | 535 | 120,868(0.44%)#51 | 280,778(0.19%)#81 |
| 52. | Thousand Oaks | 529 | 120,868(0.44%)#52 | 280,778(0.19%)#83 |
| 53. | Newport Beach | 529 | 120,868(0.44%)#53 | 280,778(0.19%)#84 |
| 54. | Monterey Park | 522 | 120,868(0.43%)#54 | 280,778(0.19%)#86 |
| 55. | Monrovia | 514 | 120,868(0.43%)#55 | 280,778(0.18%)#87 |
| 56. | Sacramento | 511 | 120,868(0.42%)#56 | 280,778(0.18%)#88 |
| 57. | Long Beach | 495 | 120,868(0.41%)#57 | 280,778(0.18%)#91 |
| 58. | Los Altos | 453 | 120,868(0.37%)#58 | 280,778(0.16%)#97 |
| 59. | Campbell | 452 | 120,868(0.37%)#59 | 280,778(0.16%)#98 |
| 60. | Dublin | 447 | 120,868(0.37%)#60 | 280,778(0.16%)#99 |
| 61. | Foster City | 445 | 120,868(0.37%)#61 | 280,778(0.16%)#100 |
| 62. | Danville | 432 | 120,868(0.36%)#62 | 280,778(0.15%)#101 |
| 63. | Orange | 430 | 120,868(0.36%)#63 | 280,778(0.15%)#102 |
| 64. | Palos Verdes Estates | 426 | 120,868(0.35%)#64 | 280,778(0.15%)#104 |
| 65. | Ontario | 393 | 120,868(0.33%)#65 | 280,778(0.14%)#110 |
| 66. | Albany | 381 | 120,868(0.32%)#66 | 280,778(0.14%)#114 |
| 67. | Manhattan Beach | 377 | 120,868(0.31%)#67 | 280,778(0.13%)#117 |
| 68. | Fountain Valley | 371 | 120,868(0.31%)#68 | 280,778(0.13%)#118 |
| 69. | Castro Valley | 359 | 120,868(0.30%)#69 | 280,778(0.13%)#122 |
| 70. | South Pasadena | 341 | 120,868(0.28%)#70 | 280,778(0.12%)#126 |
| 71. | Hayward | 338 | 120,868(0.28%)#71 | 280,778(0.12%)#128 |
| 72. | Glendale | 335 | 120,868(0.28%)#72 | 280,778(0.12%)#129 |
| 73. | Pomona | 332 | 120,868(0.27%)#73 | 280,778(0.12%)#132 |
| 74. | Mission Viejo | 332 | 120,868(0.27%)#74 | 280,778(0.12%)#133 |
| 75. | Placentia | 332 | 120,868(0.27%)#75 | 280,778(0.12%)#134 |
| 76. | Carlsbad | 330 | 120,868(0.27%)#76 | 280,778(0.12%)#135 |
| 77. | Santa Clarita | 329 | 120,868(0.27%)#77 | 280,778(0.12%)#137 |
| 78. | French Valley | 327 | 120,868(0.27%)#78 | 280,778(0.12%)#138 |
| 79. | Newark | 320 | 120,868(0.26%)#79 | 280,778(0.11%)#142 |
| 80. | Millbrae | 317 | 120,868(0.26%)#80 | 280,778(0.11%)#143 |
| 81. | Glendora | 315 | 120,868(0.26%)#81 | 280,778(0.11%)#144 |
| 82. | Alameda | 307 | 120,868(0.25%)#82 | 280,778(0.11%)#148 |
| 83. | Baldwin Park | 304 | 120,868(0.25%)#83 | 280,778(0.11%)#150 |
| 84. | Santa Rosa | 303 | 120,868(0.25%)#84 | 280,778(0.11%)#151 |
| 85. | Santa Ana | 298 | 120,868(0.25%)#85 | 280,778(0.11%)#152 |
| 86. | Costa Mesa | 295 | 120,868(0.24%)#86 | 280,778(0.11%)#154 |
| 87. | Stockton | 292 | 120,868(0.24%)#87 | 280,778(0.10%)#156 |
| 88. | Culver City | 290 | 120,868(0.24%)#88 | 280,778(0.10%)#157 |
| 89. | Laguna Niguel | 286 | 120,868(0.24%)#89 | 280,778(0.10%)#159 |
| 90. | El Monte | 284 | 120,868(0.23%)#90 | 280,778(0.10%)#160 |
| 91. | Laguna Woods | 268 | 120,868(0.22%)#91 | 280,778(0.10%)#168 |
| 92. | Aliso Viejo | 265 | 120,868(0.22%)#92 | 280,778(0.09%)#171 |
| 93. | Union City | 261 | 120,868(0.22%)#93 | 280,778(0.09%)#173 |
| 94. | Fontana | 252 | 120,868(0.21%)#94 | 280,778(0.09%)#177 |
| 95. | Richmond | 252 | 120,868(0.21%)#95 | 280,778(0.09%)#178 |
| 96. | Pleasant Hill | 252 | 120,868(0.21%)#96 | 280,778(0.09%)#179 |
| 97. | Santa Cruz | 249 | 120,868(0.21%)#97 | 280,778(0.09%)#181 |
| 98. | University Of California-Santa Barbara | 245 | 120,868(0.20%)#98 | 280,778(0.09%)#182 |
| 99. | Walnut Creek | 243 | 120,868(0.20%)#99 | 280,778(0.09%)#184 |
| 100. | Lake Elsinore | 237 | 120,868(0.20%)#100 | 280,778(0.08%)#187 |
Common Questions
What are the Top 10 Cities with the Largest Filipino Community in California?
Top 10 Cities with the Largest Filipino Community in California are:
#1
7,926
#2
7,790
#3
7,096
#4
4,722
#5
4,660
#6
4,063
#7
3,007
#8
2,168
#9
2,007
#10
1,927
What city has the Largest Filipino Community in California?
Los Angeles has the Largest Filipino Community in California with 7,926.
What is the Total Filipino Population in the State of California?
Total Filipino Population in California is 120,868.
What is the Total Filipino Population in the United States?
Total Filipino Population in the United States is 280,778.