Cities with the Highest Percentage of Immigrants from Latin America in California
RELATED REPORTS & OPTIONS
Latin America
California
Compare Cities
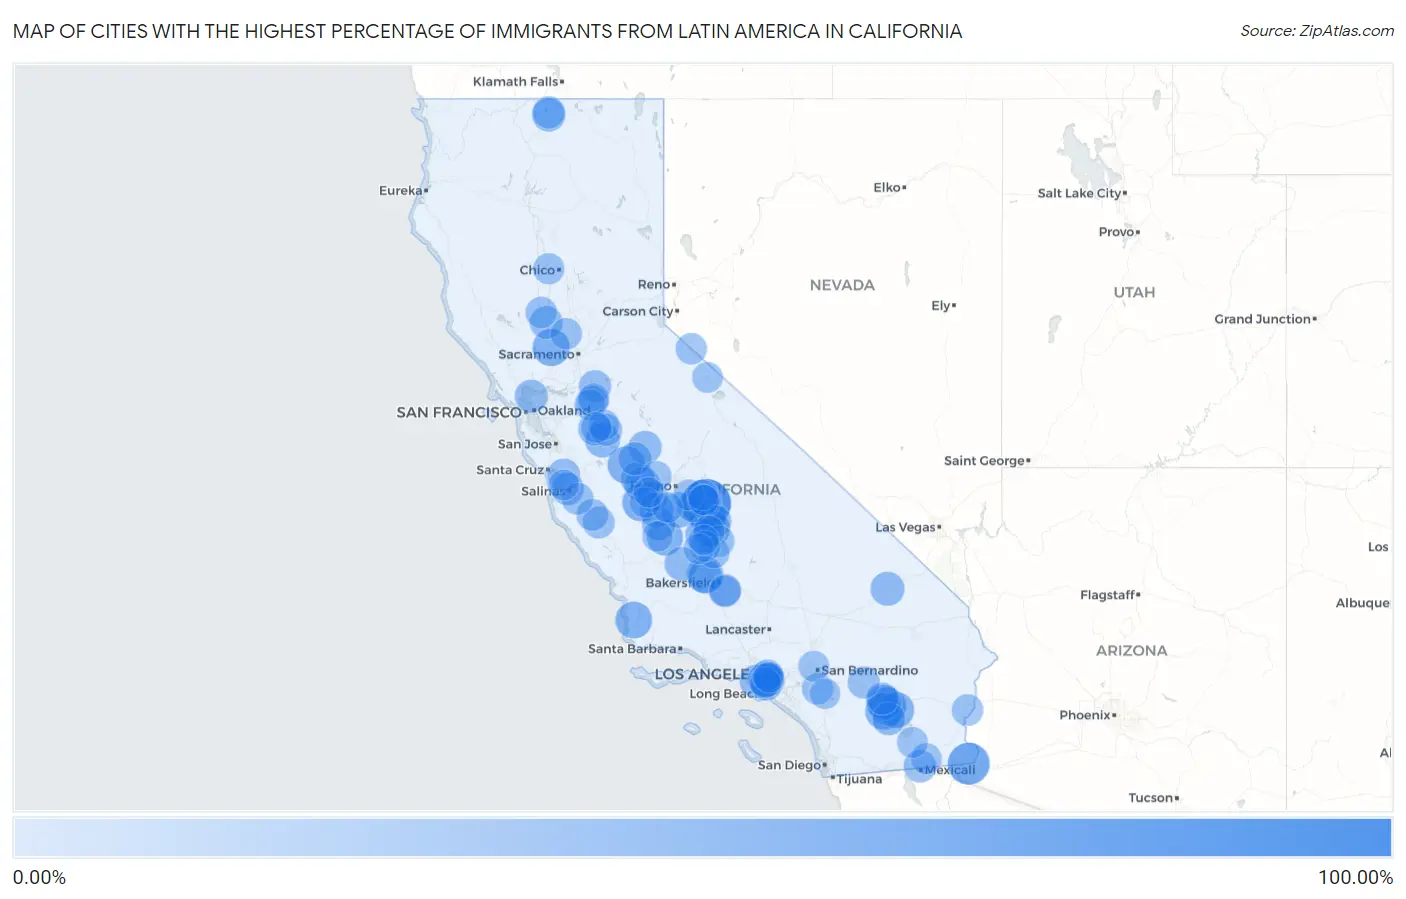
Map of Cities with the Highest Percentage of Immigrants from Latin America in California
0.00%
100.00%
Cities with the Highest Percentage of Immigrants from Latin America in California
| City | Latin America | vs State | vs National | |
| 1. | Yettem | 100.00% | 13.05%(+86.9)#-1 | 6.84%(+93.2)#0 |
| 2. | Jovista | 100.00% | 13.05%(+86.9)#0 | 6.84%(+93.2)#1 |
| 3. | Winterhaven | 73.58% | 13.05%(+60.5)#1 | 6.84%(+66.7)#2 |
| 4. | Woodville Farm Labor Camp | 60.71% | 13.05%(+47.7)#2 | 6.84%(+53.9)#3 |
| 5. | Three Rocks | 59.67% | 13.05%(+46.6)#3 | 6.84%(+52.8)#4 |
| 6. | Mecca | 58.83% | 13.05%(+45.8)#4 | 6.84%(+52.0)#5 |
| 7. | Dos Palos Y | 58.38% | 13.05%(+45.3)#5 | 6.84%(+51.5)#6 |
| 8. | Linnell Camp | 58.34% | 13.05%(+45.3)#6 | 6.84%(+51.5)#7 |
| 9. | Madison | 57.58% | 13.05%(+44.5)#7 | 6.84%(+50.7)#8 |
| 10. | Smith Corner | 56.96% | 13.05%(+43.9)#8 | 6.84%(+50.1)#9 |
| 11. | Oasis | 56.45% | 13.05%(+43.4)#9 | 6.84%(+49.6)#10 |
| 12. | Casmalia | 56.25% | 13.05%(+43.2)#10 | 6.84%(+49.4)#11 |
| 13. | Kettleman City | 54.29% | 13.05%(+41.2)#11 | 6.84%(+47.4)#12 |
| 14. | North Shore | 53.49% | 13.05%(+40.4)#12 | 6.84%(+46.6)#13 |
| 15. | Mendota | 51.93% | 13.05%(+38.9)#13 | 6.84%(+45.1)#14 |
| 16. | Hardwick | 51.88% | 13.05%(+38.8)#14 | 6.84%(+45.0)#15 |
| 17. | Plainview | 51.59% | 13.05%(+38.5)#15 | 6.84%(+44.7)#16 |
| 18. | Westside | 50.79% | 13.05%(+37.7)#16 | 6.84%(+43.9)#17 |
| 19. | Thermal | 50.67% | 13.05%(+37.6)#17 | 6.84%(+43.8)#18 |
| 20. | Crows Landing | 50.00% | 13.05%(+36.9)#18 | 6.84%(+43.2)#19 |
| 21. | Pumpkin Center | 49.22% | 13.05%(+36.2)#19 | 6.84%(+42.4)#20 |
| 22. | Tipton | 48.20% | 13.05%(+35.1)#20 | 6.84%(+41.4)#21 |
| 23. | Maywood | 47.77% | 13.05%(+34.7)#21 | 6.84%(+40.9)#22 |
| 24. | San Miguel Cdp San Luis Obispo County | 46.81% | 13.05%(+33.8)#22 | 6.84%(+40.0)#23 |
| 25. | Baker | 46.65% | 13.05%(+33.6)#23 | 6.84%(+39.8)#24 |
| 26. | Firebaugh | 46.37% | 13.05%(+33.3)#24 | 6.84%(+39.5)#25 |
| 27. | Huron | 45.78% | 13.05%(+32.7)#25 | 6.84%(+38.9)#26 |
| 28. | Lost Hills | 45.67% | 13.05%(+32.6)#26 | 6.84%(+38.8)#27 |
| 29. | Cherokee Strip | 45.66% | 13.05%(+32.6)#27 | 6.84%(+38.8)#28 |
| 30. | Edison | 45.51% | 13.05%(+32.5)#28 | 6.84%(+38.7)#29 |
| 31. | Huntington Park | 45.29% | 13.05%(+32.2)#431 | 6.84%(+38.5)#2,431 |
| 32. | Westley | 45.18% | 13.05%(+32.1)#432 | 6.84%(+38.3)#2,432 |
| 33. | Planada | 44.71% | 13.05%(+31.7)#433 | 6.84%(+37.9)#2,433 |
| 34. | East Orosi | 44.55% | 13.05%(+31.5)#434 | 6.84%(+37.7)#2,434 |
| 35. | Walnut Park | 44.52% | 13.05%(+31.5)#435 | 6.84%(+37.7)#2,435 |
| 36. | El Nido | 44.44% | 13.05%(+31.4)#436 | 6.84%(+37.6)#2,436 |
| 37. | Mount Hebron | 44.25% | 13.05%(+31.2)#437 | 6.84%(+37.4)#2,437 |
| 38. | Lennox | 44.22% | 13.05%(+31.2)#438 | 6.84%(+37.4)#2,438 |
| 39. | Hypericum | 43.96% | 13.05%(+30.9)#439 | 6.84%(+37.1)#2,439 |
| 40. | Montalvin Manor | 43.92% | 13.05%(+30.9)#440 | 6.84%(+37.1)#2,440 |
| 41. | Cutler | 43.78% | 13.05%(+30.7)#441 | 6.84%(+36.9)#2,441 |
| 42. | Desert Shores | 43.61% | 13.05%(+30.6)#442 | 6.84%(+36.8)#2,442 |
| 43. | Arbuckle | 43.55% | 13.05%(+30.5)#443 | 6.84%(+36.7)#2,443 |
| 44. | Cudahy | 42.96% | 13.05%(+29.9)#495 | 6.84%(+36.1)#3,029 |
| 45. | Pajaro | 42.78% | 13.05%(+29.7)#496 | 6.84%(+35.9)#3,030 |
| 46. | Boronda | 42.71% | 13.05%(+29.7)#497 | 6.84%(+35.9)#3,031 |
| 47. | Calexico | 42.62% | 13.05%(+29.6)#498 | 6.84%(+35.8)#3,032 |
| 48. | Tonyville | 42.04% | 13.05%(+29.0)#499 | 6.84%(+35.2)#3,033 |
| 49. | Victor | 41.28% | 13.05%(+28.2)#500 | 6.84%(+34.4)#3,034 |
| 50. | Macdoel | 41.26% | 13.05%(+28.2)#501 | 6.84%(+34.4)#3,035 |
| 51. | Florence Graham | 40.91% | 13.05%(+27.9)#502 | 6.84%(+34.1)#3,036 |
| 52. | Coachella | 40.78% | 13.05%(+27.7)#503 | 6.84%(+33.9)#3,037 |
| 53. | Bell Gardens | 40.75% | 13.05%(+27.7)#504 | 6.84%(+33.9)#3,038 |
| 54. | Garnet | 40.69% | 13.05%(+27.6)#505 | 6.84%(+33.9)#3,039 |
| 55. | South Gate | 40.65% | 13.05%(+27.6)#506 | 6.84%(+33.8)#3,040 |
| 56. | Lamont | 40.34% | 13.05%(+27.3)#507 | 6.84%(+33.5)#3,041 |
| 57. | King City | 40.07% | 13.05%(+27.0)#508 | 6.84%(+33.2)#3,042 |
| 58. | Greenfield | 40.00% | 13.05%(+26.9)#509 | 6.84%(+33.2)#3,043 |
| 59. | Monterey Park Tract | 39.86% | 13.05%(+26.8)#510 | 6.84%(+33.0)#3,044 |
| 60. | Chualar | 39.73% | 13.05%(+26.7)#511 | 6.84%(+32.9)#3,045 |
| 61. | Old River | 39.62% | 13.05%(+26.6)#512 | 6.84%(+32.8)#3,046 |
| 62. | Traver | 39.58% | 13.05%(+26.5)#513 | 6.84%(+32.7)#3,047 |
| 63. | Weedpatch | 39.45% | 13.05%(+26.4)#514 | 6.84%(+32.6)#3,048 |
| 64. | Bell | 39.07% | 13.05%(+26.0)#515 | 6.84%(+32.2)#3,049 |
| 65. | Terra Bella | 39.04% | 13.05%(+26.0)#516 | 6.84%(+32.2)#3,050 |
| 66. | Ripley | 38.93% | 13.05%(+25.9)#517 | 6.84%(+32.1)#3,051 |
| 67. | Richgrove | 38.76% | 13.05%(+25.7)#518 | 6.84%(+31.9)#3,052 |
| 68. | Robbins | 38.71% | 13.05%(+25.7)#519 | 6.84%(+31.9)#3,053 |
| 69. | San Joaquin | 38.55% | 13.05%(+25.5)#520 | 6.84%(+31.7)#3,054 |
| 70. | Williams | 38.54% | 13.05%(+25.5)#521 | 6.84%(+31.7)#3,055 |
| 71. | Kennedy | 38.39% | 13.05%(+25.3)#522 | 6.84%(+31.6)#3,056 |
| 72. | Woodville | 38.31% | 13.05%(+25.3)#523 | 6.84%(+31.5)#3,057 |
| 73. | Topaz | 38.27% | 13.05%(+25.2)#524 | 6.84%(+31.4)#3,058 |
| 74. | Mead Valley | 38.21% | 13.05%(+25.2)#525 | 6.84%(+31.4)#3,059 |
| 75. | East Rancho Dominguez | 38.05% | 13.05%(+25.0)#526 | 6.84%(+31.2)#3,060 |
| 76. | Earlimart | 37.71% | 13.05%(+24.7)#527 | 6.84%(+30.9)#3,061 |
| 77. | East Los Angeles | 37.68% | 13.05%(+24.6)#528 | 6.84%(+30.8)#3,191 |
| 78. | Hamilton City | 37.52% | 13.05%(+24.5)#529 | 6.84%(+30.7)#3,192 |
| 79. | French Camp | 37.36% | 13.05%(+24.3)#530 | 6.84%(+30.5)#3,193 |
| 80. | Riverdale Park | 37.11% | 13.05%(+24.1)#531 | 6.84%(+30.3)#3,194 |
| 81. | Garden Acres | 37.09% | 13.05%(+24.0)#532 | 6.84%(+30.2)#3,195 |
| 82. | Lynwood | 36.89% | 13.05%(+23.8)#533 | 6.84%(+30.0)#3,196 |
| 83. | Parlier | 36.84% | 13.05%(+23.8)#534 | 6.84%(+30.0)#3,197 |
| 84. | Holtville | 36.69% | 13.05%(+23.6)#535 | 6.84%(+29.8)#3,198 |
| 85. | Westmorland | 36.62% | 13.05%(+23.6)#536 | 6.84%(+29.8)#3,199 |
| 86. | Muscoy | 36.49% | 13.05%(+23.4)#537 | 6.84%(+29.6)#3,200 |
| 87. | Castroville | 36.22% | 13.05%(+23.2)#538 | 6.84%(+29.4)#3,201 |
| 88. | Orange Cove | 36.06% | 13.05%(+23.0)#539 | 6.84%(+29.2)#3,202 |
| 89. | Grayson | 36.03% | 13.05%(+23.0)#540 | 6.84%(+29.2)#3,203 |
| 90. | Bridgeport | 36.03% | 13.05%(+23.0)#541 | 6.84%(+29.2)#3,204 |
| 91. | La Vina | 35.75% | 13.05%(+22.7)#542 | 6.84%(+28.9)#3,205 |
| 92. | Commerce | 35.66% | 13.05%(+22.6)#543 | 6.84%(+28.8)#3,206 |
| 93. | Cantua Creek | 35.63% | 13.05%(+22.6)#544 | 6.84%(+28.8)#3,207 |
| 94. | Lanare | 35.61% | 13.05%(+22.6)#545 | 6.84%(+28.8)#3,208 |
| 95. | Orosi | 35.60% | 13.05%(+22.5)#546 | 6.84%(+28.8)#3,209 |
| 96. | Avenal | 35.60% | 13.05%(+22.5)#547 | 6.84%(+28.8)#3,210 |
| 97. | Allensworth | 35.51% | 13.05%(+22.5)#548 | 6.84%(+28.7)#3,211 |
| 98. | Romoland | 35.39% | 13.05%(+22.3)#549 | 6.84%(+28.6)#3,212 |
| 99. | Pixley | 35.32% | 13.05%(+22.3)#550 | 6.84%(+28.5)#3,213 |
| 100. | Tranquillity | 35.11% | 13.05%(+22.1)#551 | 6.84%(+28.3)#3,214 |
Common Questions
What are the Top 10 Cities with the Highest Percentage of Immigrants from Latin America in California?
Top 10 Cities with the Highest Percentage of Immigrants from Latin America in California are:
#1
100.00%
#2
73.58%
#3
59.67%
#4
58.83%
#5
58.38%
#6
58.34%
#7
57.58%
#8
56.96%
#9
56.45%
#10
56.25%
What city has the Highest Percentage of Immigrants from Latin America in California?
Yettem has the Highest Percentage of Immigrants from Latin America in California with 100.00%.
What is the Percentage of Immigrants from Latin America in the State of California?
Percentage of Immigrants from Latin America in California is 13.05%.
What is the Percentage of Immigrants from Latin America in the United States?
Percentage of Immigrants from Latin America in the United States is 6.84%.