Bear Valley CDP Alpine County, CA Map & Demographics
Bear Valley CDP Alpine County Overview
$74,208
PER CAPITA INCOME
0.37
INEQUALITY / GINI INDEX
72
TOTAL POPULATION
48
MALE POPULATION
24
FEMALE POPULATION
200.00
MALES / 100 FEMALES
50.00
FEMALES / 100 MALES
53.7
MEDIAN AGE
4.1
AVG FAMILY SIZE
1.6
AVG HOUSEHOLD SIZE
59
LABOR FORCE [ PEOPLE ]
89.4%
PERCENT IN LABOR FORCE
22.0%
UNEMPLOYMENT RATE
Income in Bear Valley CDP Alpine County
Income Overview in Bear Valley CDP Alpine County
| Characteristic | Number | Measure |
| Per Capita Income | 72 | $74,208 |
| Median Family Income | 9 | $0 |
| Mean Family Income | 9 | $0 |
| Median Household Income | 44 | $0 |
| Mean Household Income | 44 | $112,448 |
| Income Deficit | 9 | $0 |
| Wage / Income Gap (%) | 72 | 0.00% |
| Wage / Income Gap ($) | 72 | 100.00¢ per $1 |
| Gini / Inequality Index | 72 | 0.37 |
Earnings by Sex in Bear Valley CDP Alpine County
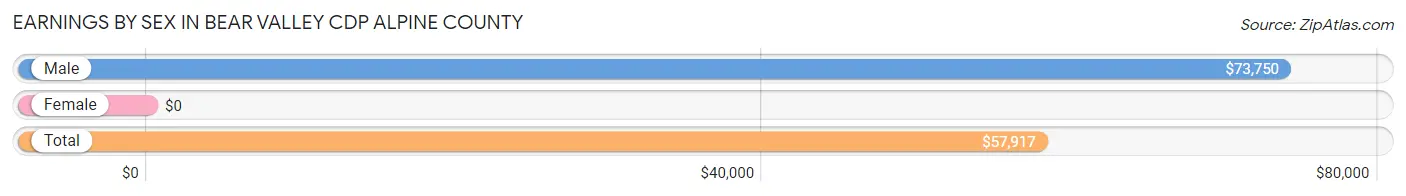
| Sex | Number | Average Earnings |
| Male | 44 (74.6%) | $73,750 |
| Female | 15 (25.4%) | $0 |
| Total | 59 (100.0%) | $57,917 |
Earnings by Sex by Income Bracket in Bear Valley CDP Alpine County
The most common earnings brackets in Bear Valley CDP Alpine County are $10,000 to $12,499 for men (13 | 29.5%) and $7,500 to $9,999 for women (9 | 60.0%).
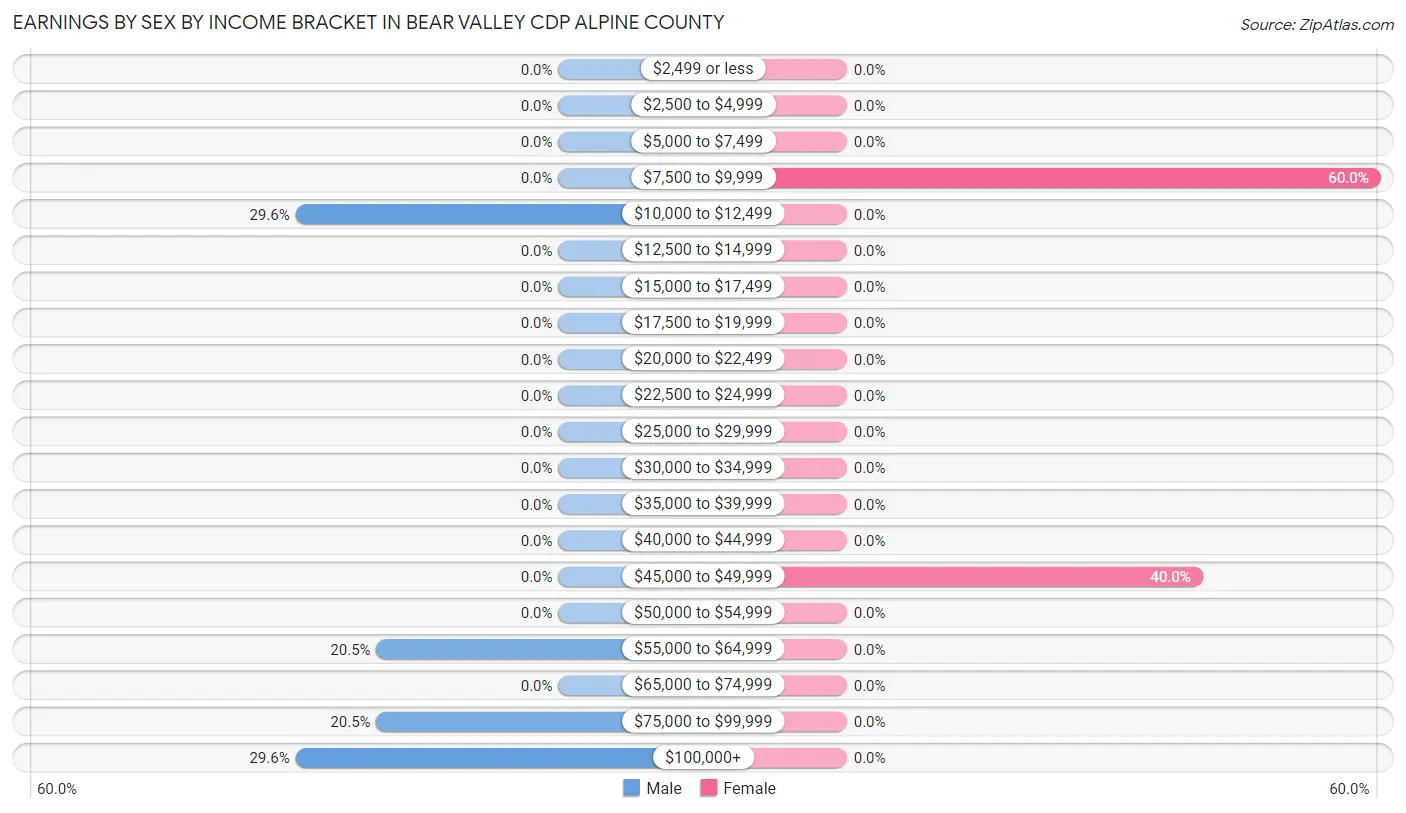
| Income | Male | Female |
| $2,499 or less | 0 (0.0%) | 0 (0.0%) |
| $2,500 to $4,999 | 0 (0.0%) | 0 (0.0%) |
| $5,000 to $7,499 | 0 (0.0%) | 0 (0.0%) |
| $7,500 to $9,999 | 0 (0.0%) | 9 (60.0%) |
| $10,000 to $12,499 | 13 (29.5%) | 0 (0.0%) |
| $12,500 to $14,999 | 0 (0.0%) | 0 (0.0%) |
| $15,000 to $17,499 | 0 (0.0%) | 0 (0.0%) |
| $17,500 to $19,999 | 0 (0.0%) | 0 (0.0%) |
| $20,000 to $22,499 | 0 (0.0%) | 0 (0.0%) |
| $22,500 to $24,999 | 0 (0.0%) | 0 (0.0%) |
| $25,000 to $29,999 | 0 (0.0%) | 0 (0.0%) |
| $30,000 to $34,999 | 0 (0.0%) | 0 (0.0%) |
| $35,000 to $39,999 | 0 (0.0%) | 0 (0.0%) |
| $40,000 to $44,999 | 0 (0.0%) | 0 (0.0%) |
| $45,000 to $49,999 | 0 (0.0%) | 6 (40.0%) |
| $50,000 to $54,999 | 0 (0.0%) | 0 (0.0%) |
| $55,000 to $64,999 | 9 (20.4%) | 0 (0.0%) |
| $65,000 to $74,999 | 0 (0.0%) | 0 (0.0%) |
| $75,000 to $99,999 | 9 (20.4%) | 0 (0.0%) |
| $100,000+ | 13 (29.5%) | 0 (0.0%) |
| Total | 44 (100.0%) | 15 (100.0%) |
Earnings by Sex by Educational Attainment in Bear Valley CDP Alpine County
| Educational Attainment | Male Income | Female Income |
| Less than High School | - | - |
| High School Diploma | - | - |
| College or Associate's Degree | - | - |
| Bachelor's Degree | - | - |
| Graduate Degree | - | - |
| Total | $73,750 | $0 |
Family Income in Bear Valley CDP Alpine County
Family Income Brackets in Bear Valley CDP Alpine County
According to the Bear Valley CDP Alpine County family income data, there are 9 families falling into the $100,000 to $149,999 income range, which is the most common income bracket and makes up 100.0% of all families.
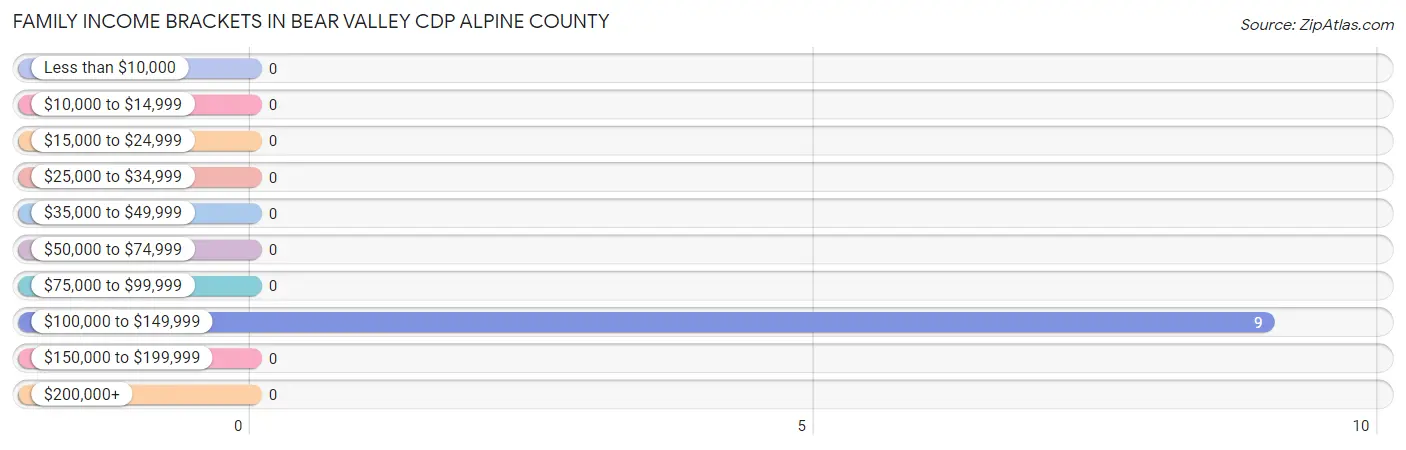
| Income Bracket | # Families | % Families |
| Less than $10,000 | 0 | 0.0% |
| $10,000 to $14,999 | 0 | 0.0% |
| $15,000 to $24,999 | 0 | 0.0% |
| $25,000 to $34,999 | 0 | 0.0% |
| $35,000 to $49,999 | 0 | 0.0% |
| $50,000 to $74,999 | 0 | 0.0% |
| $75,000 to $99,999 | 0 | 0.0% |
| $100,000 to $149,999 | 9 | 100.0% |
| $150,000 to $199,999 | 0 | 0.0% |
| $200,000+ | 0 | 0.0% |
Family Income by Famaliy Size in Bear Valley CDP Alpine County
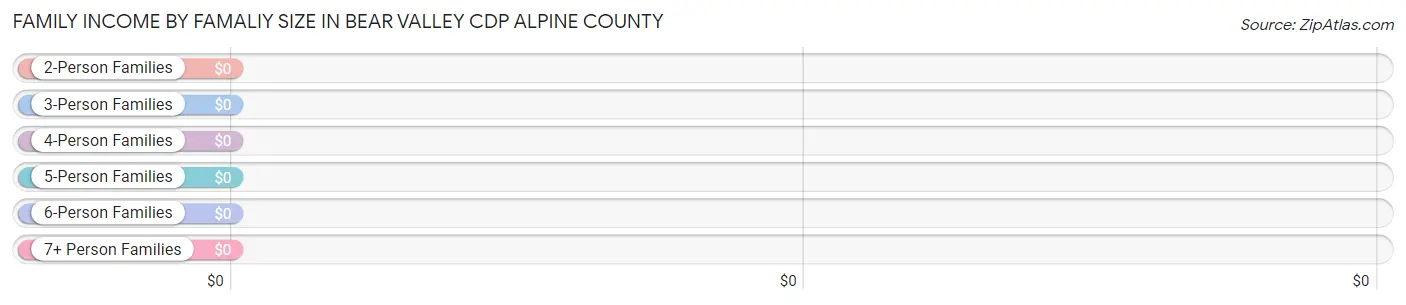
| Income Bracket | # Families | Median Income |
| 2-Person Families | 3 (33.3%) | $0 |
| 3-Person Families | 0 (0.0%) | $0 |
| 4-Person Families | 6 (66.7%) | $0 |
| 5-Person Families | 0 (0.0%) | $0 |
| 6-Person Families | 0 (0.0%) | $0 |
| 7+ Person Families | 0 (0.0%) | $0 |
| Total | 9 (100.0%) | $0 |
Family Income by Number of Earners in Bear Valley CDP Alpine County
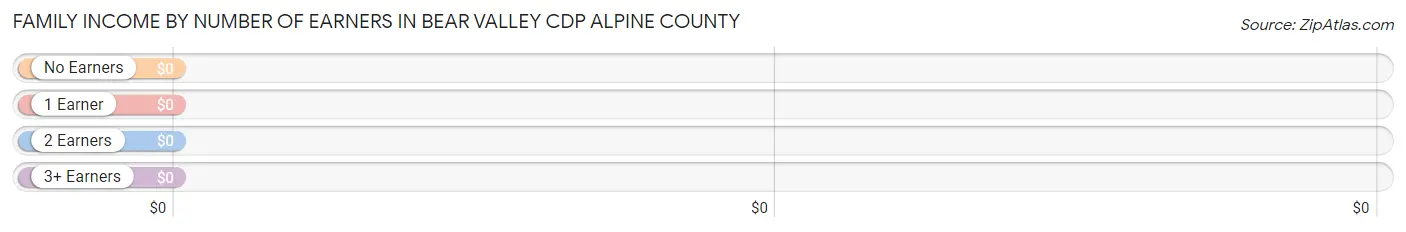
| Number of Earners | # Families | Median Income |
| No Earners | 3 (33.3%) | $0 |
| 1 Earner | 0 (0.0%) | $0 |
| 2 Earners | 0 (0.0%) | $0 |
| 3+ Earners | 6 (66.7%) | $0 |
| Total | 9 (100.0%) | $0 |
Household Income in Bear Valley CDP Alpine County
Household Income Brackets in Bear Valley CDP Alpine County
With 13 households falling in the category, the $25,000 to $34,999 income range is the most frequent in Bear Valley CDP Alpine County, accounting for 29.5% of all households.
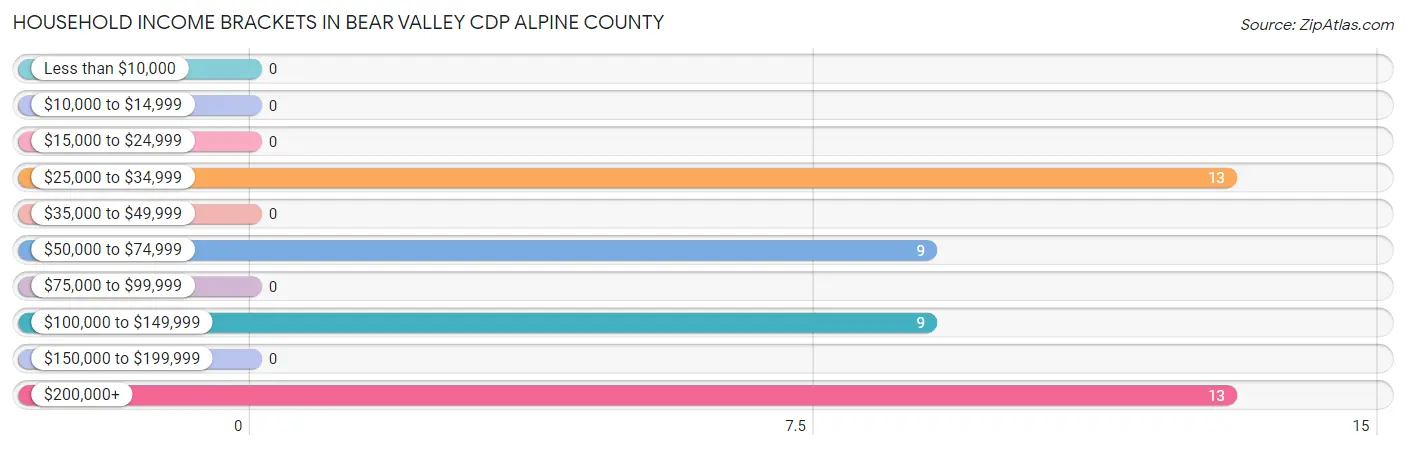
| Income Bracket | # Households | % Households |
| Less than $10,000 | 0 | 0.0% |
| $10,000 to $14,999 | 0 | 0.0% |
| $15,000 to $24,999 | 0 | 0.0% |
| $25,000 to $34,999 | 13 | 29.5% |
| $35,000 to $49,999 | 0 | 0.0% |
| $50,000 to $74,999 | 9 | 20.5% |
| $75,000 to $99,999 | 0 | 0.0% |
| $100,000 to $149,999 | 9 | 20.5% |
| $150,000 to $199,999 | 0 | 0.0% |
| $200,000+ | 13 | 29.5% |
Household Income by Householder Age in Bear Valley CDP Alpine County
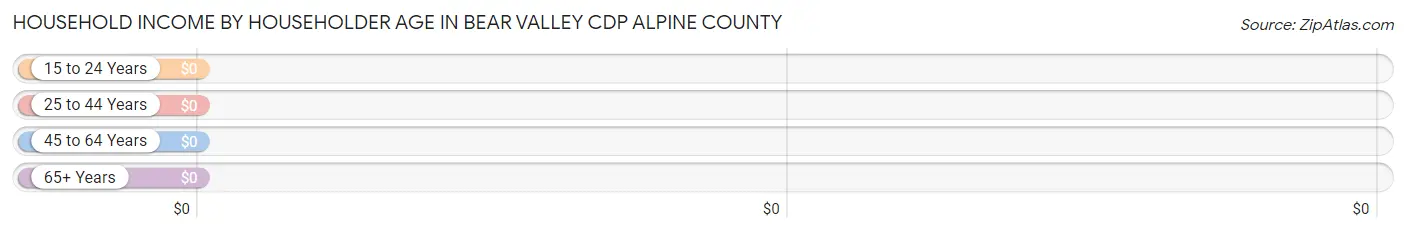
| Income Bracket | # Households | Median Income |
| 15 to 24 Years | 0 (0.0%) | $0 |
| 25 to 44 Years | 9 (20.4%) | $0 |
| 45 to 64 Years | 19 (43.2%) | $0 |
| 65+ Years | 16 (36.4%) | $0 |
| Total | 44 (100.0%) | $0 |
Poverty in Bear Valley CDP Alpine County
Income Below Poverty by Sex and Age in Bear Valley CDP Alpine County
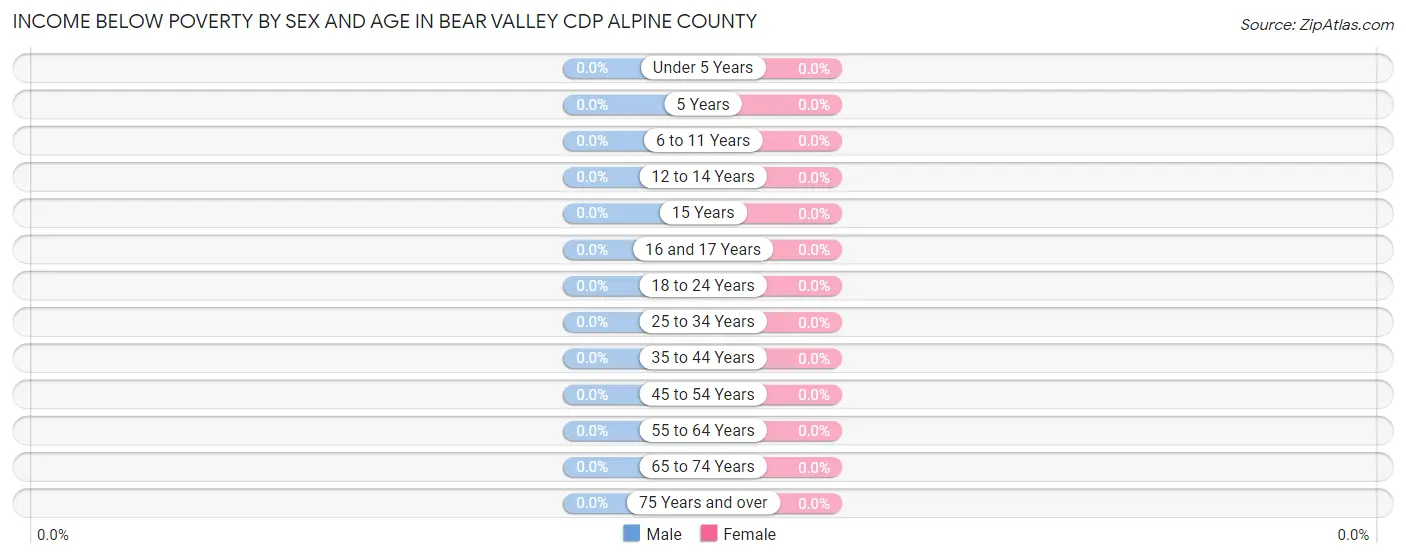
| Age Bracket | Male | Female |
| Under 5 Years | 0 (0.0%) | 0 (0.0%) |
| 5 Years | 0 (0.0%) | 0 (0.0%) |
| 6 to 11 Years | 0 (0.0%) | 0 (0.0%) |
| 12 to 14 Years | 0 (0.0%) | 0 (0.0%) |
| 15 Years | 0 (0.0%) | 0 (0.0%) |
| 16 and 17 Years | 0 (0.0%) | 0 (0.0%) |
| 18 to 24 Years | 0 (0.0%) | 0 (0.0%) |
| 25 to 34 Years | 0 (0.0%) | 0 (0.0%) |
| 35 to 44 Years | 0 (0.0%) | 0 (0.0%) |
| 45 to 54 Years | 0 (0.0%) | 0 (0.0%) |
| 55 to 64 Years | 0 (0.0%) | 0 (0.0%) |
| 65 to 74 Years | 0 (0.0%) | 0 (0.0%) |
| 75 Years and over | 0 (0.0%) | 0 (0.0%) |
| Total | 0 (0.0%) | 0 (0.0%) |
Income Above Poverty by Sex and Age in Bear Valley CDP Alpine County
According to the poverty statistics in Bear Valley CDP Alpine County, males aged 35 to 44 years and females aged 12 to 14 years are the age groups that are most secure financially, with 100.0% of males and 100.0% of females in these age groups living above the poverty line.
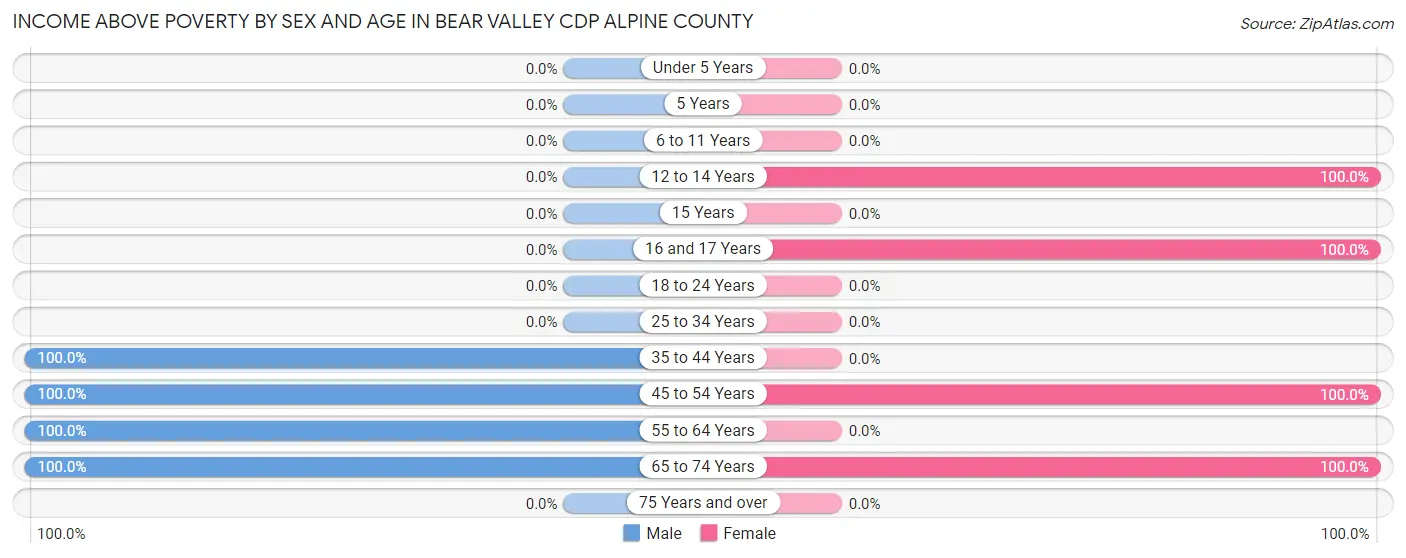
| Age Bracket | Male | Female |
| Under 5 Years | 0 (0.0%) | 0 (0.0%) |
| 5 Years | 0 (0.0%) | 0 (0.0%) |
| 6 to 11 Years | 0 (0.0%) | 0 (0.0%) |
| 12 to 14 Years | 0 (0.0%) | 6 (100.0%) |
| 15 Years | 0 (0.0%) | 0 (0.0%) |
| 16 and 17 Years | 0 (0.0%) | 9 (100.0%) |
| 18 to 24 Years | 0 (0.0%) | 0 (0.0%) |
| 25 to 34 Years | 0 (0.0%) | 0 (0.0%) |
| 35 to 44 Years | 9 (100.0%) | 0 (0.0%) |
| 45 to 54 Years | 9 (100.0%) | 6 (100.0%) |
| 55 to 64 Years | 13 (100.0%) | 0 (0.0%) |
| 65 to 74 Years | 17 (100.0%) | 3 (100.0%) |
| 75 Years and over | 0 (0.0%) | 0 (0.0%) |
| Total | 48 (100.0%) | 24 (100.0%) |
Income Below Poverty Among Married-Couple Families in Bear Valley CDP Alpine County
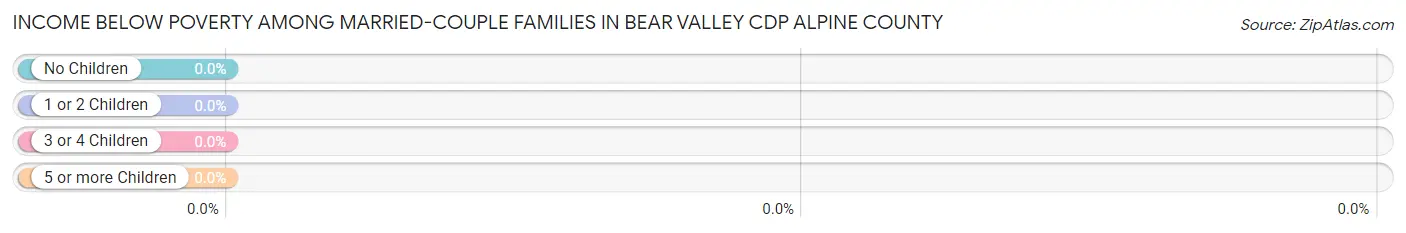
| Children | Above Poverty | Below Poverty |
| No Children | 3 (100.0%) | 0 (0.0%) |
| 1 or 2 Children | 6 (100.0%) | 0 (0.0%) |
| 3 or 4 Children | 0 (0.0%) | 0 (0.0%) |
| 5 or more Children | 0 (0.0%) | 0 (0.0%) |
| Total | 9 (100.0%) | 0 (0.0%) |
Income Below Poverty Among Single-Parent Households in Bear Valley CDP Alpine County
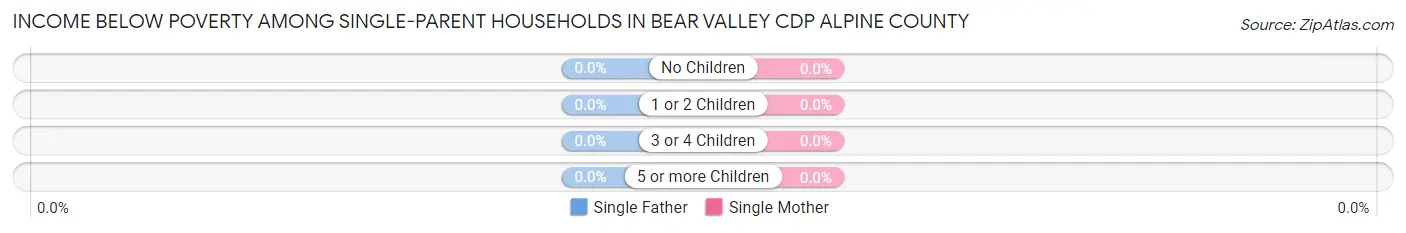
| Children | Single Father | Single Mother |
| No Children | 0 (0.0%) | 0 (0.0%) |
| 1 or 2 Children | 0 (0.0%) | 0 (0.0%) |
| 3 or 4 Children | 0 (0.0%) | 0 (0.0%) |
| 5 or more Children | 0 (0.0%) | 0 (0.0%) |
| Total | 0 (0.0%) | 0 (0.0%) |
Income Below Poverty Among Married-Couple vs Single-Parent Households in Bear Valley CDP Alpine County
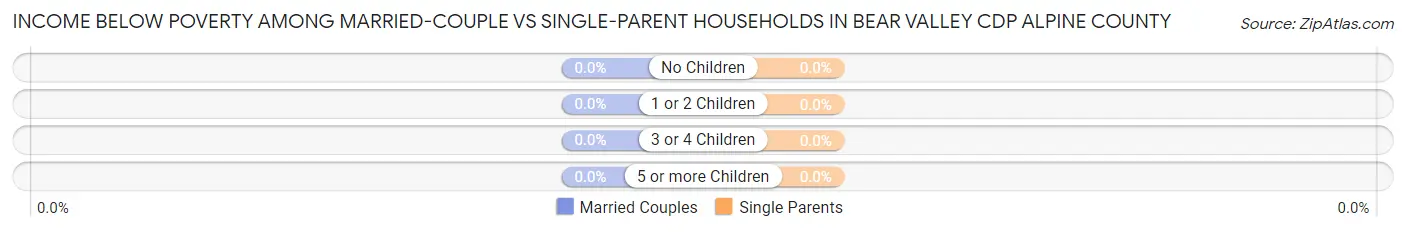
| Children | Married-Couple Families | Single-Parent Households |
| No Children | 0 (0.0%) | 0 (0.0%) |
| 1 or 2 Children | 0 (0.0%) | 0 (0.0%) |
| 3 or 4 Children | 0 (0.0%) | 0 (0.0%) |
| 5 or more Children | 0 (0.0%) | 0 (0.0%) |
| Total | 0 (0.0%) | 0 (0.0%) |
Race in Bear Valley CDP Alpine County
The most populous races in Bear Valley CDP Alpine County are , and White / Caucasian (72 | 100.0%).
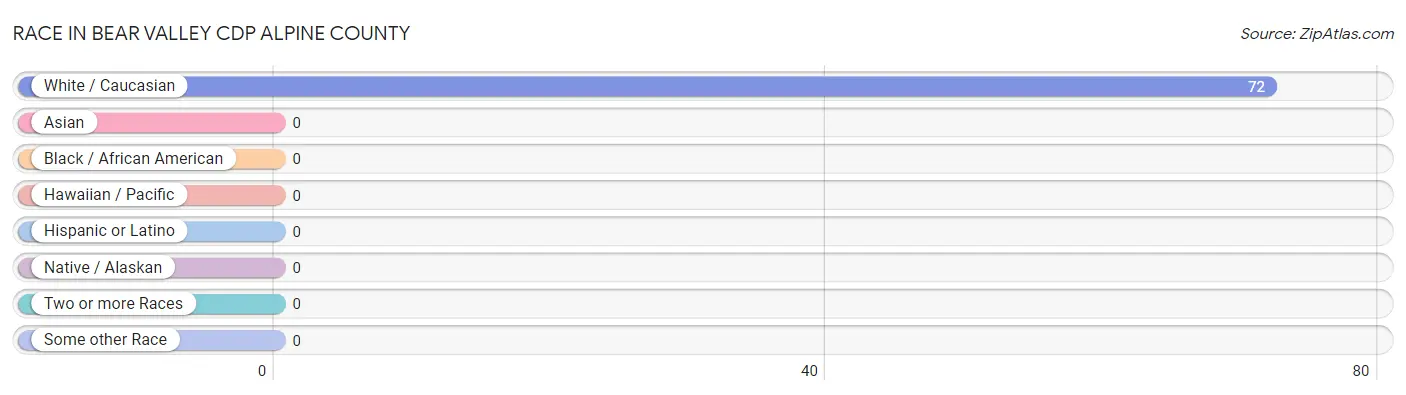
| Race | # Population | % Population |
| Asian | 0 | 0.0% |
| Black / African American | 0 | 0.0% |
| Hawaiian / Pacific | 0 | 0.0% |
| Hispanic or Latino | 0 | 0.0% |
| Native / Alaskan | 0 | 0.0% |
| White / Caucasian | 72 | 100.0% |
| Two or more Races | 0 | 0.0% |
| Some other Race | 0 | 0.0% |
| Total | 72 | 100.0% |
Ancestry in Bear Valley CDP Alpine County
The most populous ancestries reported in Bear Valley CDP Alpine County are German (28 | 38.9%), Irish (28 | 38.9%), American (15 | 20.8%), Dutch (13 | 18.1%), and Norwegian (13 | 18.1%), together accounting for 134.7% of all Bear Valley CDP Alpine County residents.
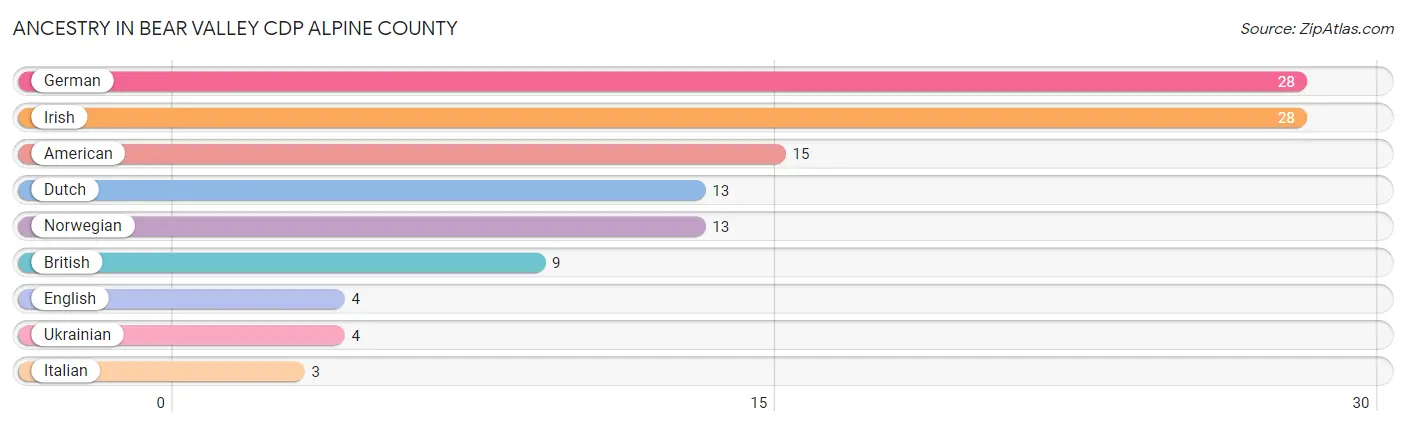
| Ancestry | # Population | % Population |
| American | 15 | 20.8% |
| British | 9 | 12.5% |
| Dutch | 13 | 18.1% |
| English | 4 | 5.6% |
| German | 28 | 38.9% |
| Irish | 28 | 38.9% |
| Italian | 3 | 4.2% |
| Norwegian | 13 | 18.1% |
| Ukrainian | 4 | 5.6% | View All 9 Rows |
Immigrants in Bear Valley CDP Alpine County

| Immigration Origin | # Population | % Population | View All 0 Rows |
Sex and Age in Bear Valley CDP Alpine County
Sex and Age in Bear Valley CDP Alpine County
The most populous age groups in Bear Valley CDP Alpine County are 70 to 74 Years (17 | 35.4%) for men and 15 to 19 Years (9 | 37.5%) for women.
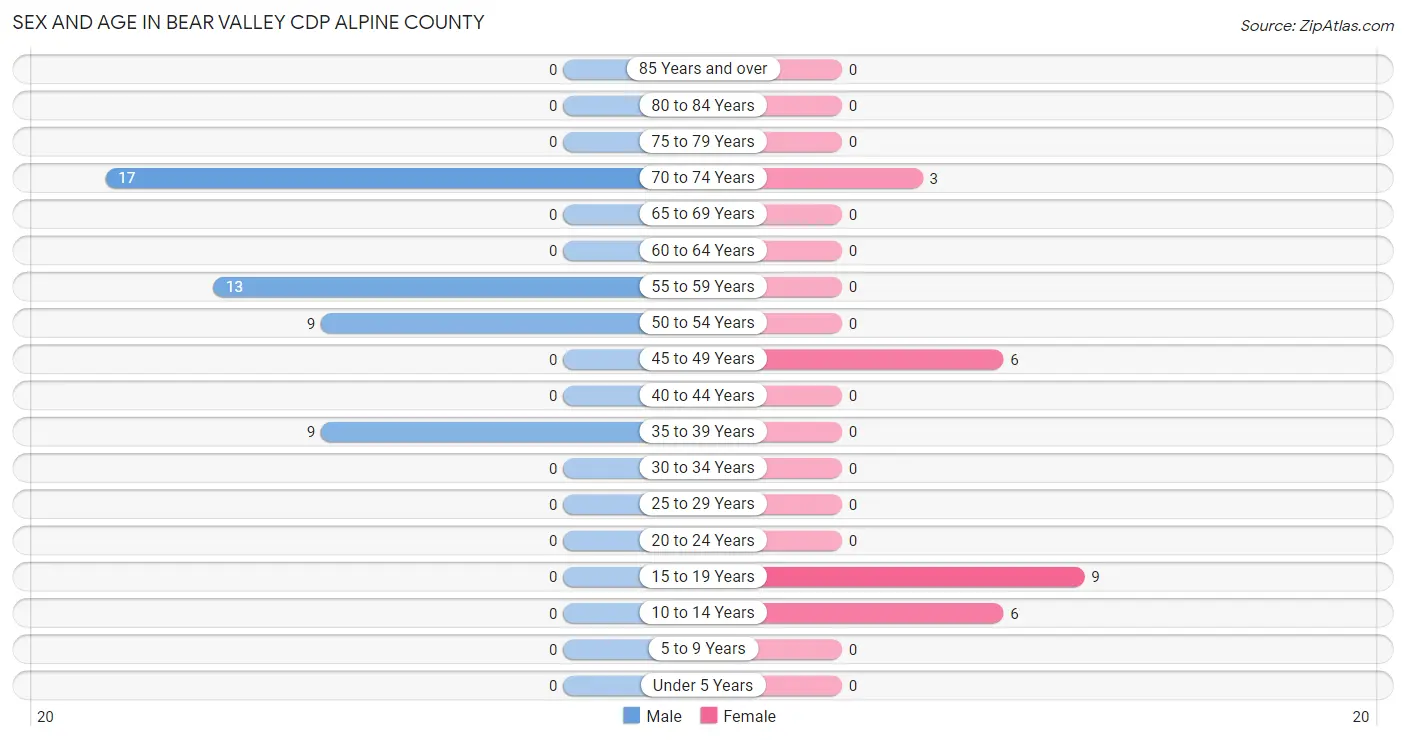
| Age Bracket | Male | Female |
| Under 5 Years | 0 (0.0%) | 0 (0.0%) |
| 5 to 9 Years | 0 (0.0%) | 0 (0.0%) |
| 10 to 14 Years | 0 (0.0%) | 6 (25.0%) |
| 15 to 19 Years | 0 (0.0%) | 9 (37.5%) |
| 20 to 24 Years | 0 (0.0%) | 0 (0.0%) |
| 25 to 29 Years | 0 (0.0%) | 0 (0.0%) |
| 30 to 34 Years | 0 (0.0%) | 0 (0.0%) |
| 35 to 39 Years | 9 (18.8%) | 0 (0.0%) |
| 40 to 44 Years | 0 (0.0%) | 0 (0.0%) |
| 45 to 49 Years | 0 (0.0%) | 6 (25.0%) |
| 50 to 54 Years | 9 (18.8%) | 0 (0.0%) |
| 55 to 59 Years | 13 (27.1%) | 0 (0.0%) |
| 60 to 64 Years | 0 (0.0%) | 0 (0.0%) |
| 65 to 69 Years | 0 (0.0%) | 0 (0.0%) |
| 70 to 74 Years | 17 (35.4%) | 3 (12.5%) |
| 75 to 79 Years | 0 (0.0%) | 0 (0.0%) |
| 80 to 84 Years | 0 (0.0%) | 0 (0.0%) |
| 85 Years and over | 0 (0.0%) | 0 (0.0%) |
| Total | 48 (100.0%) | 24 (100.0%) |
Families and Households in Bear Valley CDP Alpine County
Median Family Size in Bear Valley CDP Alpine County
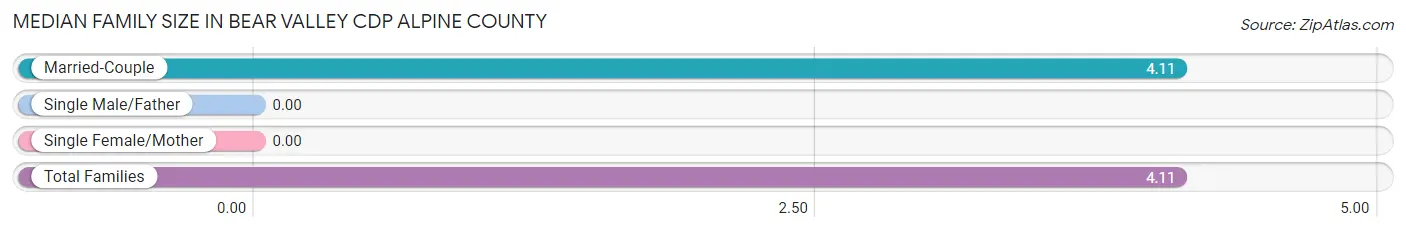
| Family Type | # Families | Family Size |
| Married-Couple | 9 (100.0%) | 4.11 |
| Single Male/Father | 0 (0.0%) | - |
| Single Female/Mother | 0 (0.0%) | - |
| Total Families | 9 (100.0%) | 4.11 |
Median Household Size in Bear Valley CDP Alpine County
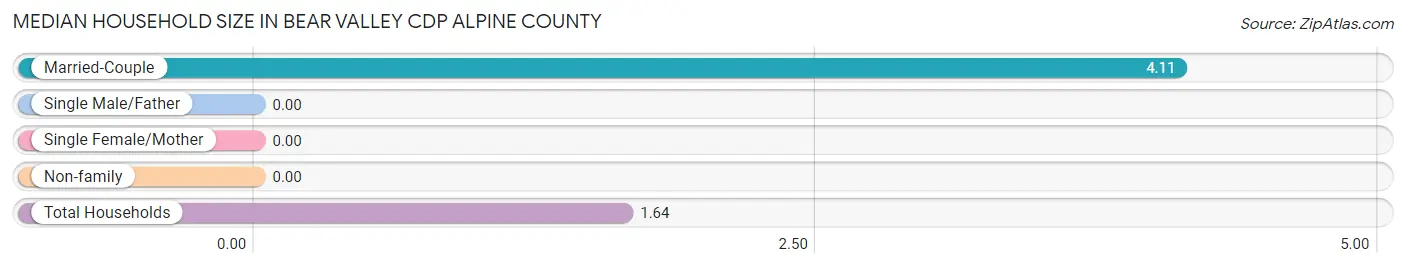
| Household Type | # Households | Household Size |
| Married-Couple | 9 (20.4%) | 4.11 |
| Single Male/Father | 0 (0.0%) | - |
| Single Female/Mother | 0 (0.0%) | - |
| Non-family | 35 (79.5%) | - |
| Total Households | 44 (100.0%) | 1.64 |
Household Size by Marriage Status in Bear Valley CDP Alpine County
Out of a total of 44 households in Bear Valley CDP Alpine County, 9 (20.4%) are family households, while 35 (79.5%) are nonfamily households. The most numerous type of family households are 4-person households, comprising 6, and the most common type of nonfamily households are 1-person households, comprising 35.
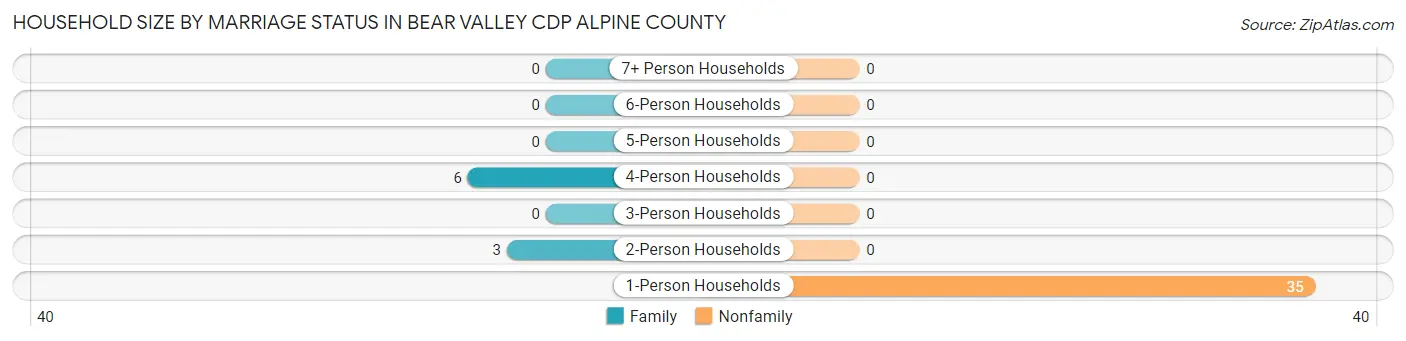
| Household Size | Family Households | Nonfamily Households |
| 1-Person Households | - | 35 (79.5%) |
| 2-Person Households | 3 (6.8%) | 0 (0.0%) |
| 3-Person Households | 0 (0.0%) | 0 (0.0%) |
| 4-Person Households | 6 (13.6%) | 0 (0.0%) |
| 5-Person Households | 0 (0.0%) | 0 (0.0%) |
| 6-Person Households | 0 (0.0%) | 0 (0.0%) |
| 7+ Person Households | 0 (0.0%) | 0 (0.0%) |
| Total | 9 (20.4%) | 35 (79.5%) |
Female Fertility in Bear Valley CDP Alpine County
Fertility by Age in Bear Valley CDP Alpine County
| Age Bracket | Women with Births | Births / 1,000 Women |
| 15 to 19 years | 0 (0.0%) | 0.0 |
| 20 to 34 years | 0 (0.0%) | 0.0 |
| 35 to 50 years | 0 (0.0%) | 0.0 |
| Total | 0 (0.0%) | 0.0 |
Fertility by Age by Marriage Status in Bear Valley CDP Alpine County
| Age Bracket | Married | Unmarried |
| 15 to 19 years | 0 (0.0%) | 0 (0.0%) |
| 20 to 34 years | 0 (0.0%) | 0 (0.0%) |
| 35 to 50 years | 0 (0.0%) | 0 (0.0%) |
| Total | 0 (0.0%) | 0 (0.0%) |
Fertility by Education in Bear Valley CDP Alpine County
| Educational Attainment | Women with Births | Births / 1,000 Women |
| Less than High School | 0 (0.0%) | 0.0 |
| High School Diploma | 0 (0.0%) | 0.0 |
| College or Associate's Degree | 0 (0.0%) | 0.0 |
| Bachelor's Degree | 0 (0.0%) | 0.0 |
| Graduate Degree | 0 (0.0%) | 0.0 |
| Total | 0 (0.0%) | 0.0 |
Fertility by Education by Marriage Status in Bear Valley CDP Alpine County
| Educational Attainment | Married | Unmarried |
| Less than High School | 0 (0.0%) | 0 (0.0%) |
| High School Diploma | 0 (0.0%) | 0 (0.0%) |
| College or Associate's Degree | 0 (0.0%) | 0 (0.0%) |
| Bachelor's Degree | 0 (0.0%) | 0 (0.0%) |
| Graduate Degree | 0 (0.0%) | 0 (0.0%) |
| Total | 0 (0.0%) | 0 (0.0%) |
Employment Characteristics in Bear Valley CDP Alpine County
Employment by Class of Employer in Bear Valley CDP Alpine County
Among the 46 employed individuals in Bear Valley CDP Alpine County, , and private company employees (46 | 100.0%) make up the most common classes of employment.
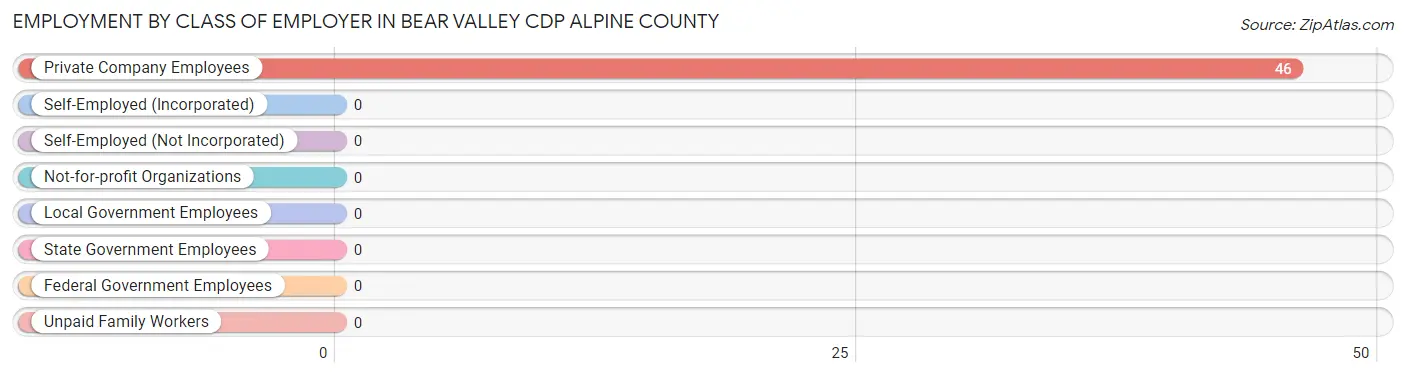
| Employer Class | # Employees | % Employees |
| Private Company Employees | 46 | 100.0% |
| Self-Employed (Incorporated) | 0 | 0.0% |
| Self-Employed (Not Incorporated) | 0 | 0.0% |
| Not-for-profit Organizations | 0 | 0.0% |
| Local Government Employees | 0 | 0.0% |
| State Government Employees | 0 | 0.0% |
| Federal Government Employees | 0 | 0.0% |
| Unpaid Family Workers | 0 | 0.0% |
| Total | 46 | 100.0% |
Employment Status by Age in Bear Valley CDP Alpine County
According to the labor force statistics for Bear Valley CDP Alpine County, out of the total population over 16 years of age (66), 89.4% or 59 individuals are in the labor force, with 22.0% or 13 of them unemployed. The age group with the highest labor force participation rate is 16 to 19 years, with 100.0% or 9 individuals in the labor force. Within the labor force, the 55 to 59 years age range has the highest percentage of unemployed individuals, with 100.0% or 13 of them being unemployed.
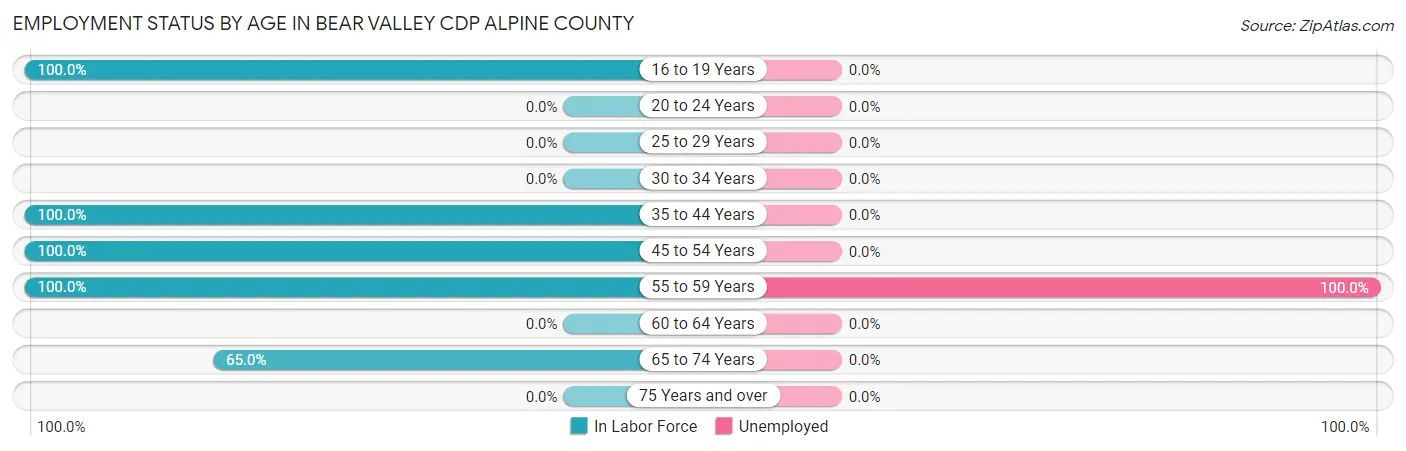
| Age Bracket | In Labor Force | Unemployed |
| 16 to 19 Years | 9 (100.0%) | 0 (0.0%) |
| 20 to 24 Years | 0 (0.0%) | 0 (0.0%) |
| 25 to 29 Years | 0 (0.0%) | 0 (0.0%) |
| 30 to 34 Years | 0 (0.0%) | 0 (0.0%) |
| 35 to 44 Years | 9 (100.0%) | 0 (0.0%) |
| 45 to 54 Years | 15 (100.0%) | 0 (0.0%) |
| 55 to 59 Years | 13 (100.0%) | 13 (100.0%) |
| 60 to 64 Years | 0 (0.0%) | 0 (0.0%) |
| 65 to 74 Years | 13 (65.0%) | 0 (0.0%) |
| 75 Years and over | 0 (0.0%) | 0 (0.0%) |
| Total | 59 (89.4%) | 13 (22.0%) |
Employment Status by Educational Attainment in Bear Valley CDP Alpine County
According to labor force statistics for Bear Valley CDP Alpine County, 100.0% of individuals (37) out of the total population between 25 and 64 years of age (37) are in the labor force, with 35.1% or 13 of them being unemployed. The group with the highest labor force participation rate are those with the educational attainment of bachelor's degree or higher, with 100.0% or 37 individuals in the labor force. Within the labor force, individuals with bachelor's degree or higher education have the highest percentage of unemployment, with 35.1% or 13 of them being unemployed.
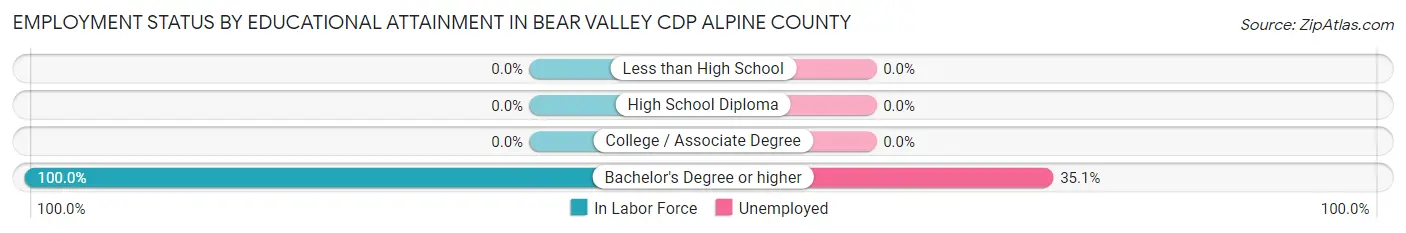
| Educational Attainment | In Labor Force | Unemployed |
| Less than High School | 0 (0.0%) | 0 (0.0%) |
| High School Diploma | 0 (0.0%) | 0 (0.0%) |
| College / Associate Degree | 0 (0.0%) | 0 (0.0%) |
| Bachelor's Degree or higher | 37 (100.0%) | 13 (35.1%) |
| Total | 37 (100.0%) | 13 (35.1%) |
Employment Occupations by Sex in Bear Valley CDP Alpine County
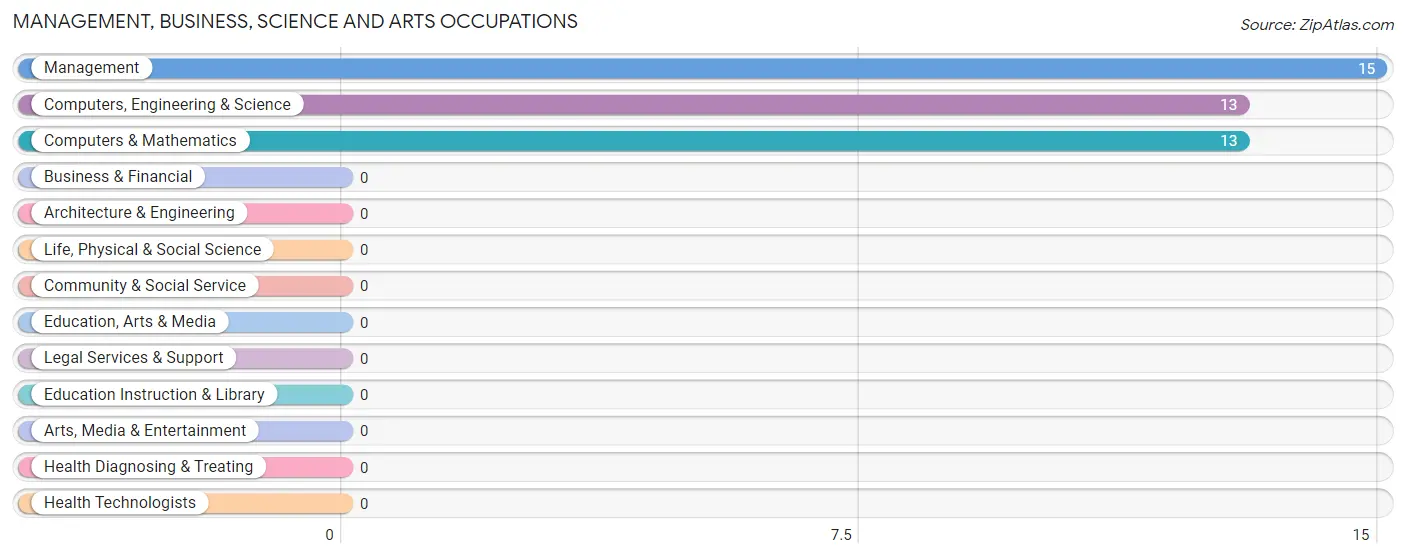
Management, Business, Science and Arts Occupations
The most common Management, Business, Science and Arts occupations in Bear Valley CDP Alpine County are Management (15 | 32.6%), Computers, Engineering & Science (13 | 28.3%), and Computers & Mathematics (13 | 28.3%).
Management, Business, Science and Arts Occupations by Sex
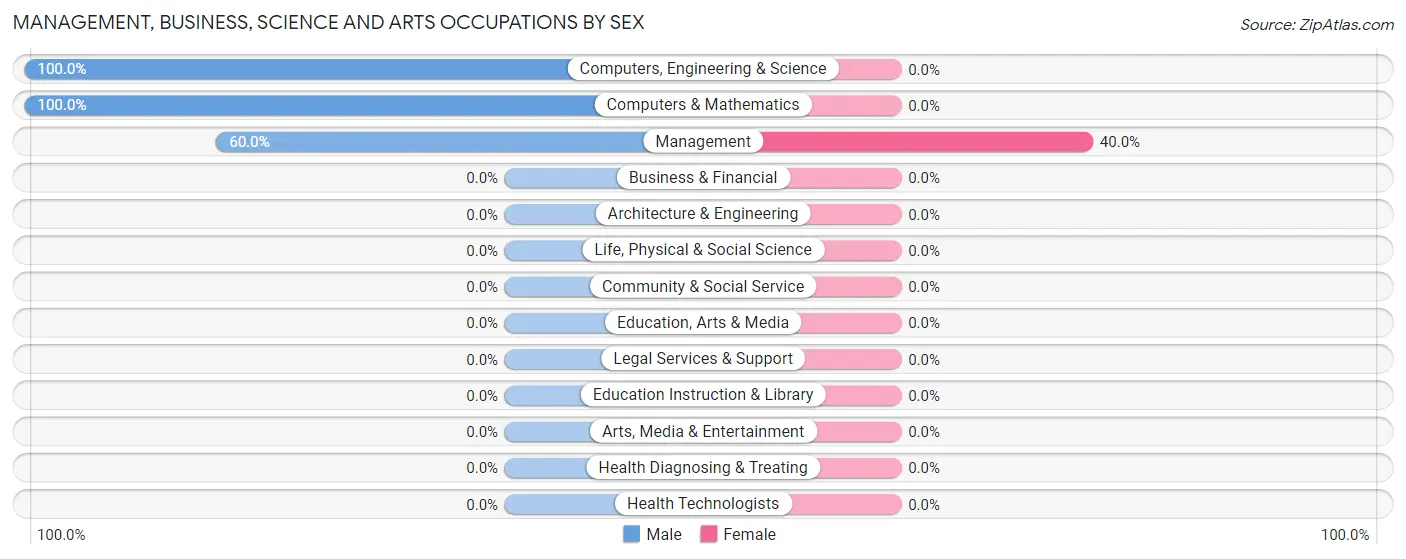
| Occupation | Male | Female |
| Management | 9 (60.0%) | 6 (40.0%) |
| Business & Financial | 0 (0.0%) | 0 (0.0%) |
| Computers, Engineering & Science | 13 (100.0%) | 0 (0.0%) |
| Computers & Mathematics | 13 (100.0%) | 0 (0.0%) |
| Architecture & Engineering | 0 (0.0%) | 0 (0.0%) |
| Life, Physical & Social Science | 0 (0.0%) | 0 (0.0%) |
| Community & Social Service | 0 (0.0%) | 0 (0.0%) |
| Education, Arts & Media | 0 (0.0%) | 0 (0.0%) |
| Legal Services & Support | 0 (0.0%) | 0 (0.0%) |
| Education Instruction & Library | 0 (0.0%) | 0 (0.0%) |
| Arts, Media & Entertainment | 0 (0.0%) | 0 (0.0%) |
| Health Diagnosing & Treating | 0 (0.0%) | 0 (0.0%) |
| Health Technologists | 0 (0.0%) | 0 (0.0%) |
| Total (Category) | 22 (78.6%) | 6 (21.4%) |
| Total (Overall) | 31 (67.4%) | 15 (32.6%) |
Services Occupations
Services Occupations by Sex
| Occupation | Male | Female |
| Healthcare Support | 0 (0.0%) | 0 (0.0%) |
| Security & Protection | 0 (0.0%) | 0 (0.0%) |
| Firefighting & Prevention | 0 (0.0%) | 0 (0.0%) |
| Law Enforcement | 0 (0.0%) | 0 (0.0%) |
| Food Preparation & Serving | 0 (0.0%) | 0 (0.0%) |
| Cleaning & Maintenance | 0 (0.0%) | 0 (0.0%) |
| Personal Care & Service | 0 (0.0%) | 0 (0.0%) |
| Total (Category) | 0 (0.0%) | 0 (0.0%) |
| Total (Overall) | 31 (67.4%) | 15 (32.6%) |
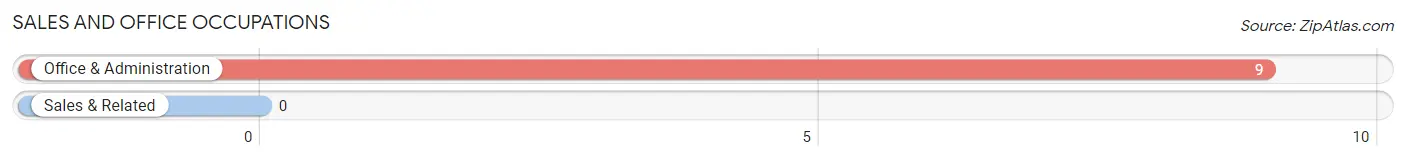
Sales and Office Occupations
The most common Sales and Office occupations in Bear Valley CDP Alpine County are , and Office & Administration (9 | 19.6%).
Sales and Office Occupations by Sex
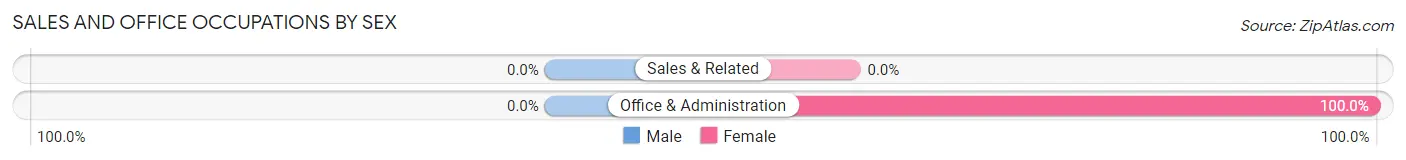
| Occupation | Male | Female |
| Sales & Related | 0 (0.0%) | 0 (0.0%) |
| Office & Administration | 0 (0.0%) | 9 (100.0%) |
| Total (Category) | 0 (0.0%) | 9 (100.0%) |
| Total (Overall) | 31 (67.4%) | 15 (32.6%) |
Natural Resources, Construction and Maintenance Occupations
The most common Natural Resources, Construction and Maintenance occupations in Bear Valley CDP Alpine County are , and Installation, Maintenance & Repair (9 | 19.6%).
Natural Resources, Construction and Maintenance Occupations by Sex
| Occupation | Male | Female |
| Farming, Fishing & Forestry | 0 (0.0%) | 0 (0.0%) |
| Construction & Extraction | 0 (0.0%) | 0 (0.0%) |
| Installation, Maintenance & Repair | 9 (100.0%) | 0 (0.0%) |
| Total (Category) | 9 (100.0%) | 0 (0.0%) |
| Total (Overall) | 31 (67.4%) | 15 (32.6%) |
Production, Transportation and Moving Occupations
Production, Transportation and Moving Occupations by Sex
| Occupation | Male | Female |
| Production | 0 (0.0%) | 0 (0.0%) |
| Transportation | 0 (0.0%) | 0 (0.0%) |
| Material Moving | 0 (0.0%) | 0 (0.0%) |
| Total (Category) | 0 (0.0%) | 0 (0.0%) |
| Total (Overall) | 31 (67.4%) | 15 (32.6%) |
Employment Industries by Sex in Bear Valley CDP Alpine County
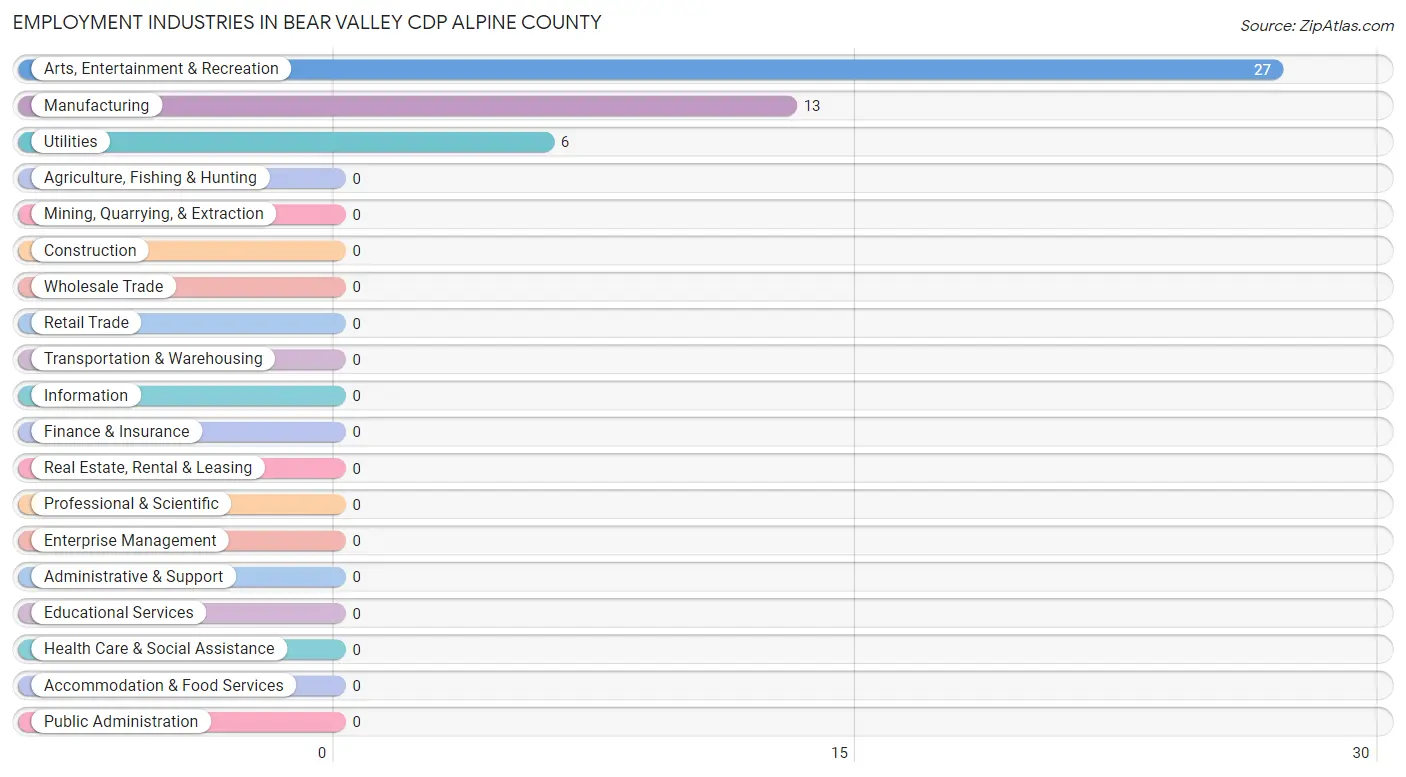
Employment Industries in Bear Valley CDP Alpine County
The major employment industries in Bear Valley CDP Alpine County include Arts, Entertainment & Recreation (27 | 58.7%), Manufacturing (13 | 28.3%), and Utilities (6 | 13.0%).
Employment Industries by Sex in Bear Valley CDP Alpine County
The Bear Valley CDP Alpine County industries that see more men than women are Manufacturing (100.0%), and Arts, Entertainment & Recreation (66.7%), whereas the industries that tend to have a higher number of women are Utilities (100.0%), and Arts, Entertainment & Recreation (33.3%).
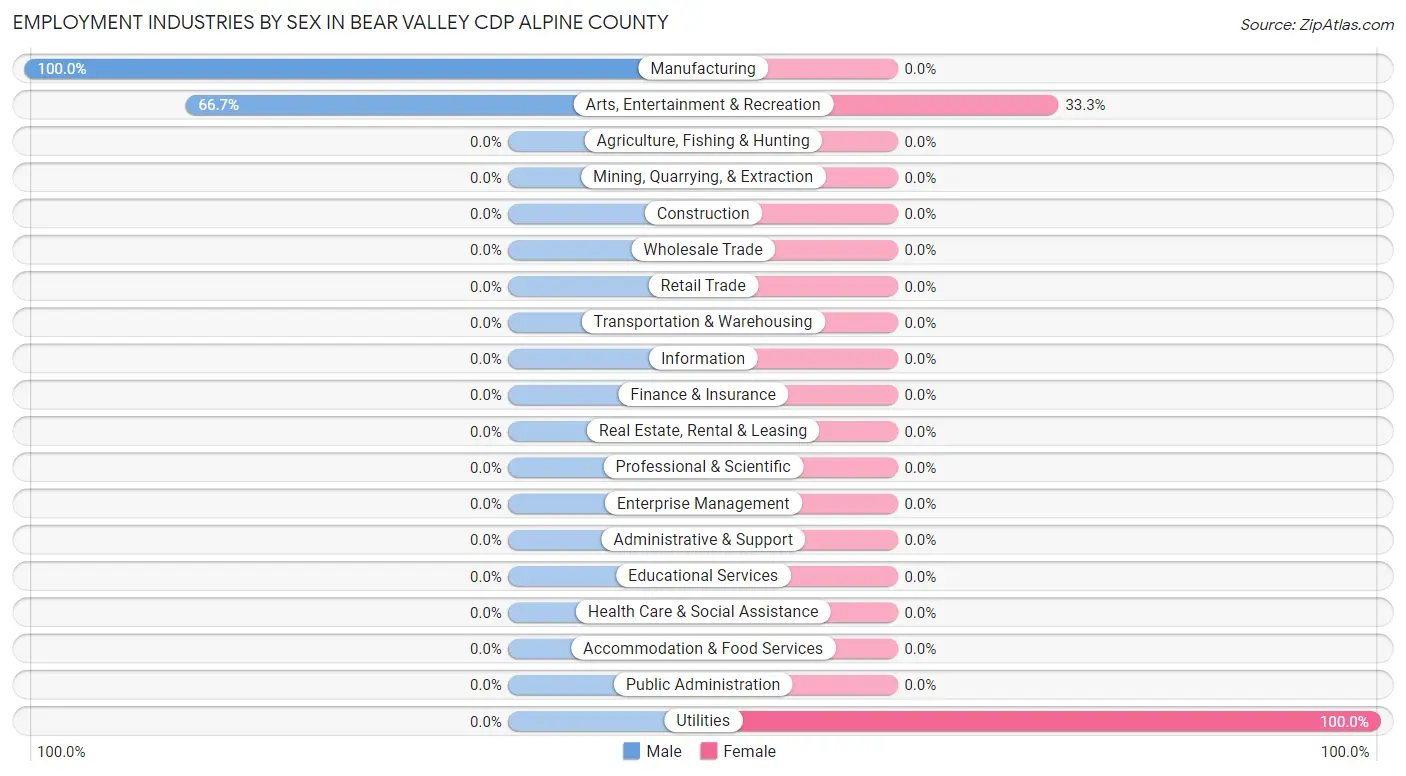
| Industry | Male | Female |
| Agriculture, Fishing & Hunting | 0 (0.0%) | 0 (0.0%) |
| Mining, Quarrying, & Extraction | 0 (0.0%) | 0 (0.0%) |
| Construction | 0 (0.0%) | 0 (0.0%) |
| Manufacturing | 13 (100.0%) | 0 (0.0%) |
| Wholesale Trade | 0 (0.0%) | 0 (0.0%) |
| Retail Trade | 0 (0.0%) | 0 (0.0%) |
| Transportation & Warehousing | 0 (0.0%) | 0 (0.0%) |
| Utilities | 0 (0.0%) | 6 (100.0%) |
| Information | 0 (0.0%) | 0 (0.0%) |
| Finance & Insurance | 0 (0.0%) | 0 (0.0%) |
| Real Estate, Rental & Leasing | 0 (0.0%) | 0 (0.0%) |
| Professional & Scientific | 0 (0.0%) | 0 (0.0%) |
| Enterprise Management | 0 (0.0%) | 0 (0.0%) |
| Administrative & Support | 0 (0.0%) | 0 (0.0%) |
| Educational Services | 0 (0.0%) | 0 (0.0%) |
| Health Care & Social Assistance | 0 (0.0%) | 0 (0.0%) |
| Arts, Entertainment & Recreation | 18 (66.7%) | 9 (33.3%) |
| Accommodation & Food Services | 0 (0.0%) | 0 (0.0%) |
| Public Administration | 0 (0.0%) | 0 (0.0%) |
| Total | 31 (67.4%) | 15 (32.6%) |
Education in Bear Valley CDP Alpine County
School Enrollment in Bear Valley CDP Alpine County
The most common levels of schooling among the 15 students in Bear Valley CDP Alpine County are high school (9 | 60.0%), and middle school (6 | 40.0%).
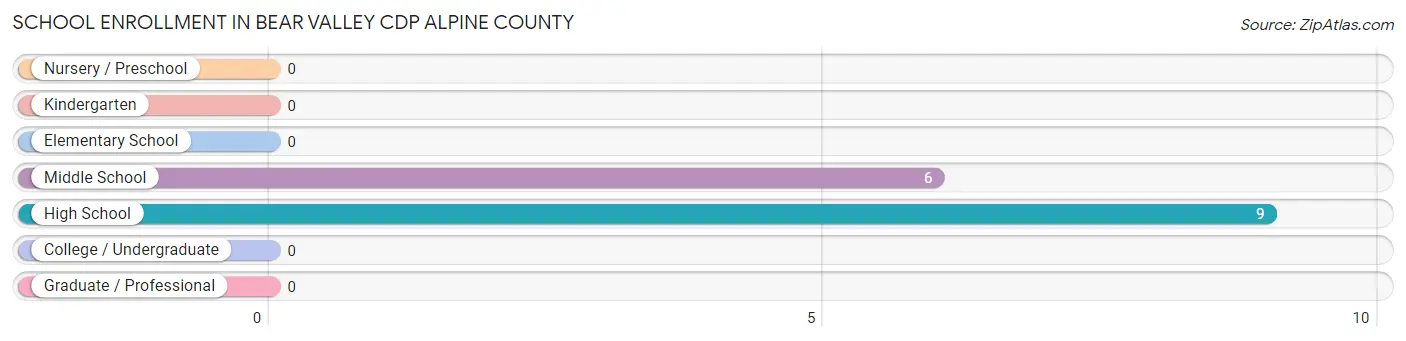
| School Level | # Students | % Students |
| Nursery / Preschool | 0 | 0.0% |
| Kindergarten | 0 | 0.0% |
| Elementary School | 0 | 0.0% |
| Middle School | 6 | 40.0% |
| High School | 9 | 60.0% |
| College / Undergraduate | 0 | 0.0% |
| Graduate / Professional | 0 | 0.0% |
| Total | 15 | 100.0% |
School Enrollment by Age by Funding Source in Bear Valley CDP Alpine County
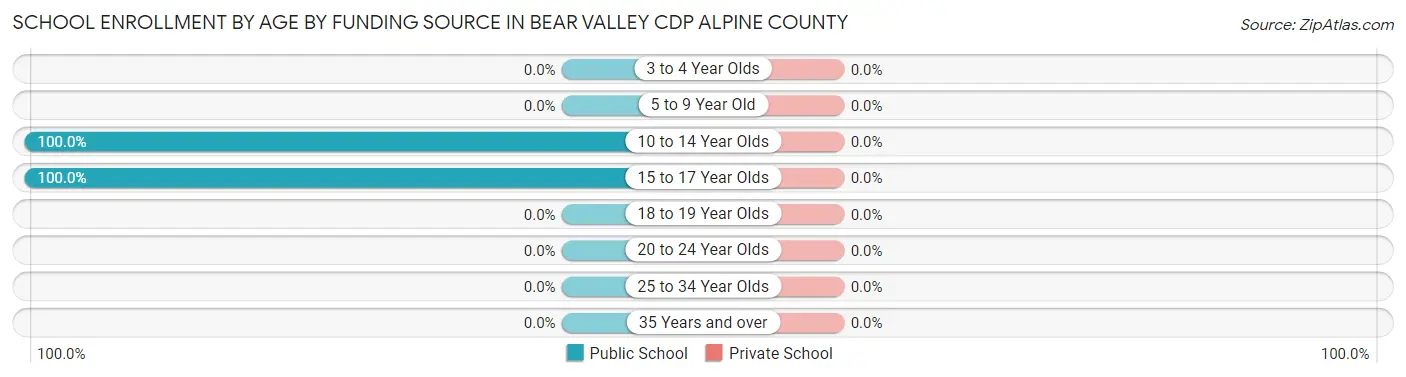
| Age Bracket | Public School | Private School |
| 3 to 4 Year Olds | 0 (0.0%) | 0 (0.0%) |
| 5 to 9 Year Old | 0 (0.0%) | 0 (0.0%) |
| 10 to 14 Year Olds | 6 (100.0%) | 0 (0.0%) |
| 15 to 17 Year Olds | 9 (100.0%) | 0 (0.0%) |
| 18 to 19 Year Olds | 0 (0.0%) | 0 (0.0%) |
| 20 to 24 Year Olds | 0 (0.0%) | 0 (0.0%) |
| 25 to 34 Year Olds | 0 (0.0%) | 0 (0.0%) |
| 35 Years and over | 0 (0.0%) | 0 (0.0%) |
| Total | 15 (100.0%) | 0 (0.0%) |
Educational Attainment by Field of Study in Bear Valley CDP Alpine County
Bio, nature & agricultural (15 | 26.3%), computers & mathematics (13 | 22.8%), physical & health sciences (13 | 22.8%), arts & humanities (9 | 15.8%), and engineering (4 | 7.0%) are the most common fields of study among 57 individuals in Bear Valley CDP Alpine County who have obtained a bachelor's degree or higher.
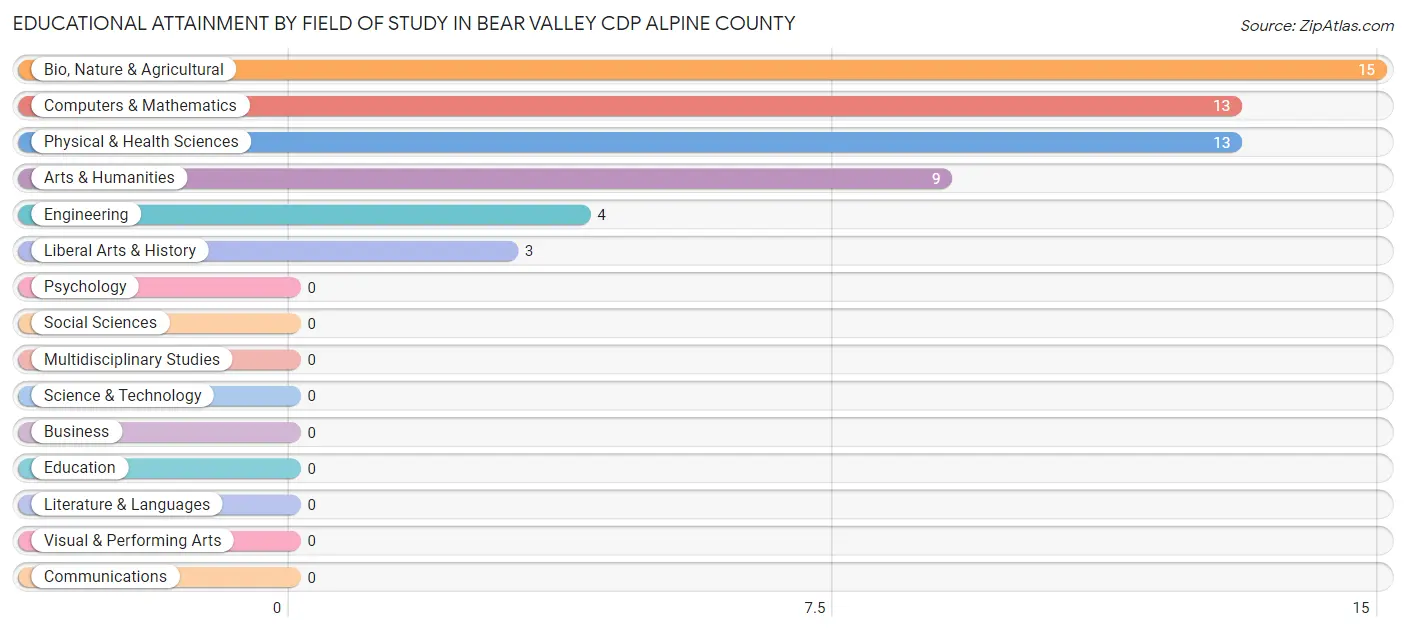
| Field of Study | # Graduates | % Graduates |
| Computers & Mathematics | 13 | 22.8% |
| Bio, Nature & Agricultural | 15 | 26.3% |
| Physical & Health Sciences | 13 | 22.8% |
| Psychology | 0 | 0.0% |
| Social Sciences | 0 | 0.0% |
| Engineering | 4 | 7.0% |
| Multidisciplinary Studies | 0 | 0.0% |
| Science & Technology | 0 | 0.0% |
| Business | 0 | 0.0% |
| Education | 0 | 0.0% |
| Literature & Languages | 0 | 0.0% |
| Liberal Arts & History | 3 | 5.3% |
| Visual & Performing Arts | 0 | 0.0% |
| Communications | 0 | 0.0% |
| Arts & Humanities | 9 | 15.8% |
| Total | 57 | 100.0% |
Transportation & Commute in Bear Valley CDP Alpine County
Vehicle Availability by Sex in Bear Valley CDP Alpine County
The most prevalent vehicle ownership categories in Bear Valley CDP Alpine County are males with 1 vehicle (13, accounting for 41.9%) and females with 1 vehicle (0, making up 86.7%).
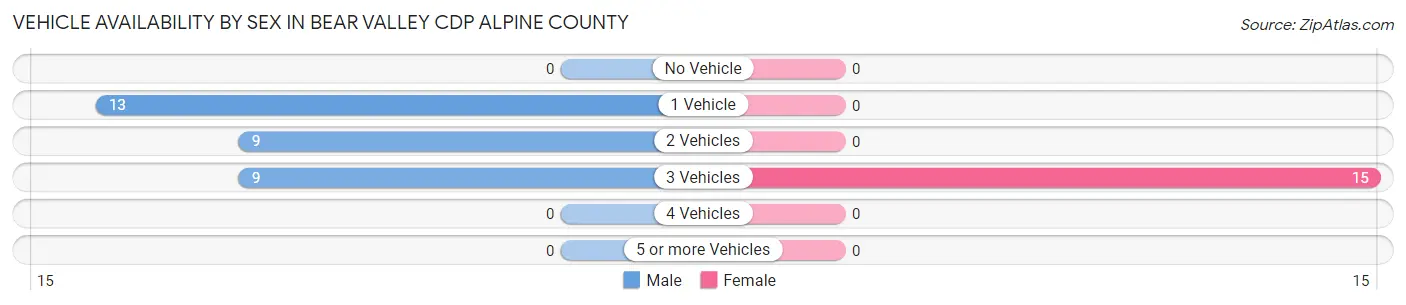
| Vehicles Available | Male | Female |
| No Vehicle | 0 (0.0%) | 0 (0.0%) |
| 1 Vehicle | 13 (41.9%) | 0 (0.0%) |
| 2 Vehicles | 9 (29.0%) | 0 (0.0%) |
| 3 Vehicles | 9 (29.0%) | 15 (100.0%) |
| 4 Vehicles | 0 (0.0%) | 0 (0.0%) |
| 5 or more Vehicles | 0 (0.0%) | 0 (0.0%) |
| Total | 31 (100.0%) | 15 (100.0%) |
Commute Time in Bear Valley CDP Alpine County
The most frequently occuring commute durations in Bear Valley CDP Alpine County are less than 5 minutes (24 commuters, 72.7%), 5 to 9 minutes (9 commuters, 27.3%), and 10 to 14 minutes (0 commuters, 0.0%).
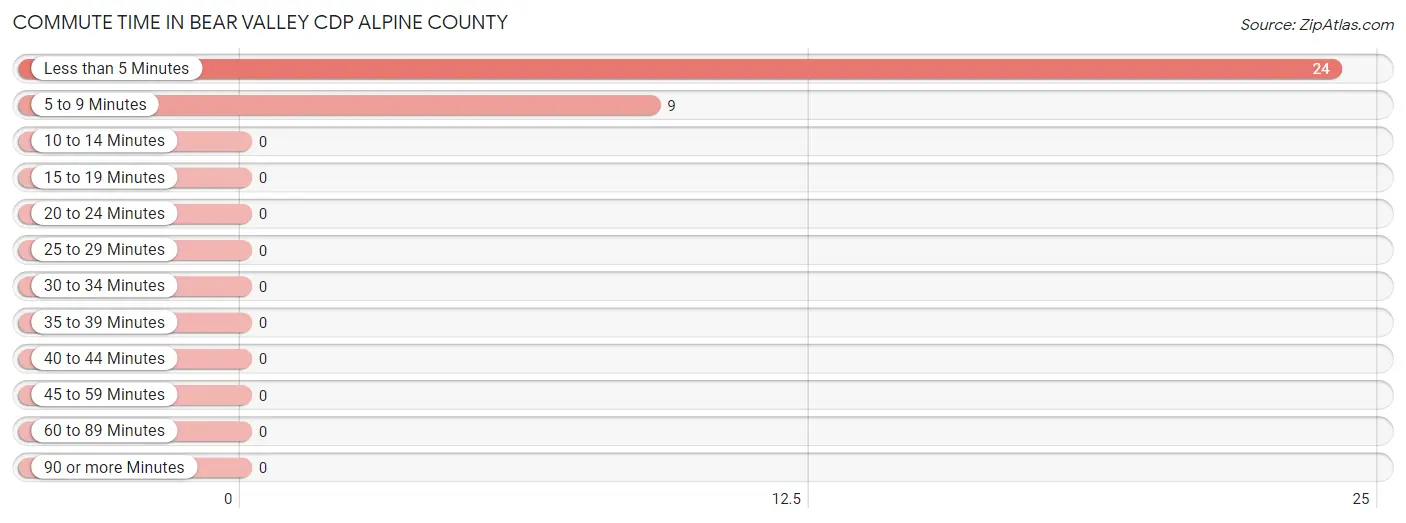
| Commute Time | # Commuters | % Commuters |
| Less than 5 Minutes | 24 | 72.7% |
| 5 to 9 Minutes | 9 | 27.3% |
| 10 to 14 Minutes | 0 | 0.0% |
| 15 to 19 Minutes | 0 | 0.0% |
| 20 to 24 Minutes | 0 | 0.0% |
| 25 to 29 Minutes | 0 | 0.0% |
| 30 to 34 Minutes | 0 | 0.0% |
| 35 to 39 Minutes | 0 | 0.0% |
| 40 to 44 Minutes | 0 | 0.0% |
| 45 to 59 Minutes | 0 | 0.0% |
| 60 to 89 Minutes | 0 | 0.0% |
| 90 or more Minutes | 0 | 0.0% |
Commute Time by Sex in Bear Valley CDP Alpine County
The most common commute times in Bear Valley CDP Alpine County are less than 5 minutes (9 commuters, 50.0%) for males and less than 5 minutes (15 commuters, 100.0%) for females.
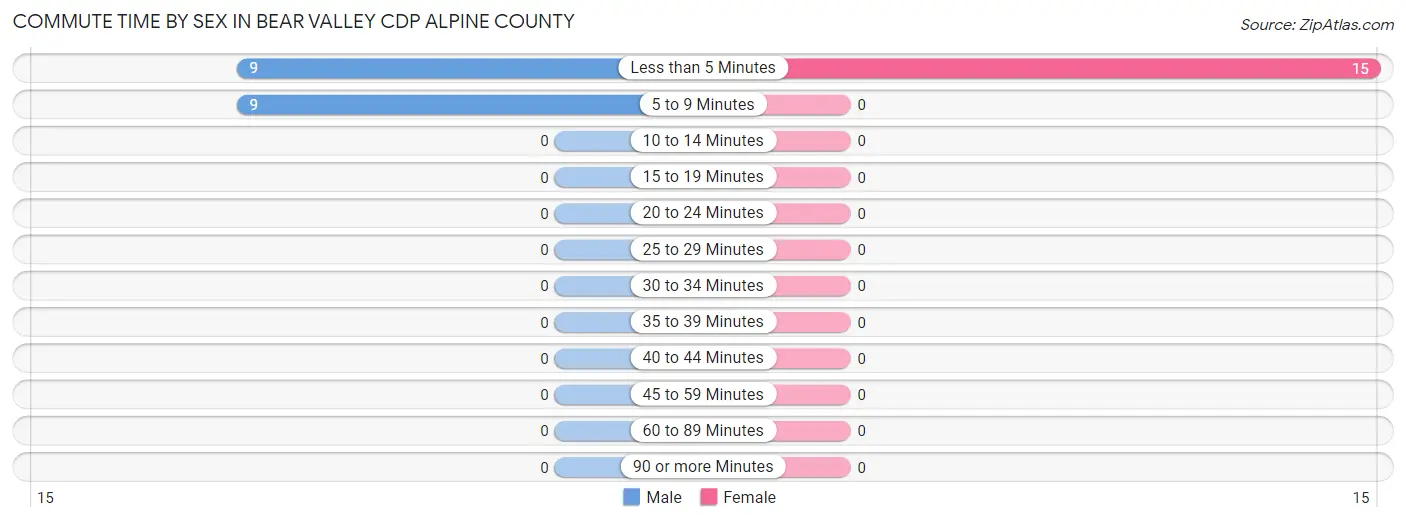
| Commute Time | Male | Female |
| Less than 5 Minutes | 9 (50.0%) | 15 (100.0%) |
| 5 to 9 Minutes | 9 (50.0%) | 0 (0.0%) |
| 10 to 14 Minutes | 0 (0.0%) | 0 (0.0%) |
| 15 to 19 Minutes | 0 (0.0%) | 0 (0.0%) |
| 20 to 24 Minutes | 0 (0.0%) | 0 (0.0%) |
| 25 to 29 Minutes | 0 (0.0%) | 0 (0.0%) |
| 30 to 34 Minutes | 0 (0.0%) | 0 (0.0%) |
| 35 to 39 Minutes | 0 (0.0%) | 0 (0.0%) |
| 40 to 44 Minutes | 0 (0.0%) | 0 (0.0%) |
| 45 to 59 Minutes | 0 (0.0%) | 0 (0.0%) |
| 60 to 89 Minutes | 0 (0.0%) | 0 (0.0%) |
| 90 or more Minutes | 0 (0.0%) | 0 (0.0%) |
Time of Departure to Work by Sex in Bear Valley CDP Alpine County
The most frequent times of departure to work in Bear Valley CDP Alpine County are 7:00 AM to 7:29 AM (9, 50.0%) for males and 8:30 AM to 8:59 AM (9, 60.0%) for females.
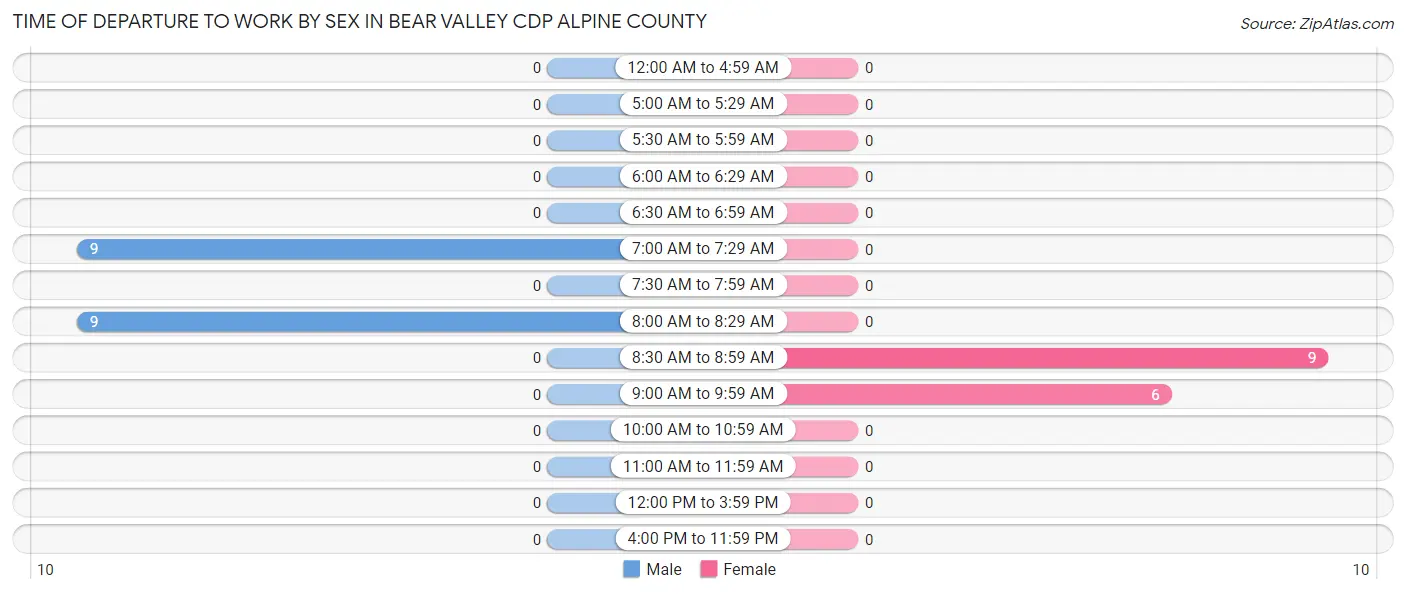
| Time of Departure | Male | Female |
| 12:00 AM to 4:59 AM | 0 (0.0%) | 0 (0.0%) |
| 5:00 AM to 5:29 AM | 0 (0.0%) | 0 (0.0%) |
| 5:30 AM to 5:59 AM | 0 (0.0%) | 0 (0.0%) |
| 6:00 AM to 6:29 AM | 0 (0.0%) | 0 (0.0%) |
| 6:30 AM to 6:59 AM | 0 (0.0%) | 0 (0.0%) |
| 7:00 AM to 7:29 AM | 9 (50.0%) | 0 (0.0%) |
| 7:30 AM to 7:59 AM | 0 (0.0%) | 0 (0.0%) |
| 8:00 AM to 8:29 AM | 9 (50.0%) | 0 (0.0%) |
| 8:30 AM to 8:59 AM | 0 (0.0%) | 9 (60.0%) |
| 9:00 AM to 9:59 AM | 0 (0.0%) | 6 (40.0%) |
| 10:00 AM to 10:59 AM | 0 (0.0%) | 0 (0.0%) |
| 11:00 AM to 11:59 AM | 0 (0.0%) | 0 (0.0%) |
| 12:00 PM to 3:59 PM | 0 (0.0%) | 0 (0.0%) |
| 4:00 PM to 11:59 PM | 0 (0.0%) | 0 (0.0%) |
| Total | 18 (100.0%) | 15 (100.0%) |
Housing Occupancy in Bear Valley CDP Alpine County
Occupancy by Ownership in Bear Valley CDP Alpine County
Of the total 44 dwellings in Bear Valley CDP Alpine County, owner-occupied units account for 22 (50.0%), while renter-occupied units make up 22 (50.0%).
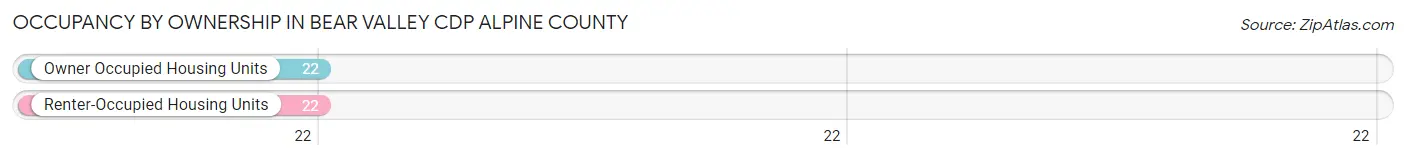
| Occupancy | # Housing Units | % Housing Units |
| Owner Occupied Housing Units | 22 | 50.0% |
| Renter-Occupied Housing Units | 22 | 50.0% |
| Total Occupied Housing Units | 44 | 100.0% |
Occupancy by Household Size in Bear Valley CDP Alpine County
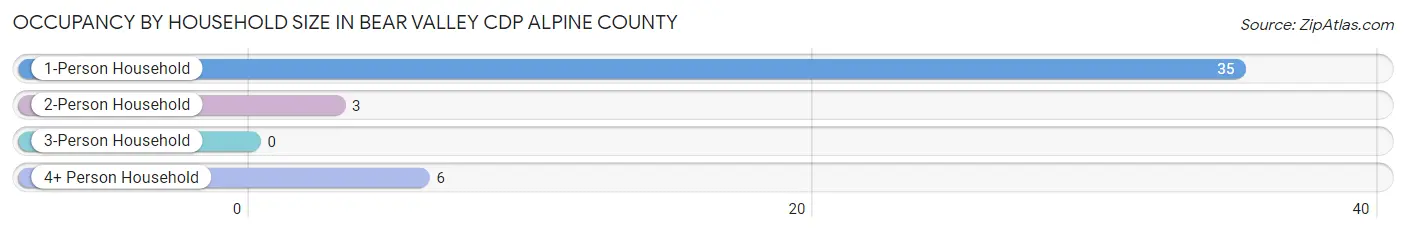
| Household Size | # Housing Units | % Housing Units |
| 1-Person Household | 35 | 79.5% |
| 2-Person Household | 3 | 6.8% |
| 3-Person Household | 0 | 0.0% |
| 4+ Person Household | 6 | 13.6% |
| Total Housing Units | 44 | 100.0% |
Occupancy by Ownership by Household Size in Bear Valley CDP Alpine County
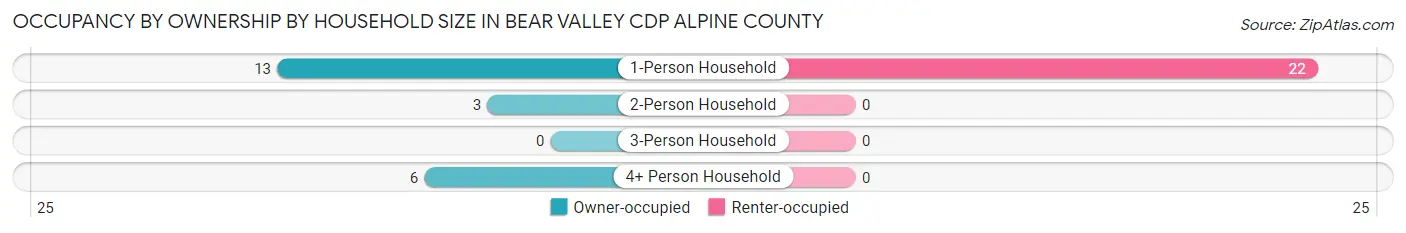
| Household Size | Owner-occupied | Renter-occupied |
| 1-Person Household | 13 (37.1%) | 22 (62.9%) |
| 2-Person Household | 3 (100.0%) | 0 (0.0%) |
| 3-Person Household | 0 (0.0%) | 0 (0.0%) |
| 4+ Person Household | 6 (100.0%) | 0 (0.0%) |
| Total Housing Units | 22 (50.0%) | 22 (50.0%) |
Occupancy by Educational Attainment in Bear Valley CDP Alpine County
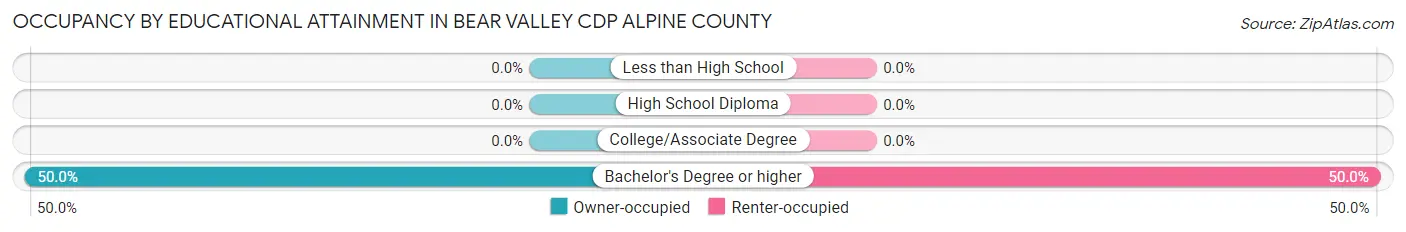
| Household Size | Owner-occupied | Renter-occupied |
| Less than High School | 0 (0.0%) | 0 (0.0%) |
| High School Diploma | 0 (0.0%) | 0 (0.0%) |
| College/Associate Degree | 0 (0.0%) | 0 (0.0%) |
| Bachelor's Degree or higher | 22 (50.0%) | 22 (50.0%) |
Occupancy by Age of Householder in Bear Valley CDP Alpine County
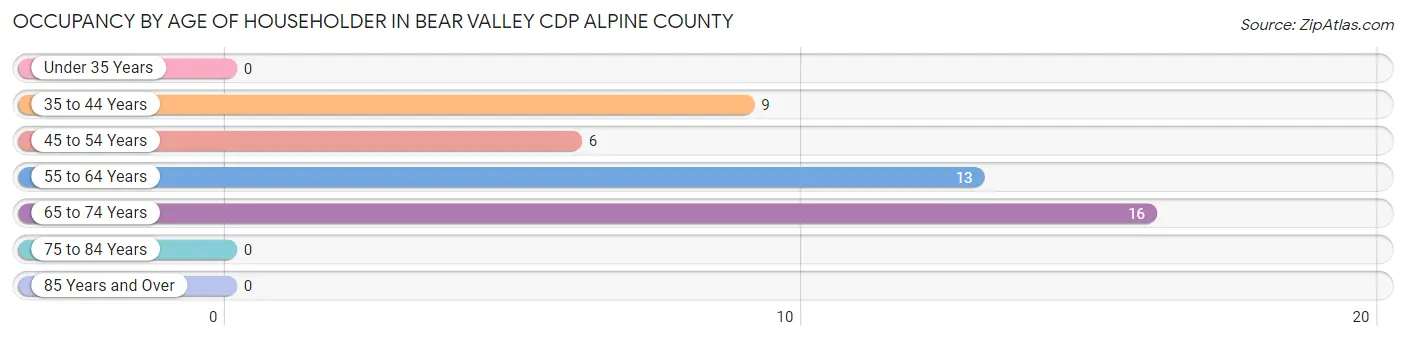
| Age Bracket | # Households | % Households |
| Under 35 Years | 0 | 0.0% |
| 35 to 44 Years | 9 | 20.4% |
| 45 to 54 Years | 6 | 13.6% |
| 55 to 64 Years | 13 | 29.5% |
| 65 to 74 Years | 16 | 36.4% |
| 75 to 84 Years | 0 | 0.0% |
| 85 Years and Over | 0 | 0.0% |
| Total | 44 | 100.0% |
Housing Finances in Bear Valley CDP Alpine County
Median Income by Occupancy in Bear Valley CDP Alpine County
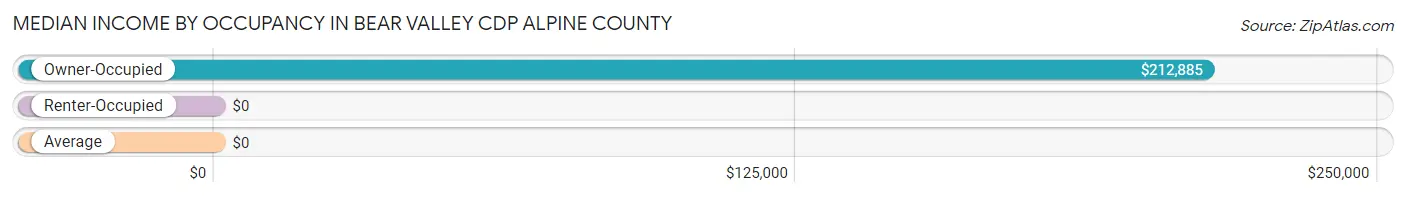
| Occupancy Type | # Households | Median Income |
| Owner-Occupied | 22 (50.0%) | $212,885 |
| Renter-Occupied | 22 (50.0%) | $0 |
| Average | 44 (100.0%) | $0 |
Occupancy by Householder Income Bracket in Bear Valley CDP Alpine County
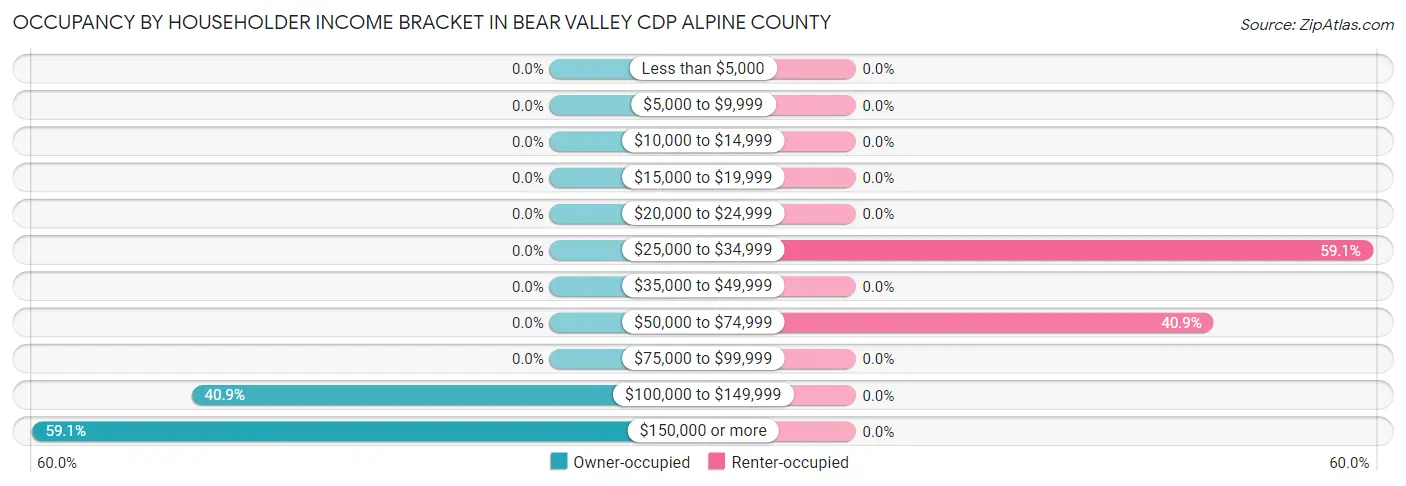
| Income Bracket | Owner-occupied | Renter-occupied |
| Less than $5,000 | 0 (0.0%) | 0 (0.0%) |
| $5,000 to $9,999 | 0 (0.0%) | 0 (0.0%) |
| $10,000 to $14,999 | 0 (0.0%) | 0 (0.0%) |
| $15,000 to $19,999 | 0 (0.0%) | 0 (0.0%) |
| $20,000 to $24,999 | 0 (0.0%) | 0 (0.0%) |
| $25,000 to $34,999 | 0 (0.0%) | 13 (59.1%) |
| $35,000 to $49,999 | 0 (0.0%) | 0 (0.0%) |
| $50,000 to $74,999 | 0 (0.0%) | 9 (40.9%) |
| $75,000 to $99,999 | 0 (0.0%) | 0 (0.0%) |
| $100,000 to $149,999 | 9 (40.9%) | 0 (0.0%) |
| $150,000 or more | 13 (59.1%) | 0 (0.0%) |
| Total | 22 (100.0%) | 22 (100.0%) |
Monthly Housing Cost Tiers in Bear Valley CDP Alpine County
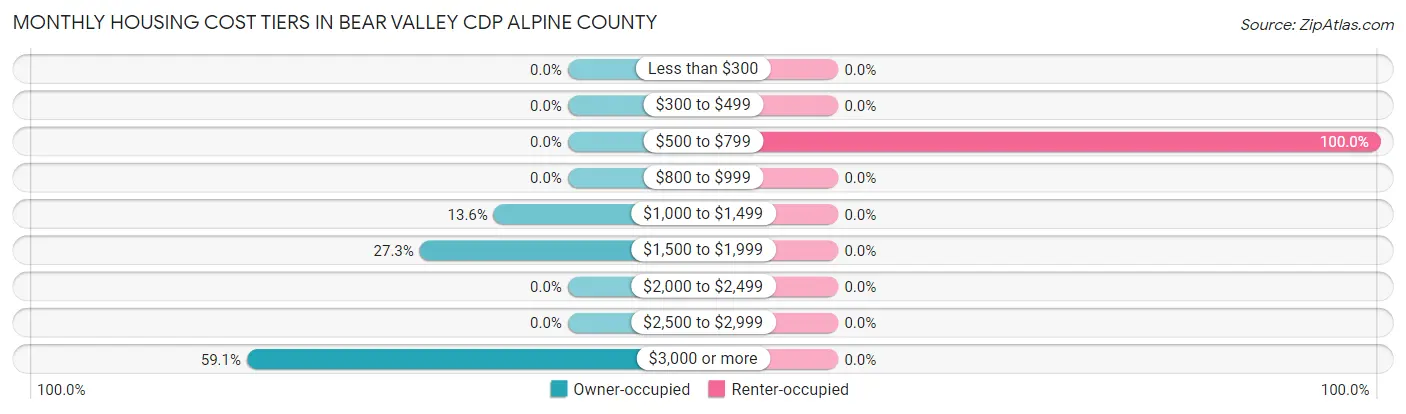
| Monthly Cost | Owner-occupied | Renter-occupied |
| Less than $300 | 0 (0.0%) | 0 (0.0%) |
| $300 to $499 | 0 (0.0%) | 0 (0.0%) |
| $500 to $799 | 0 (0.0%) | 22 (100.0%) |
| $800 to $999 | 0 (0.0%) | 0 (0.0%) |
| $1,000 to $1,499 | 3 (13.6%) | 0 (0.0%) |
| $1,500 to $1,999 | 6 (27.3%) | 0 (0.0%) |
| $2,000 to $2,499 | 0 (0.0%) | 0 (0.0%) |
| $2,500 to $2,999 | 0 (0.0%) | 0 (0.0%) |
| $3,000 or more | 13 (59.1%) | 0 (0.0%) |
| Total | 22 (100.0%) | 22 (100.0%) |
Physical Housing Characteristics in Bear Valley CDP Alpine County
Housing Structures in Bear Valley CDP Alpine County
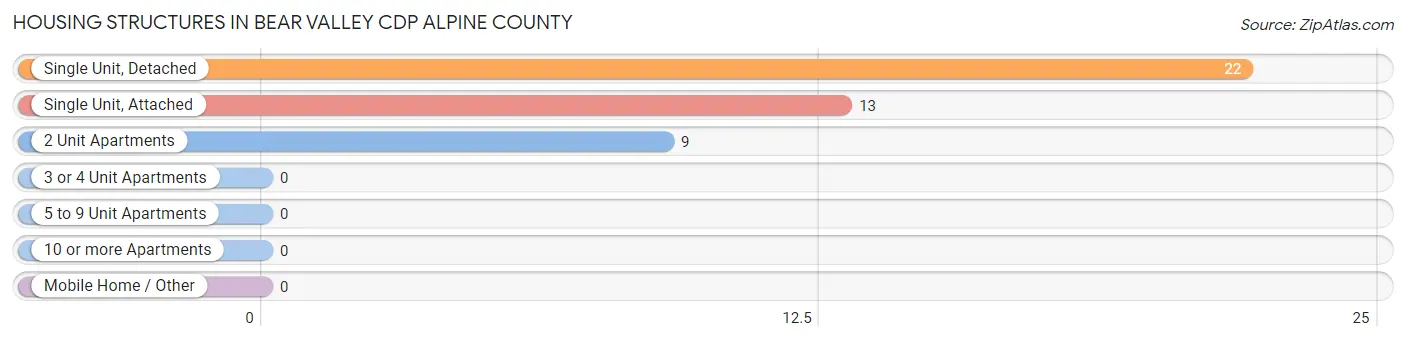
| Structure Type | # Housing Units | % Housing Units |
| Single Unit, Detached | 22 | 50.0% |
| Single Unit, Attached | 13 | 29.5% |
| 2 Unit Apartments | 9 | 20.4% |
| 3 or 4 Unit Apartments | 0 | 0.0% |
| 5 to 9 Unit Apartments | 0 | 0.0% |
| 10 or more Apartments | 0 | 0.0% |
| Mobile Home / Other | 0 | 0.0% |
| Total | 44 | 100.0% |
Housing Structures by Occupancy in Bear Valley CDP Alpine County
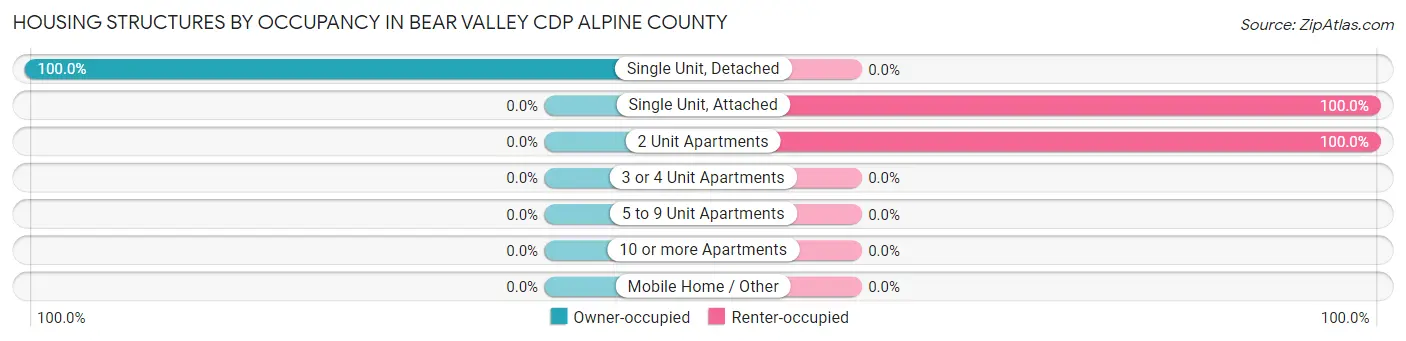
| Structure Type | Owner-occupied | Renter-occupied |
| Single Unit, Detached | 22 (100.0%) | 0 (0.0%) |
| Single Unit, Attached | 0 (0.0%) | 13 (100.0%) |
| 2 Unit Apartments | 0 (0.0%) | 9 (100.0%) |
| 3 or 4 Unit Apartments | 0 (0.0%) | 0 (0.0%) |
| 5 to 9 Unit Apartments | 0 (0.0%) | 0 (0.0%) |
| 10 or more Apartments | 0 (0.0%) | 0 (0.0%) |
| Mobile Home / Other | 0 (0.0%) | 0 (0.0%) |
| Total | 22 (50.0%) | 22 (50.0%) |
Housing Structures by Number of Rooms in Bear Valley CDP Alpine County
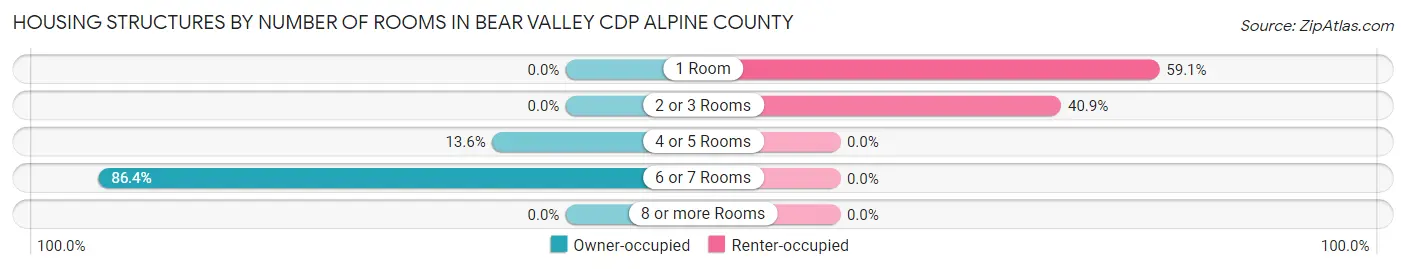
| Number of Rooms | Owner-occupied | Renter-occupied |
| 1 Room | 0 (0.0%) | 13 (59.1%) |
| 2 or 3 Rooms | 0 (0.0%) | 9 (40.9%) |
| 4 or 5 Rooms | 3 (13.6%) | 0 (0.0%) |
| 6 or 7 Rooms | 19 (86.4%) | 0 (0.0%) |
| 8 or more Rooms | 0 (0.0%) | 0 (0.0%) |
| Total | 22 (100.0%) | 22 (100.0%) |
Housing Structure by Heating Type in Bear Valley CDP Alpine County
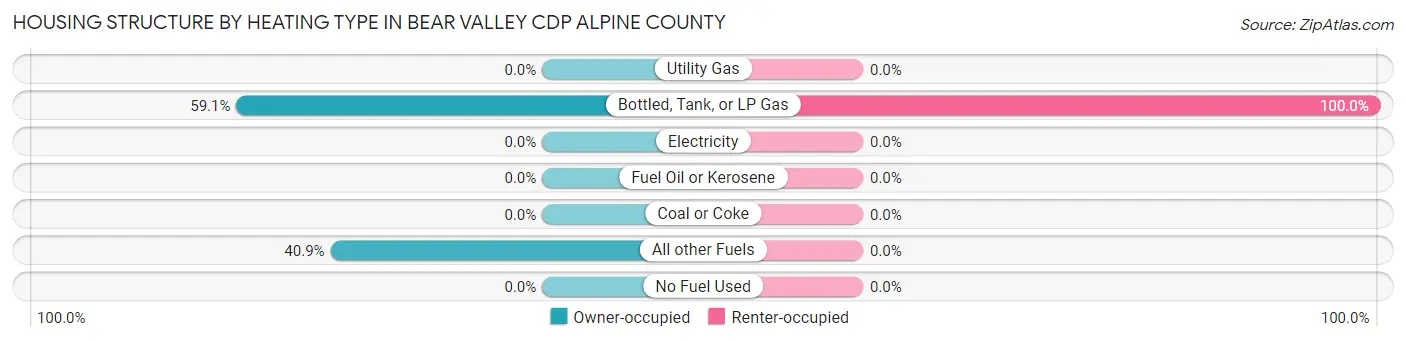
| Heating Type | Owner-occupied | Renter-occupied |
| Utility Gas | 0 (0.0%) | 0 (0.0%) |
| Bottled, Tank, or LP Gas | 13 (59.1%) | 22 (100.0%) |
| Electricity | 0 (0.0%) | 0 (0.0%) |
| Fuel Oil or Kerosene | 0 (0.0%) | 0 (0.0%) |
| Coal or Coke | 0 (0.0%) | 0 (0.0%) |
| All other Fuels | 9 (40.9%) | 0 (0.0%) |
| No Fuel Used | 0 (0.0%) | 0 (0.0%) |
| Total | 22 (100.0%) | 22 (100.0%) |
Household Vehicle Usage in Bear Valley CDP Alpine County
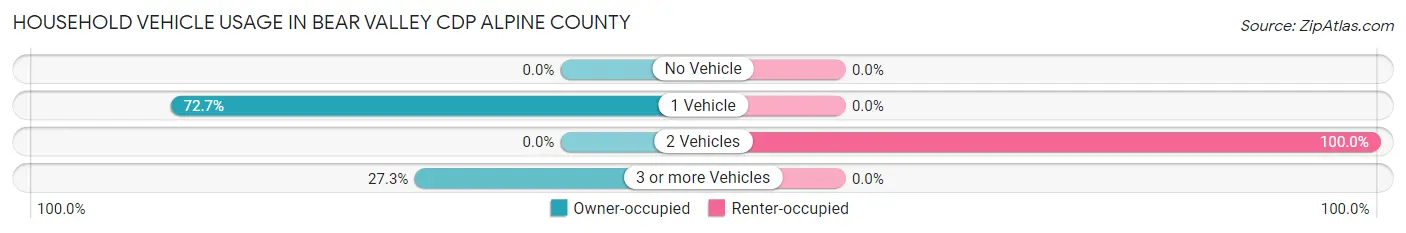
| Vehicles per Household | Owner-occupied | Renter-occupied |
| No Vehicle | 0 (0.0%) | 0 (0.0%) |
| 1 Vehicle | 16 (72.7%) | 0 (0.0%) |
| 2 Vehicles | 0 (0.0%) | 22 (100.0%) |
| 3 or more Vehicles | 6 (27.3%) | 0 (0.0%) |
| Total | 22 (100.0%) | 22 (100.0%) |
Real Estate & Mortgages in Bear Valley CDP Alpine County
Real Estate and Mortgage Overview in Bear Valley CDP Alpine County
| Characteristic | Without Mortgage | With Mortgage |
| Housing Units | 0 | 22 |
| Median Property Value | - | - |
| Median Household Income | - | - |
| Monthly Housing Costs | - | - |
| Real Estate Taxes | - | - |
Property Value by Mortgage Status in Bear Valley CDP Alpine County
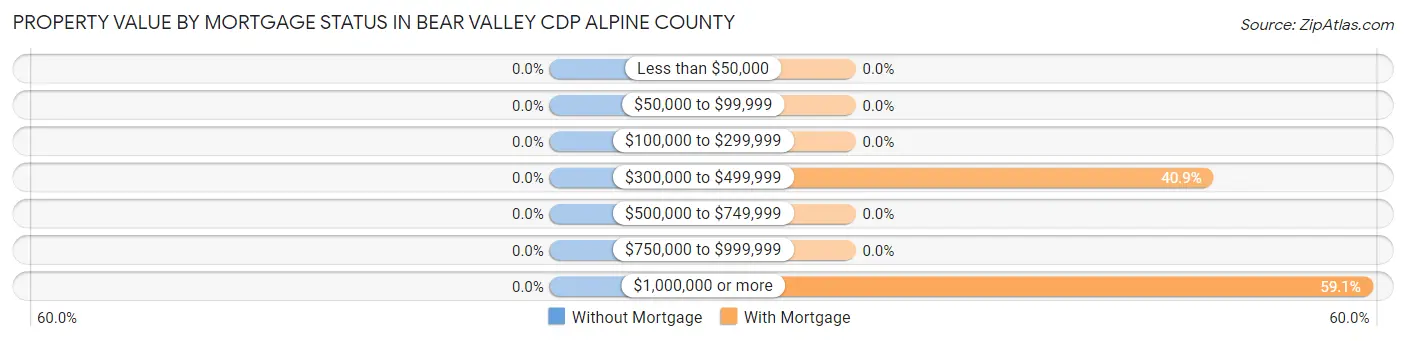
| Property Value | Without Mortgage | With Mortgage |
| Less than $50,000 | 0 (0.0%) | 0 (0.0%) |
| $50,000 to $99,999 | 0 (0.0%) | 0 (0.0%) |
| $100,000 to $299,999 | 0 (0.0%) | 0 (0.0%) |
| $300,000 to $499,999 | 0 (0.0%) | 9 (40.9%) |
| $500,000 to $749,999 | 0 (0.0%) | 0 (0.0%) |
| $750,000 to $999,999 | 0 (0.0%) | 0 (0.0%) |
| $1,000,000 or more | 0 (0.0%) | 13 (59.1%) |
| Total | 0 (0.0%) | 22 (100.0%) |
Household Income by Mortgage Status in Bear Valley CDP Alpine County
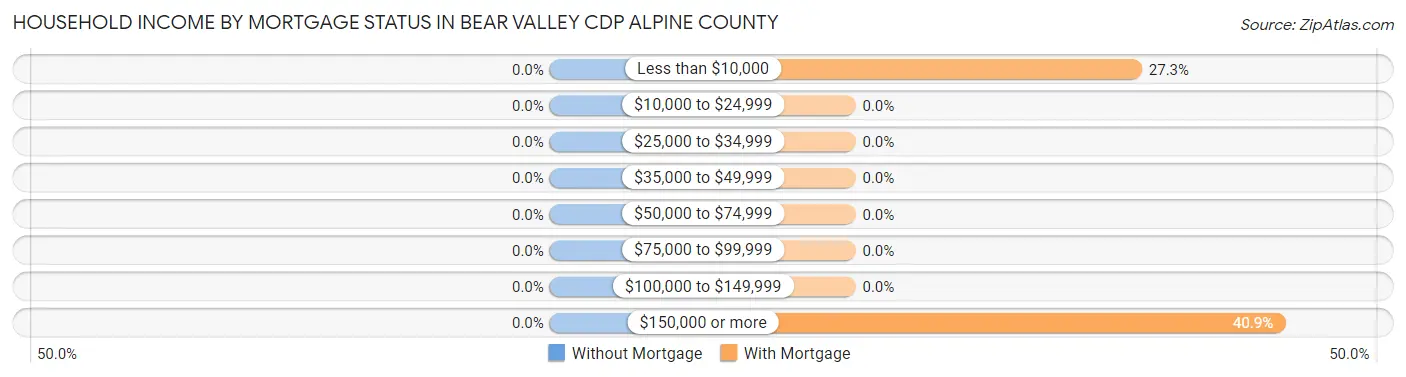
| Household Income | Without Mortgage | With Mortgage |
| Less than $10,000 | 0 (0.0%) | 6 (27.3%) |
| $10,000 to $24,999 | 0 (0.0%) | 0 (0.0%) |
| $25,000 to $34,999 | 0 (0.0%) | 0 (0.0%) |
| $35,000 to $49,999 | 0 (0.0%) | 0 (0.0%) |
| $50,000 to $74,999 | 0 (0.0%) | 0 (0.0%) |
| $75,000 to $99,999 | 0 (0.0%) | 0 (0.0%) |
| $100,000 to $149,999 | 0 (0.0%) | 0 (0.0%) |
| $150,000 or more | 0 (0.0%) | 9 (40.9%) |
| Total | 0 (0.0%) | 22 (100.0%) |
Property Value to Household Income Ratio in Bear Valley CDP Alpine County
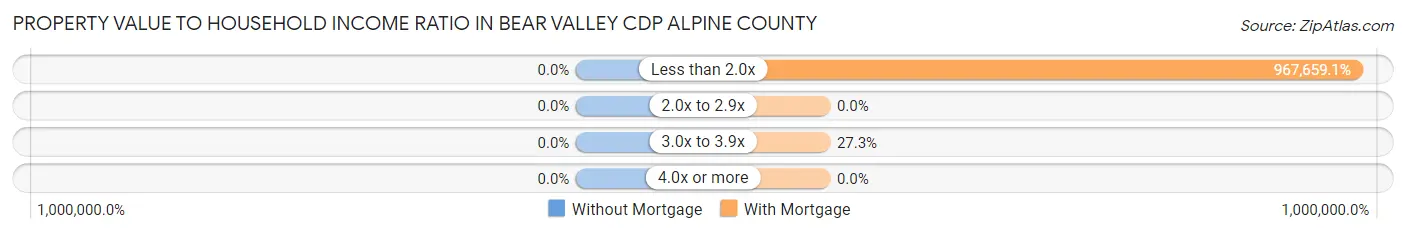
| Value-to-Income Ratio | Without Mortgage | With Mortgage |
| Less than 2.0x | 0 (0.0%) | 212,885 (967,659.1%) |
| 2.0x to 2.9x | 0 (0.0%) | 0 (0.0%) |
| 3.0x to 3.9x | 0 (0.0%) | 6 (27.3%) |
| 4.0x or more | 0 (0.0%) | 0 (0.0%) |
| Total | 0 (0.0%) | 22 (100.0%) |
Real Estate Taxes by Mortgage Status in Bear Valley CDP Alpine County
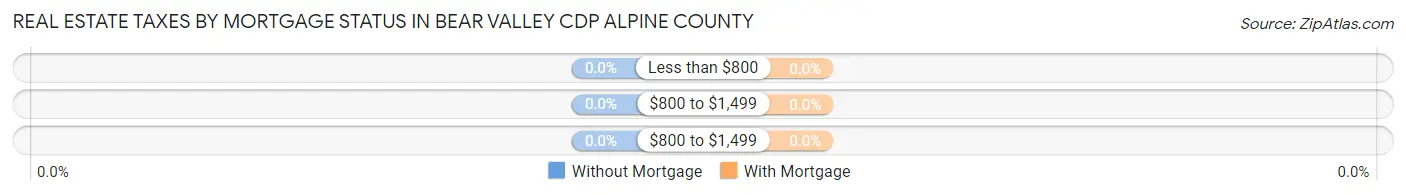
| Property Taxes | Without Mortgage | With Mortgage |
| Less than $800 | 0 (0.0%) | 0 (0.0%) |
| $800 to $1,499 | 0 (0.0%) | 0 (0.0%) |
| $800 to $1,499 | 0 (0.0%) | 0 (0.0%) |
| Total | 0 (0.0%) | 22 (100.0%) |
Health & Disability in Bear Valley CDP Alpine County
Health Insurance Coverage by Age in Bear Valley CDP Alpine County
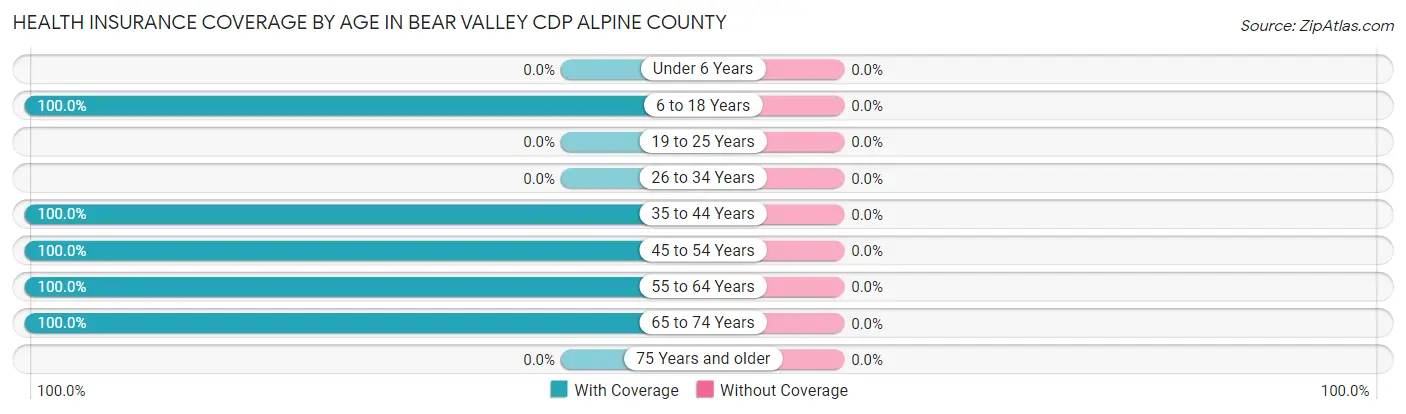
| Age Bracket | With Coverage | Without Coverage |
| Under 6 Years | 0 (0.0%) | 0 (0.0%) |
| 6 to 18 Years | 15 (100.0%) | 0 (0.0%) |
| 19 to 25 Years | 0 (0.0%) | 0 (0.0%) |
| 26 to 34 Years | 0 (0.0%) | 0 (0.0%) |
| 35 to 44 Years | 9 (100.0%) | 0 (0.0%) |
| 45 to 54 Years | 15 (100.0%) | 0 (0.0%) |
| 55 to 64 Years | 13 (100.0%) | 0 (0.0%) |
| 65 to 74 Years | 20 (100.0%) | 0 (0.0%) |
| 75 Years and older | 0 (0.0%) | 0 (0.0%) |
| Total | 72 (100.0%) | 0 (0.0%) |
Health Insurance Coverage by Citizenship Status in Bear Valley CDP Alpine County
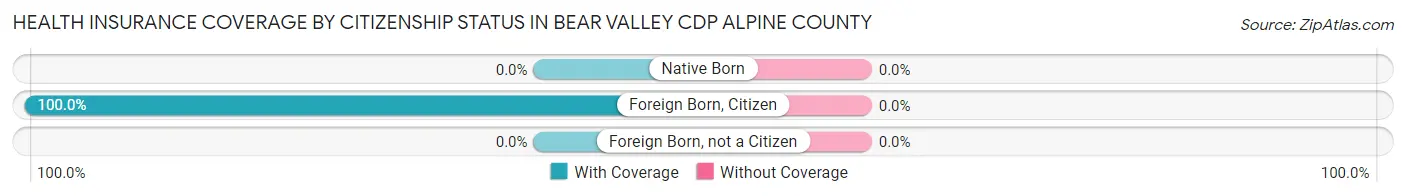
| Citizenship Status | With Coverage | Without Coverage |
| Native Born | 0 (0.0%) | 0 (0.0%) |
| Foreign Born, Citizen | 15 (100.0%) | 0 (0.0%) |
| Foreign Born, not a Citizen | 0 (0.0%) | 0 (0.0%) |
Health Insurance Coverage by Household Income in Bear Valley CDP Alpine County
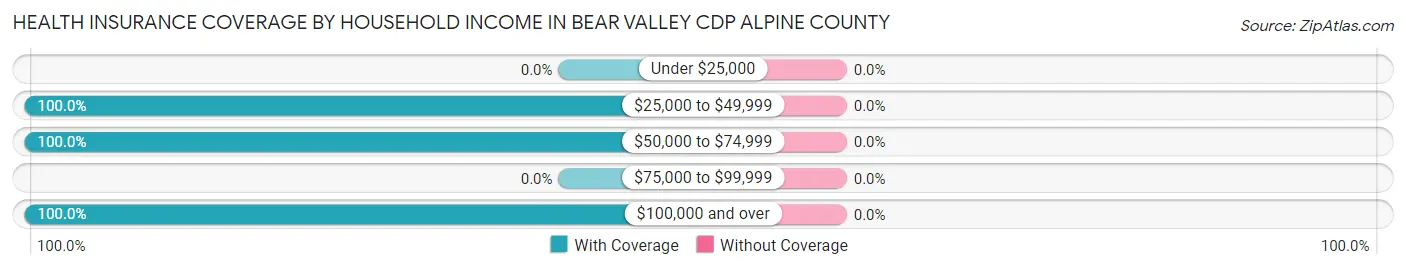
| Household Income | With Coverage | Without Coverage |
| Under $25,000 | 0 (0.0%) | 0 (0.0%) |
| $25,000 to $49,999 | 13 (100.0%) | 0 (0.0%) |
| $50,000 to $74,999 | 9 (100.0%) | 0 (0.0%) |
| $75,000 to $99,999 | 0 (0.0%) | 0 (0.0%) |
| $100,000 and over | 50 (100.0%) | 0 (0.0%) |
Public vs Private Health Insurance Coverage by Age in Bear Valley CDP Alpine County
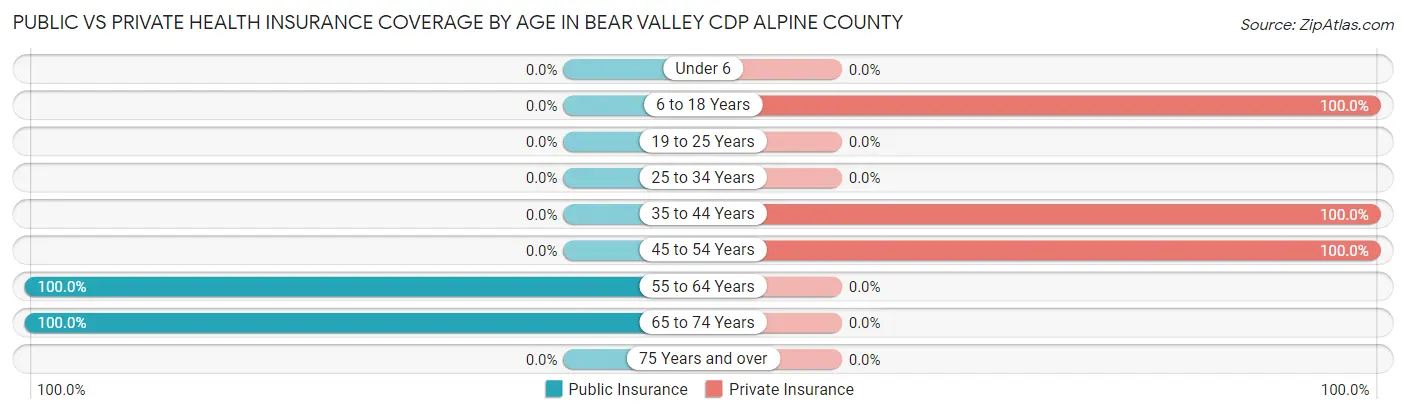
| Age Bracket | Public Insurance | Private Insurance |
| Under 6 | 0 (0.0%) | 0 (0.0%) |
| 6 to 18 Years | 0 (0.0%) | 15 (100.0%) |
| 19 to 25 Years | 0 (0.0%) | 0 (0.0%) |
| 25 to 34 Years | 0 (0.0%) | 0 (0.0%) |
| 35 to 44 Years | 0 (0.0%) | 9 (100.0%) |
| 45 to 54 Years | 0 (0.0%) | 15 (100.0%) |
| 55 to 64 Years | 13 (100.0%) | 0 (0.0%) |
| 65 to 74 Years | 20 (100.0%) | 0 (0.0%) |
| 75 Years and over | 0 (0.0%) | 0 (0.0%) |
| Total | 33 (45.8%) | 39 (54.2%) |
Disability Status by Sex by Age in Bear Valley CDP Alpine County
| Age Bracket | Male | Female |
| Under 5 Years | 0 (0.0%) | 0 (0.0%) |
| 5 to 17 Years | 0 (0.0%) | 0 (0.0%) |
| 18 to 34 Years | 0 (0.0%) | 0 (0.0%) |
| 35 to 64 Years | 0 (0.0%) | 0 (0.0%) |
| 65 to 74 Years | 0 (0.0%) | 0 (0.0%) |
| 75 Years and over | 0 (0.0%) | 0 (0.0%) |
Disability Class by Sex by Age in Bear Valley CDP Alpine County
Disability Class: Hearing Difficulty
| Age Bracket | Male | Female |
| Under 5 Years | 0 (0.0%) | 0 (0.0%) |
| 5 to 17 Years | 0 (0.0%) | 0 (0.0%) |
| 18 to 34 Years | 0 (0.0%) | 0 (0.0%) |
| 35 to 64 Years | 0 (0.0%) | 0 (0.0%) |
| 65 to 74 Years | 0 (0.0%) | 0 (0.0%) |
| 75 Years and over | 0 (0.0%) | 0 (0.0%) |
Disability Class: Vision Difficulty
| Age Bracket | Male | Female |
| Under 5 Years | 0 (0.0%) | 0 (0.0%) |
| 5 to 17 Years | 0 (0.0%) | 0 (0.0%) |
| 18 to 34 Years | 0 (0.0%) | 0 (0.0%) |
| 35 to 64 Years | 0 (0.0%) | 0 (0.0%) |
| 65 to 74 Years | 0 (0.0%) | 0 (0.0%) |
| 75 Years and over | 0 (0.0%) | 0 (0.0%) |
Disability Class: Cognitive Difficulty
| Age Bracket | Male | Female |
| 5 to 17 Years | 0 (0.0%) | 0 (0.0%) |
| 18 to 34 Years | 0 (0.0%) | 0 (0.0%) |
| 35 to 64 Years | 0 (0.0%) | 0 (0.0%) |
| 65 to 74 Years | 0 (0.0%) | 0 (0.0%) |
| 75 Years and over | 0 (0.0%) | 0 (0.0%) |
Disability Class: Ambulatory Difficulty
| Age Bracket | Male | Female |
| 5 to 17 Years | 0 (0.0%) | 0 (0.0%) |
| 18 to 34 Years | 0 (0.0%) | 0 (0.0%) |
| 35 to 64 Years | 0 (0.0%) | 0 (0.0%) |
| 65 to 74 Years | 0 (0.0%) | 0 (0.0%) |
| 75 Years and over | 0 (0.0%) | 0 (0.0%) |
Disability Class: Self-Care Difficulty
| Age Bracket | Male | Female |
| 5 to 17 Years | 0 (0.0%) | 0 (0.0%) |
| 18 to 34 Years | 0 (0.0%) | 0 (0.0%) |
| 35 to 64 Years | 0 (0.0%) | 0 (0.0%) |
| 65 to 74 Years | 0 (0.0%) | 0 (0.0%) |
| 75 Years and over | 0 (0.0%) | 0 (0.0%) |
Technology Access in Bear Valley CDP Alpine County
Computing Device Access in Bear Valley CDP Alpine County
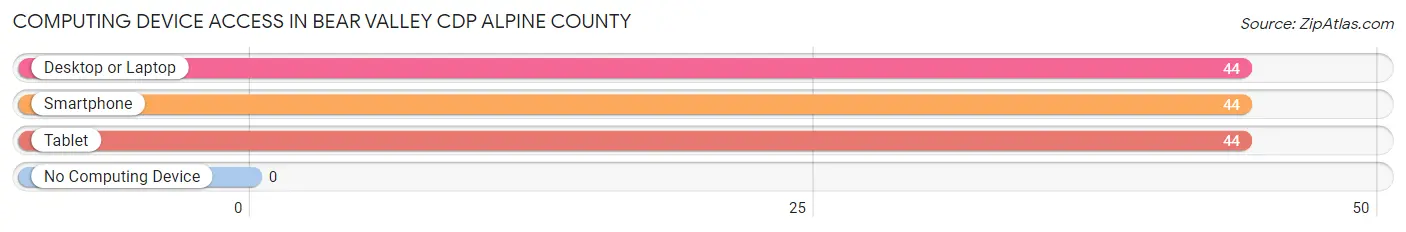
| Device Type | # Households | % Households |
| Desktop or Laptop | 44 | 100.0% |
| Smartphone | 44 | 100.0% |
| Tablet | 44 | 100.0% |
| No Computing Device | 0 | 0.0% |
| Total | 44 | 100.0% |
Internet Access in Bear Valley CDP Alpine County
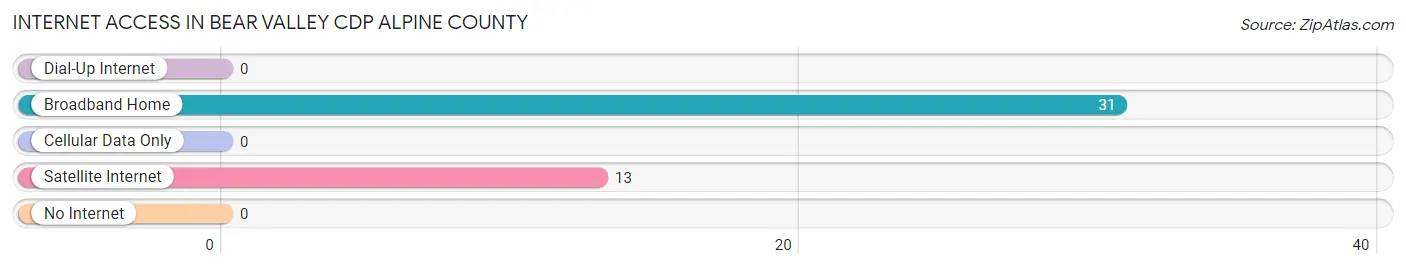
| Internet Type | # Households | % Households |
| Dial-Up Internet | 0 | 0.0% |
| Broadband Home | 31 | 70.5% |
| Cellular Data Only | 0 | 0.0% |
| Satellite Internet | 13 | 29.5% |
| No Internet | 0 | 0.0% |
| Total | 44 | 100.0% |
Bear Valley CDP Alpine County Summary
Introduction
Bear Valley Cdp is a census-designated place (CDP) located in Alpine County, California. It is located in the Sierra Nevada mountain range, and is part of the Lake Tahoe Basin. The population of Bear Valley Cdp was 545 at the 2010 census. The CDP is located in the eastern part of the county, and is bordered by the towns of Markleeville and Woodfords.
History
The area that is now Bear Valley Cdp was originally inhabited by the Washoe people, who were a Native American tribe that lived in the area for thousands of years. The first European settlers arrived in the area in the mid-1800s, and the area was officially established as a CDP in the 1950s.
The area was originally known as Bear Valley, and was a popular destination for miners and prospectors during the California Gold Rush. The area was also home to a number of logging camps, and the lumber industry was a major part of the local economy.
Geography
Bear Valley Cdp is located in the eastern part of Alpine County, and is bordered by the towns of Markleeville and Woodfords. The CDP has a total area of 4.3 square miles, all of which is land. The elevation of the CDP is 6,845 feet above sea level.
The area is located in the Sierra Nevada mountain range, and is part of the Lake Tahoe Basin. The area is known for its scenic beauty, and is a popular destination for outdoor recreation.
Economy
The economy of Bear Valley Cdp is largely based on tourism and outdoor recreation. The area is a popular destination for skiing, snowboarding, hiking, camping, and other outdoor activities. The area is also home to a number of resorts and lodges, which cater to tourists and outdoor enthusiasts.
The area is also home to a number of small businesses, including restaurants, shops, and other services. The local economy is also supported by the logging industry, which is still active in the area.
Demographics
As of the 2010 census, the population of Bear Valley Cdp was 545. The racial makeup of the CDP was 94.2% White, 0.7% African American, 0.2% Native American, 0.7% Asian, 0.2% Pacific Islander, and 3.8% from other races. The median household income was $45,000, and the median age was 44.
Conclusion
Bear Valley Cdp is a census-designated place located in Alpine County, California. The area is known for its scenic beauty, and is a popular destination for outdoor recreation. The economy of the CDP is largely based on tourism and outdoor recreation, and the area is also home to a number of small businesses. The population of Bear Valley Cdp was 545 at the 2010 census, and the median household income was $45,000.
Common Questions
What is Per Capita Income in Bear Valley CDP Alpine County?
Per Capita income in Bear Valley CDP Alpine County is $74,208.
What is Inequality or Gini Index in Bear Valley CDP Alpine County?
Inequality or Gini Index in Bear Valley CDP Alpine County is 0.37.
What is the Total Population of Bear Valley CDP Alpine County?
Total Population of Bear Valley CDP Alpine County is 72.
What is the Total Male Population of Bear Valley CDP Alpine County?
Total Male Population of Bear Valley CDP Alpine County is 48.
What is the Total Female Population of Bear Valley CDP Alpine County?
Total Female Population of Bear Valley CDP Alpine County is 24.
What is the Ratio of Males per 100 Females in Bear Valley CDP Alpine County?
There are 200.00 Males per 100 Females in Bear Valley CDP Alpine County.
What is the Ratio of Females per 100 Males in Bear Valley CDP Alpine County?
There are 50.00 Females per 100 Males in Bear Valley CDP Alpine County.
What is the Median Population Age in Bear Valley CDP Alpine County?
Median Population Age in Bear Valley CDP Alpine County is 53.7 Years.
What is the Average Family Size in Bear Valley CDP Alpine County
Average Family Size in Bear Valley CDP Alpine County is 4.1 People.
What is the Average Household Size in Bear Valley CDP Alpine County
Average Household Size in Bear Valley CDP Alpine County is 1.6 People.
How Large is the Labor Force in Bear Valley CDP Alpine County?
There are 59 People in the Labor Forcein in Bear Valley CDP Alpine County.
What is the Percentage of People in the Labor Force in Bear Valley CDP Alpine County?
89.4% of People are in the Labor Force in Bear Valley CDP Alpine County.
What is the Unemployment Rate in Bear Valley CDP Alpine County?
Unemployment Rate in Bear Valley CDP Alpine County is 22.0%.