Cities with the Highest Percentage of Population with a Degree in Engineering in California
RELATED REPORTS & OPTIONS
Engineering
California
Compare Cities
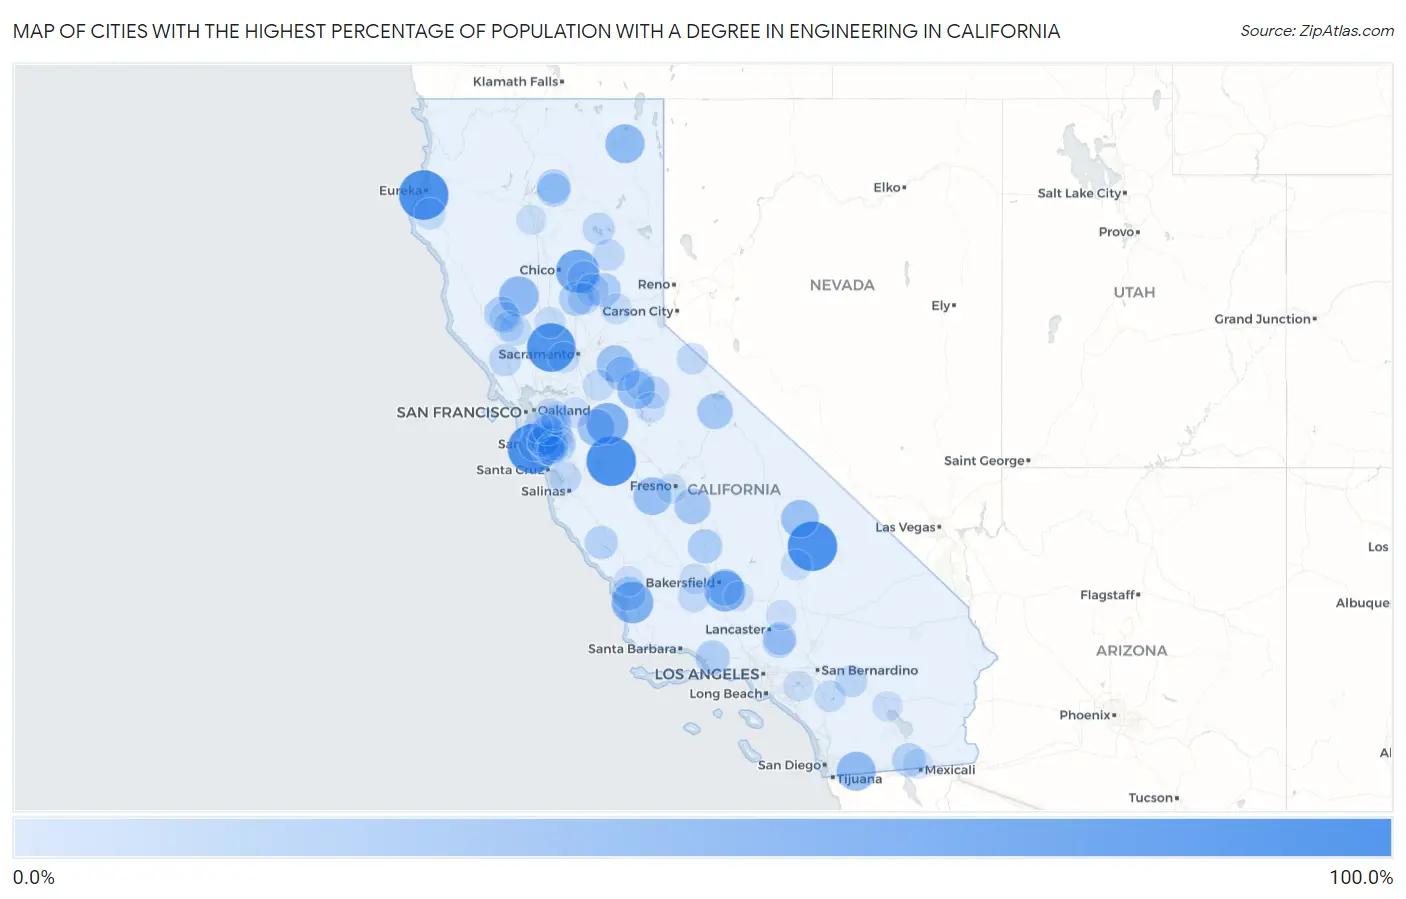
Map of Cities with the Highest Percentage of Population with a Degree in Engineering in California
0.0%
100.0%
Cities with the Highest Percentage of Population with a Degree in Engineering in California
| City | % Graduates | vs State | vs National | |
| 1. | Fields Landing | 100.0% | 9.9%(+90.1)#1 | 7.6%(+92.4)#6 |
| 2. | Volta | 100.0% | 9.9%(+90.1)#2 | 7.6%(+92.4)#15 |
| 3. | Homewood Canyon | 100.0% | 9.9%(+90.1)#3 | 7.6%(+92.4)#19 |
| 4. | Hypericum | 100.0% | 9.9%(+90.1)#4 | 7.6%(+92.4)#21 |
| 5. | Loma Mar | 100.0% | 9.9%(+90.1)#5 | 7.6%(+92.4)#36 |
| 6. | Madison | 95.7% | 9.9%(+85.7)#6 | 7.6%(+88.0)#61 |
| 7. | Yankee Hill | 72.7% | 9.9%(+62.8)#7 | 7.6%(+65.1)#78 |
| 8. | Parklawn | 66.7% | 9.9%(+56.7)#8 | 7.6%(+59.0)#87 |
| 9. | Los Berros | 66.7% | 9.9%(+56.7)#9 | 7.6%(+59.0)#92 |
| 10. | Weedpatch | 62.5% | 9.9%(+52.6)#10 | 7.6%(+54.9)#110 |
| 11. | Stonyford | 58.8% | 9.9%(+48.9)#11 | 7.6%(+51.2)#129 |
| 12. | Potrero | 56.2% | 9.9%(+46.3)#12 | 7.6%(+48.5)#136 |
| 13. | California Pines | 56.0% | 9.9%(+46.1)#13 | 7.6%(+48.4)#137 |
| 14. | San Joaquin | 51.0% | 9.9%(+41.1)#14 | 7.6%(+43.4)#159 |
| 15. | Vallecito | 50.0% | 9.9%(+40.1)#15 | 7.6%(+42.4)#167 |
| 16. | Darwin | 50.0% | 9.9%(+40.1)#16 | 7.6%(+42.4)#172 |
| 17. | Rivergrove | 50.0% | 9.9%(+40.1)#17 | 7.6%(+42.4)#173 |
| 18. | Grayson | 47.7% | 9.9%(+37.8)#18 | 7.6%(+40.1)#193 |
| 19. | Drytown | 47.4% | 9.9%(+37.4)#19 | 7.6%(+39.7)#194 |
| 20. | Fuller Acres | 46.2% | 9.9%(+36.2)#20 | 7.6%(+38.5)#206 |
| 21. | Goodmanville | 45.5% | 9.9%(+35.5)#21 | 7.6%(+37.8)#213 |
| 22. | Traver | 42.9% | 9.9%(+32.9)#22 | 7.6%(+35.2)#232 |
| 23. | June Lake | 42.0% | 9.9%(+32.1)#23 | 7.6%(+34.4)#244 |
| 24. | Mokelumne Hill | 38.7% | 9.9%(+28.7)#24 | 7.6%(+31.0)#285 |
| 25. | Earlimart | 36.9% | 9.9%(+27.0)#25 | 7.6%(+29.2)#305 |
| 26. | Honcut | 36.8% | 9.9%(+26.9)#26 | 7.6%(+29.2)#306 |
| 27. | Camptonville | 36.0% | 9.9%(+26.1)#27 | 7.6%(+28.4)#323 |
| 28. | Nice | 35.9% | 9.9%(+26.0)#28 | 7.6%(+28.3)#324 |
| 29. | Saticoy | 35.5% | 9.9%(+25.6)#29 | 7.6%(+27.9)#327 |
| 30. | Edna | 34.5% | 9.9%(+24.6)#30 | 7.6%(+26.9)#340 |
| 31. | Montgomery Creek | 34.3% | 9.9%(+24.4)#31 | 7.6%(+26.7)#347 |
| 32. | Seeley | 34.0% | 9.9%(+24.1)#32 | 7.6%(+26.4)#350 |
| 33. | Round Mountain | 33.3% | 9.9%(+23.4)#33 | 7.6%(+25.7)#373 |
| 34. | Littlerock | 32.1% | 9.9%(+22.2)#34 | 7.6%(+24.4)#394 |
| 35. | Mountain Meadows | 32.0% | 9.9%(+22.1)#35 | 7.6%(+24.4)#396 |
| 36. | Lockwood | 32.0% | 9.9%(+22.1)#36 | 7.6%(+24.4)#397 |
| 37. | Cupertino | 31.8% | 9.9%(+21.9)#37 | 7.6%(+24.2)#399 |
| 38. | Milpitas | 31.3% | 9.9%(+21.4)#38 | 7.6%(+23.7)#407 |
| 39. | Sun Village | 31.0% | 9.9%(+21.0)#39 | 7.6%(+23.3)#416 |
| 40. | Berry Creek | 30.8% | 9.9%(+20.8)#40 | 7.6%(+23.1)#420 |
| 41. | Sunnyvale | 30.5% | 9.9%(+20.6)#41 | 7.6%(+22.9)#427 |
| 42. | Johnson Park | 30.4% | 9.9%(+20.5)#42 | 7.6%(+22.8)#428 |
| 43. | Challenge Brownsville | 29.2% | 9.9%(+19.2)#43 | 7.6%(+21.5)#469 |
| 44. | Saratoga | 29.1% | 9.9%(+19.2)#44 | 7.6%(+21.4)#472 |
| 45. | Lake Almanor Peninsula | 28.6% | 9.9%(+18.6)#45 | 7.6%(+20.9)#486 |
| 46. | Santa Clara | 28.4% | 9.9%(+18.5)#46 | 7.6%(+20.8)#503 |
| 47. | Amador Pines | 28.3% | 9.9%(+18.4)#47 | 7.6%(+20.7)#510 |
| 48. | La Honda | 28.3% | 9.9%(+18.4)#48 | 7.6%(+20.7)#514 |
| 49. | Mi Wuk Village | 28.1% | 9.9%(+18.1)#49 | 7.6%(+20.4)#522 |
| 50. | Fulton | 27.9% | 9.9%(+18.0)#50 | 7.6%(+20.2)#526 |
| 51. | San Miguel Cdp San Luis Obispo County | 27.7% | 9.9%(+17.8)#51 | 7.6%(+20.1)#531 |
| 52. | Whitewater | 27.6% | 9.9%(+17.6)#52 | 7.6%(+19.9)#538 |
| 53. | Loma Rica | 27.4% | 9.9%(+17.5)#53 | 7.6%(+19.8)#539 |
| 54. | Williams Canyon | 27.3% | 9.9%(+17.3)#54 | 7.6%(+19.6)#553 |
| 55. | Las Lomas | 26.9% | 9.9%(+17.0)#55 | 7.6%(+19.3)#560 |
| 56. | Quincy | 26.8% | 9.9%(+16.9)#56 | 7.6%(+19.2)#567 |
| 57. | Ford City | 26.8% | 9.9%(+16.9)#57 | 7.6%(+19.2)#570 |
| 58. | Loyola | 26.5% | 9.9%(+16.5)#58 | 7.6%(+18.8)#578 |
| 59. | Lower Lake | 26.0% | 9.9%(+16.0)#59 | 7.6%(+18.3)#600 |
| 60. | Walker | 25.7% | 9.9%(+15.8)#60 | 7.6%(+18.0)#613 |
| 61. | Scotia | 25.6% | 9.9%(+15.7)#61 | 7.6%(+18.0)#618 |
| 62. | Green Acres | 25.5% | 9.9%(+15.6)#62 | 7.6%(+17.8)#623 |
| 63. | Lucerne | 25.0% | 9.9%(+15.1)#63 | 7.6%(+17.4)#639 |
| 64. | Los Altos | 24.7% | 9.9%(+14.8)#64 | 7.6%(+17.0)#689 |
| 65. | West Menlo Park | 24.6% | 9.9%(+14.7)#65 | 7.6%(+17.0)#691 |
| 66. | Mountain View | 24.6% | 9.9%(+14.6)#66 | 7.6%(+16.9)#693 |
| 67. | Lockeford | 24.4% | 9.9%(+14.5)#67 | 7.6%(+16.8)#699 |
| 68. | Los Altos Hills | 24.2% | 9.9%(+14.3)#68 | 7.6%(+16.6)#705 |
| 69. | University Of California Davis | 24.1% | 9.9%(+14.2)#69 | 7.6%(+16.5)#711 |
| 70. | Sunol | 24.0% | 9.9%(+14.1)#70 | 7.6%(+16.4)#718 |
| 71. | Alum Rock | 23.9% | 9.9%(+14.0)#71 | 7.6%(+16.3)#724 |
| 72. | Fremont | 23.9% | 9.9%(+14.0)#72 | 7.6%(+16.2)#728 |
| 73. | College City | 23.5% | 9.9%(+13.6)#73 | 7.6%(+15.9)#749 |
| 74. | Dutch Flat | 23.5% | 9.9%(+13.6)#74 | 7.6%(+15.9)#751 |
| 75. | Ridgecrest | 23.4% | 9.9%(+13.5)#75 | 7.6%(+15.8)#755 |
| 76. | Forest Meadows | 23.1% | 9.9%(+13.1)#76 | 7.6%(+15.4)#780 |
| 77. | Buttonwillow | 22.7% | 9.9%(+12.8)#77 | 7.6%(+15.1)#789 |
| 78. | Campbell | 22.5% | 9.9%(+12.6)#78 | 7.6%(+14.8)#809 |
| 79. | San Jose | 22.3% | 9.9%(+12.4)#79 | 7.6%(+14.7)#819 |
| 80. | Cedar Flat | 22.2% | 9.9%(+12.2)#80 | 7.6%(+14.5)#849 |
| 81. | Trabuco Canyon | 21.9% | 9.9%(+12.0)#81 | 7.6%(+14.3)#857 |
| 82. | Norris Canyon | 21.7% | 9.9%(+11.8)#82 | 7.6%(+14.1)#874 |
| 83. | Fruitdale | 21.4% | 9.9%(+11.5)#83 | 7.6%(+13.8)#906 |
| 84. | Mecca | 21.2% | 9.9%(+11.3)#84 | 7.6%(+13.5)#926 |
| 85. | Pleasanton | 21.1% | 9.9%(+11.2)#85 | 7.6%(+13.4)#932 |
| 86. | Mountain House | 21.0% | 9.9%(+11.1)#86 | 7.6%(+13.4)#942 |
| 87. | Coronita | 21.0% | 9.9%(+11.1)#87 | 7.6%(+13.3)#949 |
| 88. | Edwards Afb | 20.9% | 9.9%(+11.0)#88 | 7.6%(+13.2)#962 |
| 89. | Groveland | 20.9% | 9.9%(+11.0)#89 | 7.6%(+13.2)#963 |
| 90. | Newark | 20.8% | 9.9%(+10.9)#90 | 7.6%(+13.2)#967 |
| 91. | Dublin | 20.8% | 9.9%(+10.8)#91 | 7.6%(+13.1)#979 |
| 92. | Santa Margarita | 20.7% | 9.9%(+10.8)#92 | 7.6%(+13.1)#980 |
| 93. | Clearlake Riviera | 20.6% | 9.9%(+10.7)#93 | 7.6%(+13.0)#989 |
| 94. | Cottonwood | 20.6% | 9.9%(+10.7)#94 | 7.6%(+13.0)#990 |
| 95. | West Park | 20.5% | 9.9%(+10.6)#95 | 7.6%(+12.8)#994 |
| 96. | Monte Sereno | 20.2% | 9.9%(+10.3)#96 | 7.6%(+12.6)#1,015 |
| 97. | Heber | 20.0% | 9.9%(+10.1)#97 | 7.6%(+12.3)#1,076 |
| 98. | Foster City | 19.9% | 9.9%(+10.00)#98 | 7.6%(+12.3)#1,078 |
| 99. | Los Gatos | 19.8% | 9.9%(+9.92)#99 | 7.6%(+12.2)#1,085 |
| 100. | Bear Valley Springs | 19.7% | 9.9%(+9.73)#100 | 7.6%(+12.0)#1,098 |
Common Questions
What are the Top 10 Cities with the Highest Percentage of Population with a Degree in Engineering in California?
Top 10 Cities with the Highest Percentage of Population with a Degree in Engineering in California are:
#1
100.0%
#2
100.0%
#3
100.0%
#4
100.0%
#5
95.7%
#6
72.7%
#7
66.7%
#8
66.7%
#9
62.5%
#10
58.8%
What city has the Highest Percentage of Population with a Degree in Engineering in California?
Fields Landing has the Highest Percentage of Population with a Degree in Engineering in California with 100.0%.
What is the Percentage of Population with a Degree in Engineering in the State of California?
Percentage of Population with a Degree in Engineering in California is 9.9%.
What is the Percentage of Population with a Degree in Engineering in the United States?
Percentage of Population with a Degree in Engineering in the United States is 7.6%.