Cities with the Most Immigrants from Saudi Arabia in California
RELATED REPORTS & OPTIONS
Saudi Arabia
California
Compare Cities
Map of Cities with the Most Immigrants from Saudi Arabia in California
0
1,000
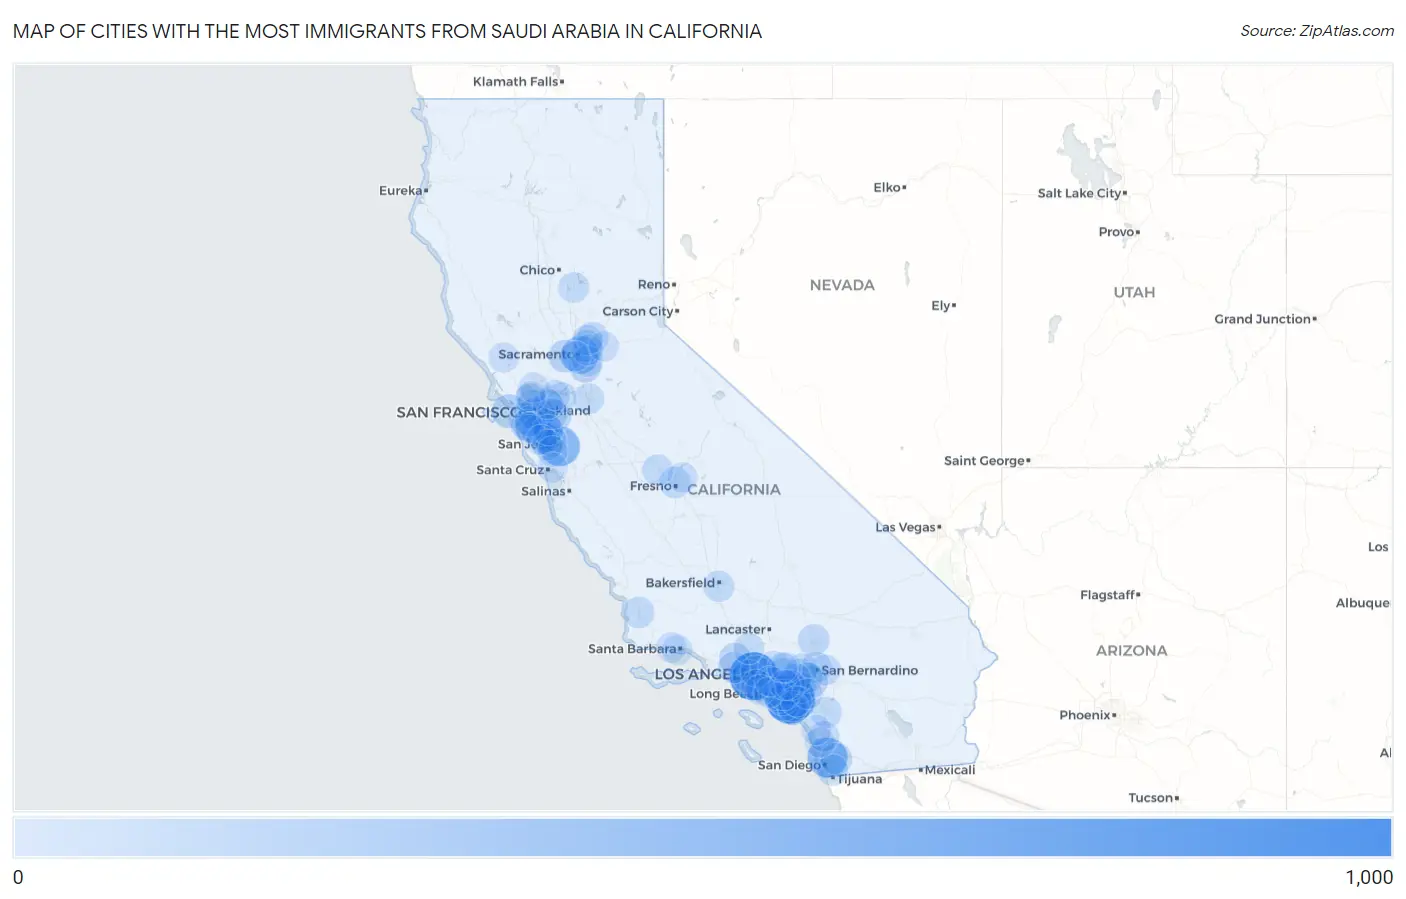
Cities with the Most Immigrants from Saudi Arabia in California
| City | Saudi Arabia | vs State | vs National | |
| 1. | Irvine | 805 | 7,408(10.87%)#1 | 65,497(1.23%)#4 |
| 2. | Los Angeles | 749 | 7,408(10.11%)#2 | 65,497(1.14%)#5 |
| 3. | San Diego | 403 | 7,408(5.44%)#3 | 65,497(0.62%)#19 |
| 4. | San Jose | 403 | 7,408(5.44%)#4 | 65,497(0.62%)#20 |
| 5. | Sacramento | 307 | 7,408(4.14%)#5 | 65,497(0.47%)#23 |
| 6. | Anaheim | 259 | 7,408(3.50%)#6 | 65,497(0.40%)#30 |
| 7. | Oakland | 189 | 7,408(2.55%)#7 | 65,497(0.29%)#60 |
| 8. | Foster City | 159 | 7,408(2.15%)#8 | 65,497(0.24%)#77 |
| 9. | San Francisco | 154 | 7,408(2.08%)#9 | 65,497(0.24%)#82 |
| 10. | Santa Monica | 126 | 7,408(1.70%)#10 | 65,497(0.19%)#107 |
| 11. | Dublin | 110 | 7,408(1.48%)#11 | 65,497(0.17%)#128 |
| 12. | Riverside | 109 | 7,408(1.47%)#12 | 65,497(0.17%)#129 |
| 13. | Elk Grove | 108 | 7,408(1.46%)#13 | 65,497(0.16%)#130 |
| 14. | Sunnyvale | 108 | 7,408(1.46%)#14 | 65,497(0.16%)#131 |
| 15. | Ontario | 107 | 7,408(1.44%)#15 | 65,497(0.16%)#133 |
| 16. | Davis | 106 | 7,408(1.43%)#16 | 65,497(0.16%)#135 |
| 17. | Laguna Beach | 91 | 7,408(1.23%)#17 | 65,497(0.14%)#154 |
| 18. | Foothill Farms | 87 | 7,408(1.17%)#18 | 65,497(0.13%)#161 |
| 19. | Simi Valley | 76 | 7,408(1.03%)#19 | 65,497(0.12%)#186 |
| 20. | El Cajon | 74 | 7,408(1.00%)#20 | 65,497(0.11%)#193 |
| 21. | Daly City | 73 | 7,408(0.99%)#21 | 65,497(0.11%)#195 |
| 22. | Agoura Hills | 69 | 7,408(0.93%)#22 | 65,497(0.11%)#203 |
| 23. | Victorville | 61 | 7,408(0.82%)#23 | 65,497(0.09%)#242 |
| 24. | Rancho Santa Margarita | 61 | 7,408(0.82%)#24 | 65,497(0.09%)#243 |
| 25. | Fresno | 60 | 7,408(0.81%)#25 | 65,497(0.09%)#244 |
| 26. | Santa Maria | 60 | 7,408(0.81%)#26 | 65,497(0.09%)#245 |
| 27. | West Hollywood | 58 | 7,408(0.78%)#27 | 65,497(0.09%)#253 |
| 28. | Chula Vista | 56 | 7,408(0.76%)#28 | 65,497(0.09%)#259 |
| 29. | Santa Clara | 56 | 7,408(0.76%)#29 | 65,497(0.09%)#263 |
| 30. | Newport Beach | 55 | 7,408(0.74%)#30 | 65,497(0.08%)#268 |
| 31. | Hayward | 52 | 7,408(0.70%)#31 | 65,497(0.08%)#278 |
| 32. | Madera | 52 | 7,408(0.70%)#32 | 65,497(0.08%)#279 |
| 33. | Bakersfield | 51 | 7,408(0.69%)#33 | 65,497(0.08%)#287 |
| 34. | Rocklin | 51 | 7,408(0.69%)#34 | 65,497(0.08%)#289 |
| 35. | San Bernardino | 48 | 7,408(0.65%)#35 | 65,497(0.07%)#300 |
| 36. | Temecula | 48 | 7,408(0.65%)#36 | 65,497(0.07%)#301 |
| 37. | Mountain View | 47 | 7,408(0.63%)#37 | 65,497(0.07%)#305 |
| 38. | Berkeley | 46 | 7,408(0.62%)#38 | 65,497(0.07%)#309 |
| 39. | Vineyard | 46 | 7,408(0.62%)#39 | 65,497(0.07%)#312 |
| 40. | Redwood City | 43 | 7,408(0.58%)#40 | 65,497(0.07%)#329 |
| 41. | Alameda | 43 | 7,408(0.58%)#41 | 65,497(0.07%)#330 |
| 42. | Highland | 43 | 7,408(0.58%)#42 | 65,497(0.07%)#332 |
| 43. | Orange | 42 | 7,408(0.57%)#43 | 65,497(0.06%)#339 |
| 44. | San Marcos | 41 | 7,408(0.55%)#44 | 65,497(0.06%)#349 |
| 45. | Carmichael | 41 | 7,408(0.55%)#45 | 65,497(0.06%)#350 |
| 46. | Stockton | 40 | 7,408(0.54%)#46 | 65,497(0.06%)#353 |
| 47. | San Mateo | 40 | 7,408(0.54%)#47 | 65,497(0.06%)#355 |
| 48. | Alamo | 40 | 7,408(0.54%)#48 | 65,497(0.06%)#361 |
| 49. | Antioch | 39 | 7,408(0.53%)#49 | 65,497(0.06%)#363 |
| 50. | Oroville | 38 | 7,408(0.51%)#50 | 65,497(0.06%)#373 |
| 51. | Santa Clarita | 37 | 7,408(0.50%)#51 | 65,497(0.06%)#376 |
| 52. | Rancho Cucamonga | 35 | 7,408(0.47%)#52 | 65,497(0.05%)#389 |
| 53. | Sierra Madre | 34 | 7,408(0.46%)#53 | 65,497(0.05%)#398 |
| 54. | West Covina | 33 | 7,408(0.45%)#54 | 65,497(0.05%)#401 |
| 55. | Fremont | 31 | 7,408(0.42%)#55 | 65,497(0.05%)#418 |
| 56. | Westminster | 30 | 7,408(0.40%)#56 | 65,497(0.05%)#425 |
| 57. | Laguna Niguel | 29 | 7,408(0.39%)#57 | 65,497(0.04%)#433 |
| 58. | Newark | 29 | 7,408(0.39%)#58 | 65,497(0.04%)#436 |
| 59. | Millbrae | 29 | 7,408(0.39%)#59 | 65,497(0.04%)#441 |
| 60. | South San Francisco | 28 | 7,408(0.38%)#60 | 65,497(0.04%)#445 |
| 61. | Fountain Valley | 28 | 7,408(0.38%)#61 | 65,497(0.04%)#447 |
| 62. | Corona | 27 | 7,408(0.36%)#62 | 65,497(0.04%)#453 |
| 63. | Santa Fe Springs | 27 | 7,408(0.36%)#63 | 65,497(0.04%)#461 |
| 64. | Richmond | 26 | 7,408(0.35%)#64 | 65,497(0.04%)#468 |
| 65. | San Ramon | 26 | 7,408(0.35%)#65 | 65,497(0.04%)#470 |
| 66. | Jurupa Valley | 25 | 7,408(0.34%)#66 | 65,497(0.04%)#483 |
| 67. | Walnut Creek | 25 | 7,408(0.34%)#67 | 65,497(0.04%)#485 |
| 68. | Roseville | 24 | 7,408(0.32%)#68 | 65,497(0.04%)#493 |
| 69. | Costa Mesa | 24 | 7,408(0.32%)#69 | 65,497(0.04%)#494 |
| 70. | Chino | 21 | 7,408(0.28%)#70 | 65,497(0.03%)#532 |
| 71. | Cupertino | 21 | 7,408(0.28%)#71 | 65,497(0.03%)#536 |
| 72. | Aliso Viejo | 21 | 7,408(0.28%)#72 | 65,497(0.03%)#537 |
| 73. | Lawndale | 21 | 7,408(0.28%)#73 | 65,497(0.03%)#539 |
| 74. | Santa Ana | 20 | 7,408(0.27%)#74 | 65,497(0.03%)#546 |
| 75. | Clovis | 20 | 7,408(0.27%)#75 | 65,497(0.03%)#548 |
| 76. | West Sacramento | 20 | 7,408(0.27%)#76 | 65,497(0.03%)#549 |
| 77. | Las Flores Cdp Orange County | 20 | 7,408(0.27%)#77 | 65,497(0.03%)#562 |
| 78. | Silverado | 20 | 7,408(0.27%)#78 | 65,497(0.03%)#563 |
| 79. | Vallejo | 19 | 7,408(0.26%)#79 | 65,497(0.03%)#564 |
| 80. | Santa Barbara | 19 | 7,408(0.26%)#80 | 65,497(0.03%)#565 |
| 81. | El Dorado Hills | 19 | 7,408(0.26%)#81 | 65,497(0.03%)#567 |
| 82. | Hillsborough | 19 | 7,408(0.26%)#82 | 65,497(0.03%)#577 |
| 83. | Palo Alto | 18 | 7,408(0.24%)#83 | 65,497(0.03%)#586 |
| 84. | West Carson | 18 | 7,408(0.24%)#84 | 65,497(0.03%)#591 |
| 85. | Long Beach | 17 | 7,408(0.23%)#85 | 65,497(0.03%)#595 |
| 86. | Downey | 17 | 7,408(0.23%)#86 | 65,497(0.03%)#596 |
| 87. | Yorba Linda | 17 | 7,408(0.23%)#87 | 65,497(0.03%)#598 |
| 88. | Encinitas | 17 | 7,408(0.23%)#88 | 65,497(0.03%)#601 |
| 89. | Temescal Valley | 17 | 7,408(0.23%)#89 | 65,497(0.03%)#605 |
| 90. | Windsor | 17 | 7,408(0.23%)#90 | 65,497(0.03%)#606 |
| 91. | Lake Forest | 16 | 7,408(0.22%)#91 | 65,497(0.02%)#619 |
| 92. | Pittsburg | 16 | 7,408(0.22%)#92 | 65,497(0.02%)#621 |
| 93. | Placentia | 16 | 7,408(0.22%)#93 | 65,497(0.02%)#622 |
| 94. | Los Gatos | 16 | 7,408(0.22%)#94 | 65,497(0.02%)#629 |
| 95. | Goleta | 16 | 7,408(0.22%)#95 | 65,497(0.02%)#630 |
| 96. | Soquel | 16 | 7,408(0.22%)#96 | 65,497(0.02%)#639 |
| 97. | Montalvin Manor | 13 | 7,408(0.18%)#97 | 65,497(0.02%)#694 |
| 98. | Oceanside | 11 | 7,408(0.15%)#98 | 65,497(0.02%)#712 |
| 99. | Glendora | 11 | 7,408(0.15%)#99 | 65,497(0.02%)#720 |
| 100. | Azusa | 11 | 7,408(0.15%)#100 | 65,497(0.02%)#721 |
Common Questions
What are the Top 10 Cities with the Most Immigrants from Saudi Arabia in California?
Top 10 Cities with the Most Immigrants from Saudi Arabia in California are:
#1
805
#2
749
#3
403
#4
403
#5
307
#6
259
#7
189
#8
159
#9
154
#10
126
What city has the Most Immigrants from Saudi Arabia in California?
Irvine has the Most Immigrants from Saudi Arabia in California with 805.
What is the Total Immigrants from Saudi Arabia in the State of California?
Total Immigrants from Saudi Arabia in California is 7,408.
What is the Total Immigrants from Saudi Arabia in the United States?
Total Immigrants from Saudi Arabia in the United States is 65,497.