Cities with the Highest Percentage of Population Employed in Installation, Maintenance & Repair in Iowa
RELATED REPORTS & OPTIONS
Installation, Maintenance & Repair
Iowa
Compare Cities
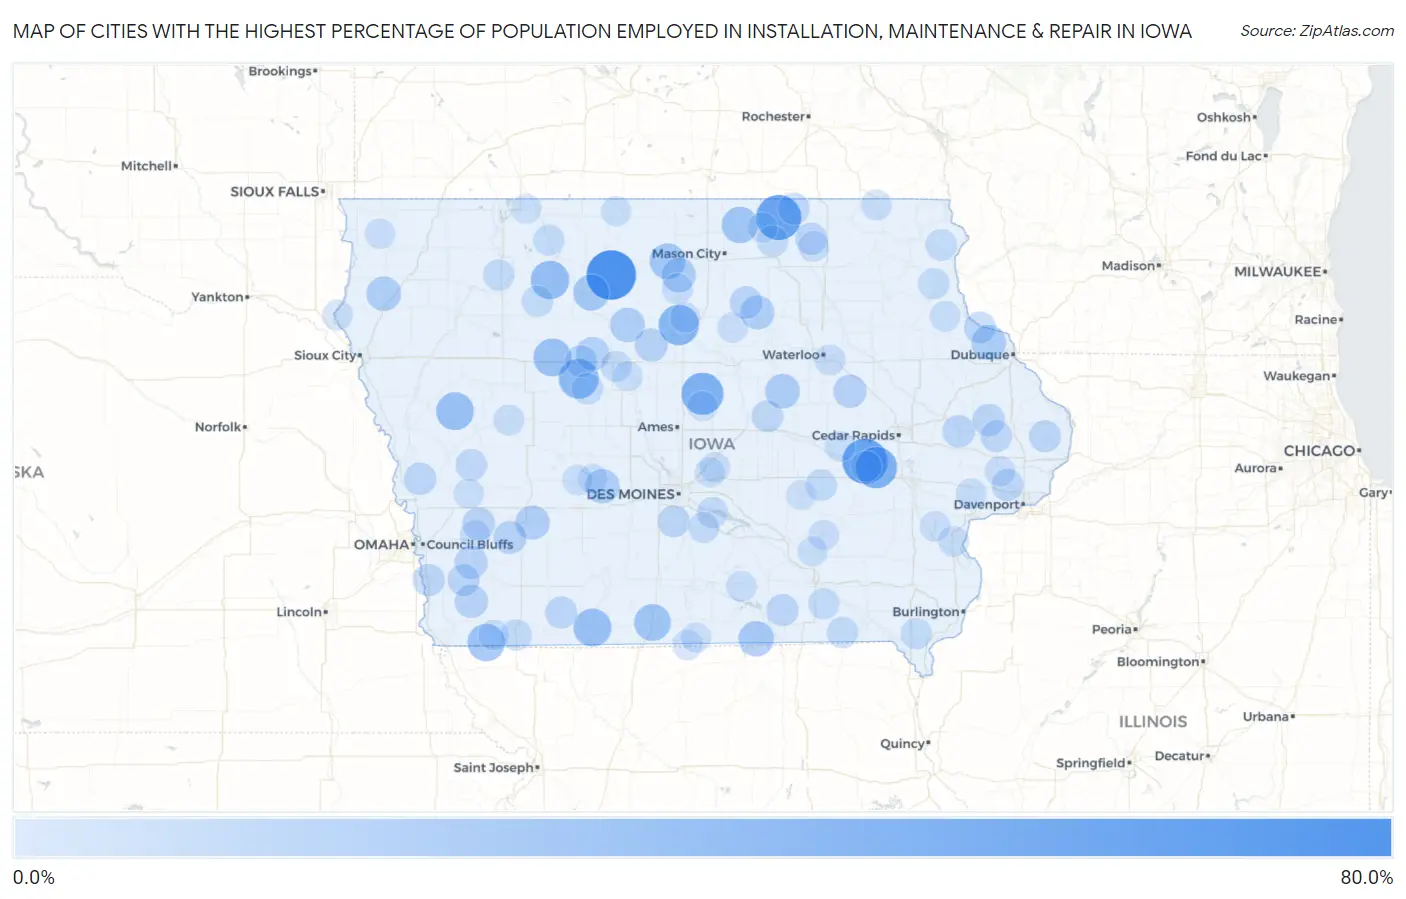
Map of Cities with the Highest Percentage of Population Employed in Installation, Maintenance & Repair in Iowa
0.0%
80.0%
Cities with the Highest Percentage of Population Employed in Installation, Maintenance & Repair in Iowa
| City | % Employed | vs State | vs National | |
| 1. | Irvington | 60.6% | 3.5%(+57.1)#1 | 3.1%(+57.5)#42 |
| 2. | West Amana | 48.8% | 3.5%(+45.4)#2 | 3.1%(+45.8)#86 |
| 3. | Little Cedar | 48.7% | 3.5%(+45.3)#3 | 3.1%(+45.7)#87 |
| 4. | Garden City | 40.4% | 3.5%(+36.9)#4 | 3.1%(+37.3)#140 |
| 5. | Homestead | 39.3% | 3.5%(+35.8)#5 | 3.1%(+36.2)#152 |
| 6. | Galt | 36.4% | 3.5%(+32.9)#6 | 3.1%(+33.3)#185 |
| 7. | Rinard | 34.8% | 3.5%(+31.3)#7 | 3.1%(+31.7)#204 |
| 8. | Curlew | 31.2% | 3.5%(+27.8)#8 | 3.1%(+28.2)#262 |
| 9. | Jolley | 30.0% | 3.5%(+26.5)#9 | 3.1%(+26.9)#283 |
| 10. | Benton | 30.0% | 3.5%(+26.5)#10 | 3.1%(+26.9)#284 |
| 11. | Ricketts | 29.4% | 3.5%(+25.9)#11 | 3.1%(+26.3)#295 |
| 12. | Northboro | 28.8% | 3.5%(+25.3)#12 | 3.1%(+25.7)#311 |
| 13. | Decatur City | 26.8% | 3.5%(+23.3)#13 | 3.1%(+23.7)#360 |
| 14. | Grafton | 26.2% | 3.5%(+22.7)#14 | 3.1%(+23.1)#377 |
| 15. | Duncan | 25.0% | 3.5%(+21.5)#15 | 3.1%(+21.9)#418 |
| 16. | Ottosen | 25.0% | 3.5%(+21.5)#16 | 3.1%(+21.9)#426 |
| 17. | Cincinnati | 23.5% | 3.5%(+20.1)#17 | 3.1%(+20.5)#478 |
| 18. | Lincoln | 21.8% | 3.5%(+18.4)#18 | 3.1%(+18.8)#549 |
| 19. | Rickardsville | 21.8% | 3.5%(+18.3)#19 | 3.1%(+18.7)#553 |
| 20. | Struble | 21.6% | 3.5%(+18.1)#20 | 3.1%(+18.5)#566 |
| 21. | Klemme | 21.5% | 3.5%(+18.0)#21 | 3.1%(+18.4)#571 |
| 22. | Thor | 21.3% | 3.5%(+17.9)#22 | 3.1%(+18.3)#584 |
| 23. | Linden | 21.1% | 3.5%(+17.6)#23 | 3.1%(+18.0)#598 |
| 24. | Wiota | 20.6% | 3.5%(+17.1)#24 | 3.1%(+17.5)#631 |
| 25. | Bristow | 20.0% | 3.5%(+16.5)#25 | 3.1%(+16.9)#672 |
| 26. | Barnum | 19.4% | 3.5%(+15.9)#26 | 3.1%(+16.3)#708 |
| 27. | Imogene | 18.2% | 3.5%(+14.7)#27 | 3.1%(+15.1)#803 |
| 28. | Mount Auburn | 18.1% | 3.5%(+14.6)#28 | 3.1%(+15.0)#817 |
| 29. | Woolstock | 18.0% | 3.5%(+14.5)#29 | 3.1%(+14.9)#823 |
| 30. | Lewis | 17.6% | 3.5%(+14.1)#30 | 3.1%(+14.5)#854 |
| 31. | Henderson | 17.4% | 3.5%(+13.9)#31 | 3.1%(+14.3)#865 |
| 32. | Hancock | 16.8% | 3.5%(+13.3)#32 | 3.1%(+13.7)#925 |
| 33. | Aredale | 16.7% | 3.5%(+13.2)#33 | 3.1%(+13.6)#949 |
| 34. | Olin | 16.4% | 3.5%(+12.9)#34 | 3.1%(+13.3)#982 |
| 35. | Magnolia | 16.2% | 3.5%(+12.8)#35 | 3.1%(+13.1)#996 |
| 36. | Monmouth | 15.9% | 3.5%(+12.5)#36 | 3.1%(+12.9)#1,029 |
| 37. | Pacific Junction | 15.6% | 3.5%(+12.1)#37 | 3.1%(+12.5)#1,062 |
| 38. | Goose Lake | 15.3% | 3.5%(+11.9)#38 | 3.1%(+12.3)#1,100 |
| 39. | Knierim | 15.2% | 3.5%(+11.8)#39 | 3.1%(+12.1)#1,120 |
| 40. | Spring Hill | 15.2% | 3.5%(+11.8)#40 | 3.1%(+12.1)#1,121 |
| 41. | Sharpsburg | 15.2% | 3.5%(+11.7)#41 | 3.1%(+12.1)#1,130 |
| 42. | Hastings | 15.1% | 3.5%(+11.6)#42 | 3.1%(+12.0)#1,138 |
| 43. | Unionville | 15.1% | 3.5%(+11.6)#43 | 3.1%(+12.0)#1,139 |
| 44. | Elma | 15.1% | 3.5%(+11.6)#44 | 3.1%(+12.0)#1,142 |
| 45. | Maysville | 15.0% | 3.5%(+11.5)#45 | 3.1%(+11.9)#1,156 |
| 46. | North Buena Vista | 15.0% | 3.5%(+11.5)#46 | 3.1%(+11.9)#1,159 |
| 47. | Lost Nation | 14.8% | 3.5%(+11.3)#47 | 3.1%(+11.7)#1,185 |
| 48. | Green Mountain | 14.7% | 3.5%(+11.3)#48 | 3.1%(+11.7)#1,197 |
| 49. | Mcintire | 14.6% | 3.5%(+11.2)#49 | 3.1%(+11.6)#1,213 |
| 50. | Earling | 14.2% | 3.5%(+10.7)#50 | 3.1%(+11.1)#1,296 |
| 51. | Waterville | 14.1% | 3.5%(+10.6)#51 | 3.1%(+11.0)#1,319 |
| 52. | Orchard | 13.9% | 3.5%(+10.4)#52 | 3.1%(+10.8)#1,365 |
| 53. | Guernsey | 13.9% | 3.5%(+10.4)#53 | 3.1%(+10.8)#1,366 |
| 54. | Milton | 13.6% | 3.5%(+10.1)#54 | 3.1%(+10.5)#1,413 |
| 55. | Franklin | 13.5% | 3.5%(+10.00)#55 | 3.1%(+10.4)#1,450 |
| 56. | Laurens | 13.4% | 3.5%(+9.96)#56 | 3.1%(+10.4)#1,459 |
| 57. | Shambaugh | 13.4% | 3.5%(+9.95)#57 | 3.1%(+10.3)#1,462 |
| 58. | Farnhamville | 13.4% | 3.5%(+9.90)#58 | 3.1%(+10.3)#1,473 |
| 59. | Rossie | 13.3% | 3.5%(+9.87)#59 | 3.1%(+10.3)#1,488 |
| 60. | Farmersburg | 13.2% | 3.5%(+9.70)#60 | 3.1%(+10.1)#1,522 |
| 61. | Graettinger | 13.2% | 3.5%(+9.69)#61 | 3.1%(+10.1)#1,524 |
| 62. | Floris | 13.1% | 3.5%(+9.62)#62 | 3.1%(+10.0)#1,544 |
| 63. | Swan | 12.9% | 3.5%(+9.44)#63 | 3.1%(+9.84)#1,599 |
| 64. | Otho | 12.6% | 3.5%(+9.10)#64 | 3.1%(+9.50)#1,678 |
| 65. | Sandyville | 12.5% | 3.5%(+9.03)#65 | 3.1%(+9.43)#1,712 |
| 66. | Westside | 12.4% | 3.5%(+8.95)#66 | 3.1%(+9.35)#1,722 |
| 67. | Evansdale | 12.4% | 3.5%(+8.94)#67 | 3.1%(+9.34)#1,725 |
| 68. | Goodell | 12.4% | 3.5%(+8.91)#68 | 3.1%(+9.30)#1,734 |
| 69. | Alta Vista | 12.3% | 3.5%(+8.81)#69 | 3.1%(+9.21)#1,755 |
| 70. | Burr Oak | 12.2% | 3.5%(+8.78)#70 | 3.1%(+9.18)#1,766 |
| 71. | Garber | 12.0% | 3.5%(+8.53)#71 | 3.1%(+8.93)#1,830 |
| 72. | Grandview | 11.9% | 3.5%(+8.44)#72 | 3.1%(+8.84)#1,855 |
| 73. | South Amana | 11.8% | 3.5%(+8.30)#73 | 3.1%(+8.70)#1,895 |
| 74. | Wilton | 11.6% | 3.5%(+8.18)#74 | 3.1%(+8.58)#1,933 |
| 75. | Westfield | 11.6% | 3.5%(+8.13)#75 | 3.1%(+8.53)#1,942 |
| 76. | Mingo | 11.6% | 3.5%(+8.09)#76 | 3.1%(+8.49)#1,956 |
| 77. | Coin | 11.5% | 3.5%(+8.07)#77 | 3.1%(+8.47)#1,967 |
| 78. | Melrose | 11.5% | 3.5%(+8.07)#78 | 3.1%(+8.47)#1,970 |
| 79. | Guthrie Center | 11.5% | 3.5%(+7.99)#79 | 3.1%(+8.39)#2,003 |
| 80. | Luzerne | 11.4% | 3.5%(+7.96)#80 | 3.1%(+8.36)#2,010 |
| 81. | Conesville | 11.4% | 3.5%(+7.91)#81 | 3.1%(+8.30)#2,029 |
| 82. | Geneva | 11.4% | 3.5%(+7.90)#82 | 3.1%(+8.30)#2,031 |
| 83. | Dixon | 11.3% | 3.5%(+7.88)#83 | 3.1%(+8.28)#2,038 |
| 84. | Lineville | 11.3% | 3.5%(+7.78)#84 | 3.1%(+8.18)#2,062 |
| 85. | Delta | 11.1% | 3.5%(+7.64)#85 | 3.1%(+8.04)#2,102 |
| 86. | Rowan | 11.1% | 3.5%(+7.64)#86 | 3.1%(+8.04)#2,111 |
| 87. | Tennant | 11.1% | 3.5%(+7.64)#87 | 3.1%(+8.04)#2,118 |
| 88. | Oakland | 11.1% | 3.5%(+7.63)#88 | 3.1%(+8.03)#2,126 |
| 89. | Doon | 10.9% | 3.5%(+7.44)#89 | 3.1%(+7.84)#2,168 |
| 90. | Ledyard | 10.9% | 3.5%(+7.40)#90 | 3.1%(+7.80)#2,192 |
| 91. | Fremont | 10.9% | 3.5%(+7.39)#91 | 3.1%(+7.79)#2,194 |
| 92. | Panora | 10.8% | 3.5%(+7.28)#92 | 3.1%(+7.68)#2,228 |
| 93. | Lehigh | 10.7% | 3.5%(+7.27)#93 | 3.1%(+7.66)#2,239 |
| 94. | Mitchell | 10.6% | 3.5%(+7.17)#94 | 3.1%(+7.57)#2,272 |
| 95. | Mccallsburg | 10.5% | 3.5%(+7.08)#95 | 3.1%(+7.48)#2,306 |
| 96. | Superior | 10.5% | 3.5%(+7.06)#96 | 3.1%(+7.46)#2,318 |
| 97. | Valeria | 10.5% | 3.5%(+7.06)#97 | 3.1%(+7.46)#2,328 |
| 98. | Clio | 10.5% | 3.5%(+7.06)#98 | 3.1%(+7.46)#2,329 |
| 99. | Mooar | 10.4% | 3.5%(+6.92)#99 | 3.1%(+7.32)#2,372 |
| 100. | Montezuma | 10.3% | 3.5%(+6.88)#100 | 3.1%(+7.28)#2,392 |
Common Questions
What are the Top 10 Cities with the Highest Percentage of Population Employed in Installation, Maintenance & Repair in Iowa?
Top 10 Cities with the Highest Percentage of Population Employed in Installation, Maintenance & Repair in Iowa are:
#1
60.6%
#2
48.8%
#3
48.7%
#4
40.4%
#5
39.3%
#6
36.4%
#7
34.8%
#8
31.2%
#9
30.0%
#10
30.0%
What city has the Highest Percentage of Population Employed in Installation, Maintenance & Repair in Iowa?
Irvington has the Highest Percentage of Population Employed in Installation, Maintenance & Repair in Iowa with 60.6%.
What is the Percentage of Population Employed in Installation, Maintenance & Repair in the State of Iowa?
Percentage of Population Employed in Installation, Maintenance & Repair in Iowa is 3.5%.
What is the Percentage of Population Employed in Installation, Maintenance & Repair in the United States?
Percentage of Population Employed in Installation, Maintenance & Repair in the United States is 3.1%.