Cities with the Highest Percentage of Population Employed in Health Diagnosing & Treating in California
RELATED REPORTS & OPTIONS
Health Diagnosing & Treating
California
Compare Cities
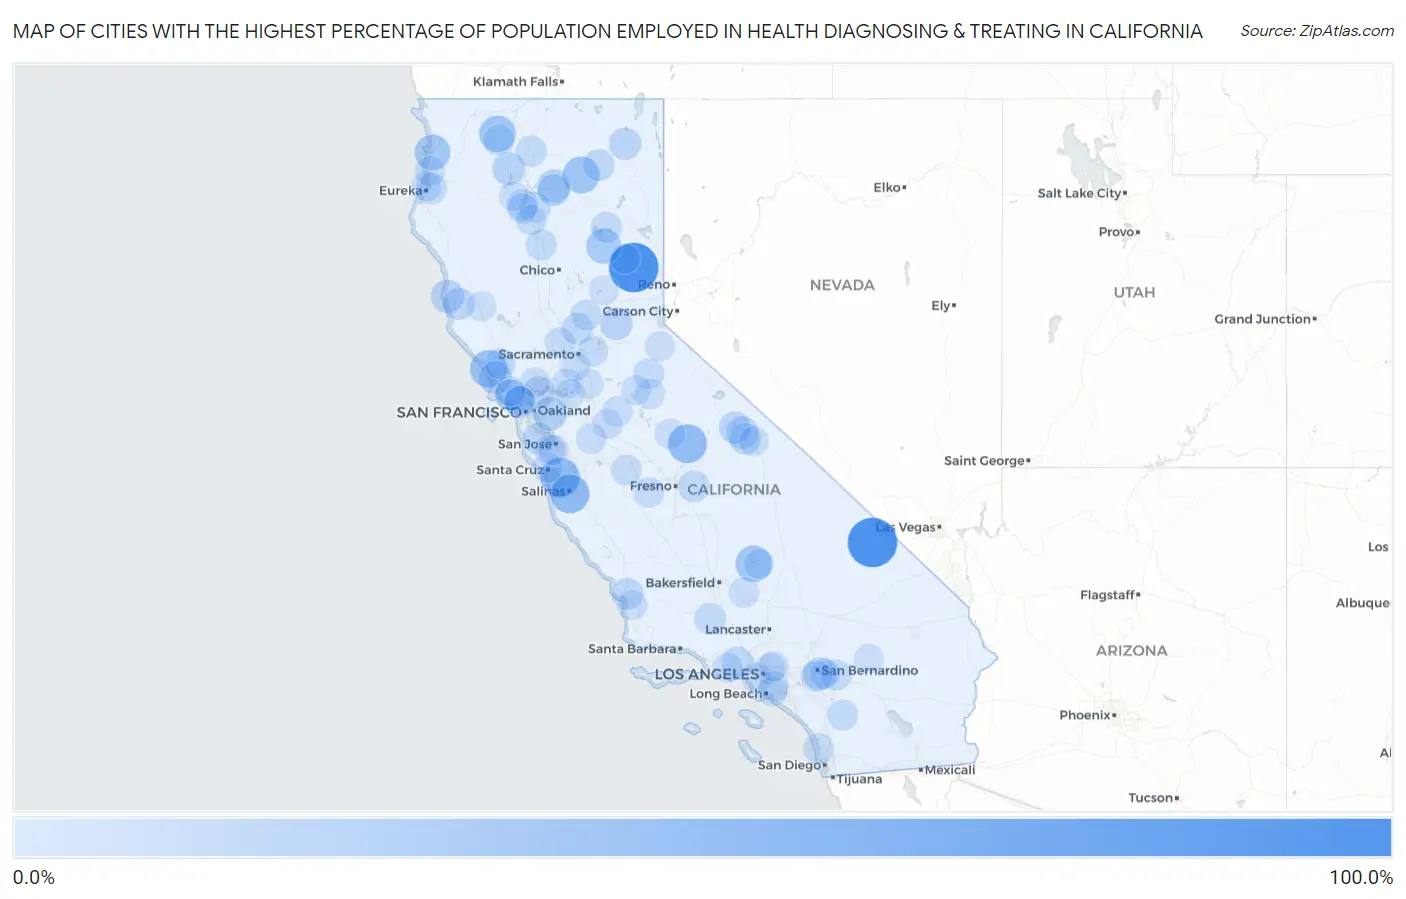
Map of Cities with the Highest Percentage of Population Employed in Health Diagnosing & Treating in California
0.0%
100.0%
Cities with the Highest Percentage of Population Employed in Health Diagnosing & Treating in California
| City | % Employed | vs State | vs National | |
| 1. | Gold Mountain | 100.0% | 5.3%(+94.7)#1 | 6.2%(+93.8)#7 |
| 2. | Shoshone | 100.0% | 5.3%(+94.7)#2 | 6.2%(+93.8)#17 |
| 3. | Pajaro Dunes | 53.3% | 5.3%(+48.0)#3 | 6.2%(+47.1)#64 |
| 4. | Spreckels | 50.8% | 5.3%(+45.5)#4 | 6.2%(+44.5)#77 |
| 5. | Bass Lake | 50.5% | 5.3%(+45.1)#5 | 6.2%(+44.2)#78 |
| 6. | Sereno Del Mar | 44.4% | 5.3%(+39.1)#6 | 6.2%(+38.2)#109 |
| 7. | Rumsey | 42.3% | 5.3%(+37.0)#7 | 6.2%(+36.1)#125 |
| 8. | Fall River Mills | 41.3% | 5.3%(+36.0)#8 | 6.2%(+35.0)#136 |
| 9. | Mountain Mesa | 40.0% | 5.3%(+34.7)#9 | 6.2%(+33.8)#142 |
| 10. | Greenview | 40.0% | 5.3%(+34.7)#10 | 6.2%(+33.8)#144 |
| 11. | Orick | 35.9% | 5.3%(+30.6)#11 | 6.2%(+29.7)#185 |
| 12. | Twain | 33.3% | 5.3%(+28.0)#12 | 6.2%(+27.1)#222 |
| 13. | Norris Canyon | 27.1% | 5.3%(+21.8)#13 | 6.2%(+20.8)#374 |
| 14. | Montgomery Creek | 26.1% | 5.3%(+20.8)#14 | 6.2%(+19.9)#405 |
| 15. | Caspar | 25.3% | 5.3%(+20.0)#15 | 6.2%(+19.1)#428 |
| 16. | Dillon Beach | 24.2% | 5.3%(+18.9)#16 | 6.2%(+18.0)#478 |
| 17. | Coffee Creek | 24.2% | 5.3%(+18.9)#17 | 6.2%(+18.0)#482 |
| 18. | Loma Linda | 23.5% | 5.3%(+18.2)#18 | 6.2%(+17.2)#523 |
| 19. | Foresthill | 22.7% | 5.3%(+17.3)#19 | 6.2%(+16.4)#570 |
| 20. | Paradise | 21.9% | 5.3%(+16.6)#20 | 6.2%(+15.7)#608 |
| 21. | El Adobe | 21.2% | 5.3%(+15.8)#21 | 6.2%(+14.9)#647 |
| 22. | California Pines | 20.5% | 5.3%(+15.2)#22 | 6.2%(+14.2)#704 |
| 23. | Port Costa | 20.3% | 5.3%(+15.0)#23 | 6.2%(+14.0)#720 |
| 24. | Ladera | 20.2% | 5.3%(+14.9)#24 | 6.2%(+13.9)#726 |
| 25. | Crowley Lake | 20.0% | 5.3%(+14.7)#25 | 6.2%(+13.8)#734 |
| 26. | Comptche | 20.0% | 5.3%(+14.7)#26 | 6.2%(+13.8)#747 |
| 27. | Round Mountain | 20.0% | 5.3%(+14.7)#27 | 6.2%(+13.8)#748 |
| 28. | Knights Ferry | 20.0% | 5.3%(+14.7)#28 | 6.2%(+13.8)#751 |
| 29. | El Macero | 19.8% | 5.3%(+14.5)#29 | 6.2%(+13.6)#766 |
| 30. | Trowbridge | 19.3% | 5.3%(+14.0)#30 | 6.2%(+13.1)#808 |
| 31. | Alto | 19.1% | 5.3%(+13.8)#31 | 6.2%(+12.8)#830 |
| 32. | San Geronimo | 19.0% | 5.3%(+13.7)#32 | 6.2%(+12.8)#838 |
| 33. | Bell Canyon | 18.5% | 5.3%(+13.2)#33 | 6.2%(+12.3)#892 |
| 34. | Los Ranchos | 18.4% | 5.3%(+13.1)#34 | 6.2%(+12.1)#906 |
| 35. | Franklin Cdp Merced County | 18.2% | 5.3%(+12.9)#35 | 6.2%(+12.0)#925 |
| 36. | Bieber | 18.2% | 5.3%(+12.9)#36 | 6.2%(+11.9)#935 |
| 37. | Round Valley | 18.1% | 5.3%(+12.8)#37 | 6.2%(+11.9)#945 |
| 38. | Minkler | 17.9% | 5.3%(+12.6)#38 | 6.2%(+11.6)#967 |
| 39. | Pine Mountain Club | 17.1% | 5.3%(+11.8)#39 | 6.2%(+10.9)#1,066 |
| 40. | Indianola | 17.1% | 5.3%(+11.8)#40 | 6.2%(+10.8)#1,073 |
| 41. | Palo Cedro | 17.0% | 5.3%(+11.7)#41 | 6.2%(+10.8)#1,083 |
| 42. | Shasta | 16.9% | 5.3%(+11.6)#42 | 6.2%(+10.7)#1,106 |
| 43. | Westwood | 16.8% | 5.3%(+11.5)#43 | 6.2%(+10.5)#1,125 |
| 44. | Oak Glen | 16.4% | 5.3%(+11.1)#44 | 6.2%(+10.1)#1,205 |
| 45. | Mount Shasta | 16.2% | 5.3%(+10.8)#45 | 6.2%(+9.91)#1,252 |
| 46. | Aguanga | 15.7% | 5.3%(+10.4)#46 | 6.2%(+9.49)#1,346 |
| 47. | Highgrove | 15.6% | 5.3%(+10.3)#47 | 6.2%(+9.35)#1,370 |
| 48. | Graton | 15.6% | 5.3%(+10.3)#48 | 6.2%(+9.33)#1,379 |
| 49. | Gold River | 15.6% | 5.3%(+10.2)#49 | 6.2%(+9.31)#1,386 |
| 50. | Etna | 15.4% | 5.3%(+10.1)#50 | 6.2%(+9.20)#1,404 |
| 51. | Dorrington | 15.3% | 5.3%(+10.0)#51 | 6.2%(+9.09)#1,432 |
| 52. | Gerber | 15.1% | 5.3%(+9.79)#52 | 6.2%(+8.85)#1,484 |
| 53. | Jones Valley | 15.1% | 5.3%(+9.79)#53 | 6.2%(+8.85)#1,485 |
| 54. | Lagunitas Forest Knolls | 14.9% | 5.3%(+9.55)#54 | 6.2%(+8.61)#1,539 |
| 55. | Elfin Forest | 14.6% | 5.3%(+9.30)#55 | 6.2%(+8.37)#1,612 |
| 56. | Diablo Grande | 14.5% | 5.3%(+9.18)#56 | 6.2%(+8.25)#1,646 |
| 57. | American Canyon | 14.5% | 5.3%(+9.18)#57 | 6.2%(+8.24)#1,651 |
| 58. | Beale Afb | 14.5% | 5.3%(+9.16)#58 | 6.2%(+8.23)#1,655 |
| 59. | Monte Sereno | 14.5% | 5.3%(+9.16)#59 | 6.2%(+8.23)#1,658 |
| 60. | Del Mar | 14.4% | 5.3%(+9.08)#60 | 6.2%(+8.15)#1,678 |
| 61. | Yolo | 14.1% | 5.3%(+8.83)#61 | 6.2%(+7.90)#1,763 |
| 62. | San Marino | 14.1% | 5.3%(+8.77)#62 | 6.2%(+7.83)#1,787 |
| 63. | Cottonwood | 14.0% | 5.3%(+8.70)#63 | 6.2%(+7.77)#1,803 |
| 64. | South Dos Palos | 14.0% | 5.3%(+8.70)#64 | 6.2%(+7.76)#1,806 |
| 65. | Tranquillity | 13.8% | 5.3%(+8.53)#65 | 6.2%(+7.60)#1,848 |
| 66. | Pasatiempo | 13.6% | 5.3%(+8.29)#66 | 6.2%(+7.35)#1,943 |
| 67. | Twain Harte | 13.6% | 5.3%(+8.27)#67 | 6.2%(+7.34)#1,949 |
| 68. | El Sobrante Cdp Riverside County | 13.4% | 5.3%(+8.12)#68 | 6.2%(+7.18)#2,019 |
| 69. | Centerville | 13.4% | 5.3%(+8.05)#69 | 6.2%(+7.11)#2,037 |
| 70. | East Oakdale | 13.3% | 5.3%(+7.96)#70 | 6.2%(+7.03)#2,075 |
| 71. | Bootjack | 13.3% | 5.3%(+7.95)#71 | 6.2%(+7.01)#2,079 |
| 72. | Redlands | 13.2% | 5.3%(+7.85)#72 | 6.2%(+6.91)#2,115 |
| 73. | Keene | 13.1% | 5.3%(+7.75)#73 | 6.2%(+6.82)#2,152 |
| 74. | Manila | 13.0% | 5.3%(+7.66)#74 | 6.2%(+6.72)#2,208 |
| 75. | Cambrian Park | 13.0% | 5.3%(+7.65)#75 | 6.2%(+6.72)#2,213 |
| 76. | Rio Vista | 12.9% | 5.3%(+7.63)#76 | 6.2%(+6.70)#2,220 |
| 77. | Mountain Meadows | 12.8% | 5.3%(+7.49)#77 | 6.2%(+6.56)#2,288 |
| 78. | Lake Sherwood | 12.8% | 5.3%(+7.48)#78 | 6.2%(+6.55)#2,290 |
| 79. | Parklawn | 12.7% | 5.3%(+7.43)#79 | 6.2%(+6.49)#2,312 |
| 80. | Westhaven Moonstone | 12.7% | 5.3%(+7.42)#80 | 6.2%(+6.49)#2,316 |
| 81. | Ladera Heights | 12.6% | 5.3%(+7.29)#81 | 6.2%(+6.35)#2,382 |
| 82. | Vallecito | 12.5% | 5.3%(+7.19)#82 | 6.2%(+6.26)#2,428 |
| 83. | Cerritos | 12.5% | 5.3%(+7.18)#83 | 6.2%(+6.25)#2,452 |
| 84. | Rossmoor | 12.5% | 5.3%(+7.17)#84 | 6.2%(+6.23)#2,455 |
| 85. | Kentfield | 12.2% | 5.3%(+6.90)#85 | 6.2%(+5.97)#2,572 |
| 86. | Bishop | 12.2% | 5.3%(+6.90)#86 | 6.2%(+5.96)#2,575 |
| 87. | Sierra Madre | 12.2% | 5.3%(+6.87)#87 | 6.2%(+5.93)#2,592 |
| 88. | Corte Madera | 12.1% | 5.3%(+6.81)#88 | 6.2%(+5.88)#2,625 |
| 89. | Woodbridge | 12.0% | 5.3%(+6.71)#89 | 6.2%(+5.78)#2,660 |
| 90. | Nicasio | 12.0% | 5.3%(+6.69)#90 | 6.2%(+5.76)#2,674 |
| 91. | Kirkwood | 11.8% | 5.3%(+6.45)#91 | 6.2%(+5.52)#2,795 |
| 92. | Blacklake | 11.7% | 5.3%(+6.39)#92 | 6.2%(+5.46)#2,834 |
| 93. | Camptonville | 11.7% | 5.3%(+6.36)#93 | 6.2%(+5.42)#2,856 |
| 94. | French Gulch | 11.7% | 5.3%(+6.34)#94 | 6.2%(+5.41)#2,872 |
| 95. | Cromberg | 11.6% | 5.3%(+6.30)#95 | 6.2%(+5.36)#2,904 |
| 96. | Clarksburg | 11.6% | 5.3%(+6.28)#96 | 6.2%(+5.35)#2,912 |
| 97. | Calpella | 11.6% | 5.3%(+6.27)#97 | 6.2%(+5.33)#2,928 |
| 98. | Weldon | 11.5% | 5.3%(+6.14)#98 | 6.2%(+5.21)#3,022 |
| 99. | Homestead Valley | 11.4% | 5.3%(+6.12)#99 | 6.2%(+5.18)#3,042 |
| 100. | Bethel Island | 11.4% | 5.3%(+6.07)#100 | 6.2%(+5.14)#3,068 |
Common Questions
What are the Top 10 Cities with the Highest Percentage of Population Employed in Health Diagnosing & Treating in California?
Top 10 Cities with the Highest Percentage of Population Employed in Health Diagnosing & Treating in California are:
#1
100.0%
#2
100.0%
#3
53.3%
#4
50.8%
#5
50.5%
#6
44.4%
#7
41.3%
#8
40.0%
#9
40.0%
#10
35.9%
What city has the Highest Percentage of Population Employed in Health Diagnosing & Treating in California?
Gold Mountain has the Highest Percentage of Population Employed in Health Diagnosing & Treating in California with 100.0%.
What is the Percentage of Population Employed in Health Diagnosing & Treating in the State of California?
Percentage of Population Employed in Health Diagnosing & Treating in California is 5.3%.
What is the Percentage of Population Employed in Health Diagnosing & Treating in the United States?
Percentage of Population Employed in Health Diagnosing & Treating in the United States is 6.2%.