Cities with the Most Immigrants from Iraq in California
RELATED REPORTS & OPTIONS
Iraq
California
Compare Cities
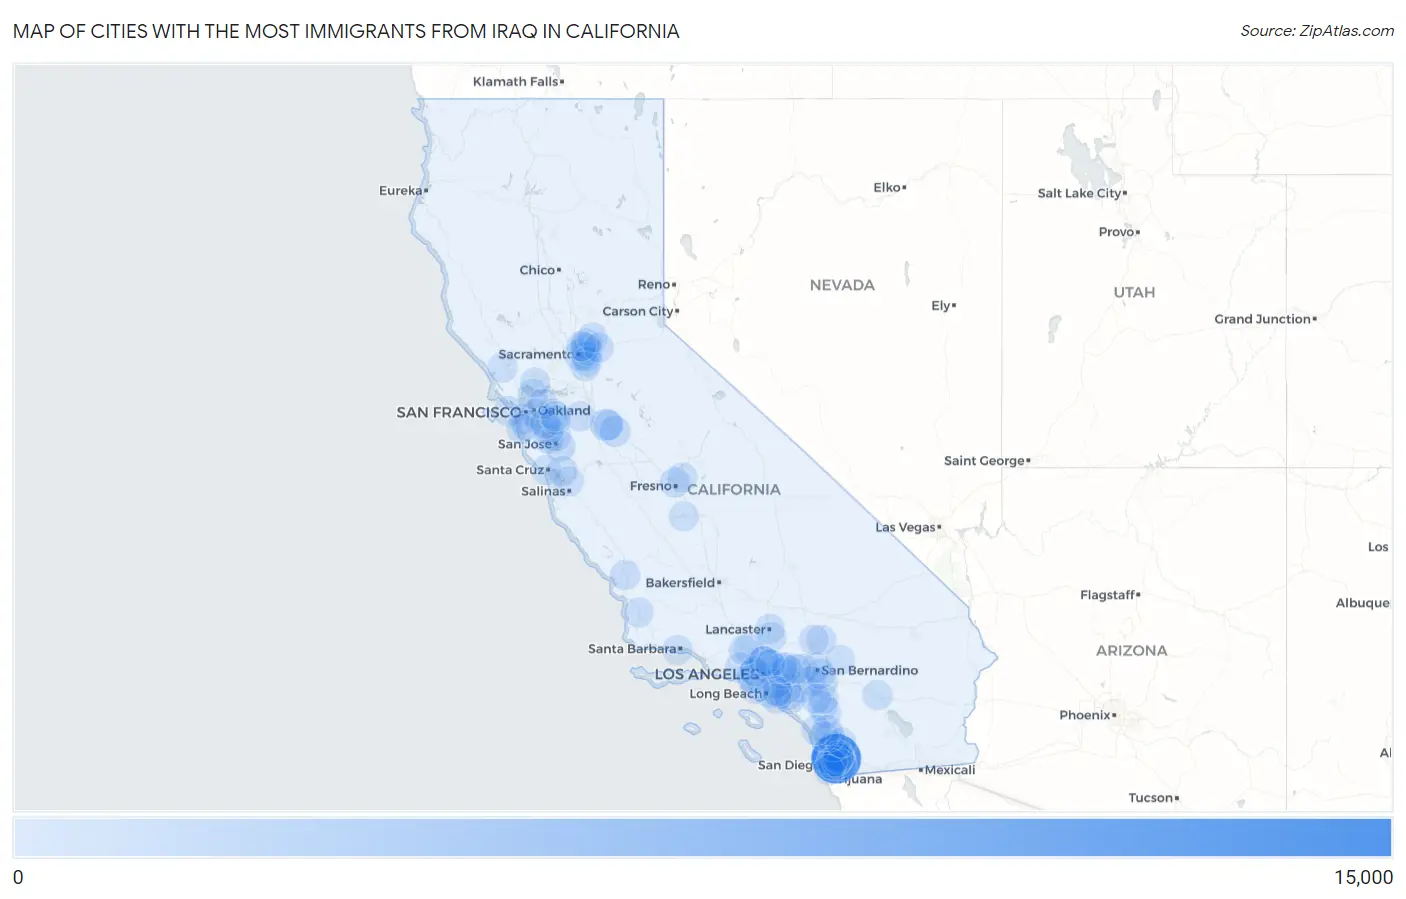
Map of Cities with the Most Immigrants from Iraq in California
0
15,000
Cities with the Most Immigrants from Iraq in California
| City | Iraq | vs State | vs National | |
| 1. | El Cajon | 12,887 | 40,941(31.48%)#1 | 234,088(5.51%)#2 |
| 2. | Glendale | 2,904 | 40,941(7.09%)#2 | 234,088(1.24%)#9 |
| 3. | Los Angeles | 2,531 | 40,941(6.18%)#3 | 234,088(1.08%)#12 |
| 4. | Rancho San Diego | 2,281 | 40,941(5.57%)#4 | 234,088(0.97%)#14 |
| 5. | San Diego | 1,523 | 40,941(3.72%)#5 | 234,088(0.65%)#20 |
| 6. | Modesto | 1,278 | 40,941(3.12%)#6 | 234,088(0.55%)#26 |
| 7. | Santee | 811 | 40,941(1.98%)#7 | 234,088(0.35%)#45 |
| 8. | Bostonia | 725 | 40,941(1.77%)#8 | 234,088(0.31%)#47 |
| 9. | Sacramento | 709 | 40,941(1.73%)#9 | 234,088(0.30%)#50 |
| 10. | San Jose | 669 | 40,941(1.63%)#10 | 234,088(0.29%)#52 |
| 11. | Spring Valley Cdp San Diego County | 660 | 40,941(1.61%)#11 | 234,088(0.28%)#54 |
| 12. | Turlock | 603 | 40,941(1.47%)#12 | 234,088(0.26%)#57 |
| 13. | Carmichael | 493 | 40,941(1.20%)#13 | 234,088(0.21%)#67 |
| 14. | Winter Gardens | 461 | 40,941(1.13%)#14 | 234,088(0.20%)#70 |
| 15. | Corona | 447 | 40,941(1.09%)#15 | 234,088(0.19%)#71 |
| 16. | Irvine | 409 | 40,941(1.00%)#16 | 234,088(0.17%)#80 |
| 17. | Lakeside | 388 | 40,941(0.95%)#17 | 234,088(0.17%)#83 |
| 18. | La Presa | 375 | 40,941(0.92%)#18 | 234,088(0.16%)#85 |
| 19. | Granite Hills | 323 | 40,941(0.79%)#19 | 234,088(0.14%)#105 |
| 20. | La Mesa | 305 | 40,941(0.74%)#20 | 234,088(0.13%)#112 |
| 21. | Jamul | 277 | 40,941(0.68%)#21 | 234,088(0.12%)#126 |
| 22. | Anaheim | 275 | 40,941(0.67%)#22 | 234,088(0.12%)#127 |
| 23. | Temecula | 262 | 40,941(0.64%)#23 | 234,088(0.11%)#131 |
| 24. | San Francisco | 251 | 40,941(0.61%)#24 | 234,088(0.11%)#139 |
| 25. | Antelope | 228 | 40,941(0.56%)#25 | 234,088(0.10%)#156 |
| 26. | Moreno Valley | 225 | 40,941(0.55%)#26 | 234,088(0.10%)#157 |
| 27. | Casa De Oro Mount Helix | 199 | 40,941(0.49%)#27 | 234,088(0.09%)#173 |
| 28. | Fresno | 194 | 40,941(0.47%)#28 | 234,088(0.08%)#177 |
| 29. | Poway | 189 | 40,941(0.46%)#29 | 234,088(0.08%)#178 |
| 30. | Daly City | 184 | 40,941(0.45%)#30 | 234,088(0.08%)#182 |
| 31. | Rancho Cucamonga | 178 | 40,941(0.43%)#31 | 234,088(0.08%)#186 |
| 32. | Indio | 174 | 40,941(0.43%)#32 | 234,088(0.07%)#194 |
| 33. | Garden Grove | 158 | 40,941(0.39%)#33 | 234,088(0.07%)#209 |
| 34. | Escondido | 157 | 40,941(0.38%)#34 | 234,088(0.07%)#211 |
| 35. | Palmdale | 154 | 40,941(0.38%)#35 | 234,088(0.07%)#213 |
| 36. | Tracy | 136 | 40,941(0.33%)#36 | 234,088(0.06%)#232 |
| 37. | Sunnyvale | 127 | 40,941(0.31%)#37 | 234,088(0.05%)#243 |
| 38. | Santa Clarita | 123 | 40,941(0.30%)#38 | 234,088(0.05%)#252 |
| 39. | San Bernardino | 122 | 40,941(0.30%)#39 | 234,088(0.05%)#253 |
| 40. | Oakland | 121 | 40,941(0.30%)#40 | 234,088(0.05%)#255 |
| 41. | Atascadero | 118 | 40,941(0.29%)#41 | 234,088(0.05%)#265 |
| 42. | Riverside | 113 | 40,941(0.28%)#42 | 234,088(0.05%)#274 |
| 43. | Rosemont | 109 | 40,941(0.27%)#43 | 234,088(0.05%)#282 |
| 44. | Murrieta | 106 | 40,941(0.26%)#44 | 234,088(0.05%)#288 |
| 45. | Milpitas | 103 | 40,941(0.25%)#45 | 234,088(0.04%)#295 |
| 46. | North Highlands | 96 | 40,941(0.23%)#46 | 234,088(0.04%)#305 |
| 47. | Calabasas | 95 | 40,941(0.23%)#47 | 234,088(0.04%)#309 |
| 48. | Tustin | 86 | 40,941(0.21%)#48 | 234,088(0.04%)#332 |
| 49. | Pasadena | 83 | 40,941(0.20%)#49 | 234,088(0.04%)#338 |
| 50. | Vineyard | 82 | 40,941(0.20%)#50 | 234,088(0.04%)#342 |
| 51. | West Covina | 76 | 40,941(0.19%)#51 | 234,088(0.03%)#366 |
| 52. | Lemon Grove | 75 | 40,941(0.18%)#52 | 234,088(0.03%)#370 |
| 53. | San Ramon | 74 | 40,941(0.18%)#53 | 234,088(0.03%)#373 |
| 54. | Hidden Meadows | 71 | 40,941(0.17%)#54 | 234,088(0.03%)#385 |
| 55. | Loma Linda | 69 | 40,941(0.17%)#55 | 234,088(0.03%)#390 |
| 56. | Millbrae | 67 | 40,941(0.16%)#56 | 234,088(0.03%)#399 |
| 57. | Elk Grove | 66 | 40,941(0.16%)#57 | 234,088(0.03%)#400 |
| 58. | Menifee | 66 | 40,941(0.16%)#58 | 234,088(0.03%)#401 |
| 59. | Glendora | 66 | 40,941(0.16%)#59 | 234,088(0.03%)#402 |
| 60. | Montara | 66 | 40,941(0.16%)#60 | 234,088(0.03%)#405 |
| 61. | Fremont | 65 | 40,941(0.16%)#61 | 234,088(0.03%)#406 |
| 62. | Hayward | 65 | 40,941(0.16%)#62 | 234,088(0.03%)#407 |
| 63. | Santa Barbara | 65 | 40,941(0.16%)#63 | 234,088(0.03%)#408 |
| 64. | Sebastopol | 64 | 40,941(0.16%)#64 | 234,088(0.03%)#415 |
| 65. | Clovis | 62 | 40,941(0.15%)#65 | 234,088(0.03%)#423 |
| 66. | Santa Maria | 61 | 40,941(0.15%)#66 | 234,088(0.03%)#429 |
| 67. | National City | 58 | 40,941(0.14%)#67 | 234,088(0.02%)#442 |
| 68. | Watsonville | 58 | 40,941(0.14%)#68 | 234,088(0.02%)#443 |
| 69. | Hercules | 57 | 40,941(0.14%)#69 | 234,088(0.02%)#454 |
| 70. | Big Bear Lake | 57 | 40,941(0.14%)#70 | 234,088(0.02%)#457 |
| 71. | Long Beach | 56 | 40,941(0.14%)#71 | 234,088(0.02%)#458 |
| 72. | La Mirada | 55 | 40,941(0.13%)#72 | 234,088(0.02%)#461 |
| 73. | American Canyon | 55 | 40,941(0.13%)#73 | 234,088(0.02%)#463 |
| 74. | Ceres | 54 | 40,941(0.13%)#74 | 234,088(0.02%)#467 |
| 75. | Beverly Hills | 54 | 40,941(0.13%)#75 | 234,088(0.02%)#468 |
| 76. | Rocklin | 53 | 40,941(0.13%)#76 | 234,088(0.02%)#474 |
| 77. | Huntington Beach | 52 | 40,941(0.13%)#77 | 234,088(0.02%)#478 |
| 78. | San Marcos | 52 | 40,941(0.13%)#78 | 234,088(0.02%)#481 |
| 79. | Apple Valley | 52 | 40,941(0.13%)#79 | 234,088(0.02%)#483 |
| 80. | Santa Cruz | 52 | 40,941(0.13%)#80 | 234,088(0.02%)#484 |
| 81. | Victorville | 51 | 40,941(0.12%)#81 | 234,088(0.02%)#490 |
| 82. | San Dimas | 51 | 40,941(0.12%)#82 | 234,088(0.02%)#492 |
| 83. | Lafayette | 50 | 40,941(0.12%)#83 | 234,088(0.02%)#498 |
| 84. | Ramona | 50 | 40,941(0.12%)#84 | 234,088(0.02%)#499 |
| 85. | Prunedale | 50 | 40,941(0.12%)#85 | 234,088(0.02%)#500 |
| 86. | Azusa | 49 | 40,941(0.12%)#86 | 234,088(0.02%)#507 |
| 87. | Altadena | 49 | 40,941(0.12%)#87 | 234,088(0.02%)#508 |
| 88. | Stanton | 49 | 40,941(0.12%)#88 | 234,088(0.02%)#509 |
| 89. | Rio Linda | 49 | 40,941(0.12%)#89 | 234,088(0.02%)#512 |
| 90. | Oceanside | 48 | 40,941(0.12%)#90 | 234,088(0.02%)#516 |
| 91. | Upland | 47 | 40,941(0.11%)#91 | 234,088(0.02%)#524 |
| 92. | Lake Elsinore | 46 | 40,941(0.11%)#92 | 234,088(0.02%)#534 |
| 93. | La Crescenta Montrose | 46 | 40,941(0.11%)#93 | 234,088(0.02%)#539 |
| 94. | Torrance | 45 | 40,941(0.11%)#94 | 234,088(0.02%)#544 |
| 95. | Lancaster | 43 | 40,941(0.11%)#95 | 234,088(0.02%)#562 |
| 96. | Folsom | 43 | 40,941(0.11%)#96 | 234,088(0.02%)#563 |
| 97. | Dublin | 42 | 40,941(0.10%)#97 | 234,088(0.02%)#570 |
| 98. | Pleasanton | 41 | 40,941(0.10%)#98 | 234,088(0.02%)#579 |
| 99. | Hanford | 41 | 40,941(0.10%)#99 | 234,088(0.02%)#580 |
| 100. | Stevenson Ranch | 40 | 40,941(0.10%)#100 | 234,088(0.02%)#592 |
Common Questions
What are the Top 10 Cities with the Most Immigrants from Iraq in California?
Top 10 Cities with the Most Immigrants from Iraq in California are:
#1
12,887
#2
2,904
#3
2,531
#4
2,281
#5
1,523
#6
1,278
#7
811
#8
725
#9
709
#10
669
What city has the Most Immigrants from Iraq in California?
El Cajon has the Most Immigrants from Iraq in California with 12,887.
What is the Total Immigrants from Iraq in the State of California?
Total Immigrants from Iraq in California is 40,941.
What is the Total Immigrants from Iraq in the United States?
Total Immigrants from Iraq in the United States is 234,088.