Sierra Brooks, CA Map & Demographics
Sierra Brooks Map
Sierra Brooks Overview
$28,112
PER CAPITA INCOME
$60,307
AVG FAMILY INCOME
$60,307
AVG HOUSEHOLD INCOME
0.45
INEQUALITY / GINI INDEX
503
TOTAL POPULATION
187
MALE POPULATION
316
FEMALE POPULATION
59.18
MALES / 100 FEMALES
168.98
FEMALES / 100 MALES
63.6
MEDIAN AGE
2.6
AVG FAMILY SIZE
2.7
AVG HOUSEHOLD SIZE
259
LABOR FORCE [ PEOPLE ]
51.5%
PERCENT IN LABOR FORCE
Income in Sierra Brooks
Income Overview in Sierra Brooks
Per Capita Income in Sierra Brooks is $28,112, while median incomes of families and households are $60,307 and $60,307 respectively.
| Characteristic | Number | Measure |
| Per Capita Income | 503 | $28,112 |
| Median Family Income | 187 | $60,307 |
| Mean Family Income | 187 | $68,083 |
| Median Household Income | 187 | $60,307 |
| Mean Household Income | 187 | $69,927 |
| Income Deficit | 187 | $0 |
| Wage / Income Gap (%) | 503 | 0.00% |
| Wage / Income Gap ($) | 503 | 100.00¢ per $1 |
| Gini / Inequality Index | 503 | 0.45 |
Earnings by Sex in Sierra Brooks
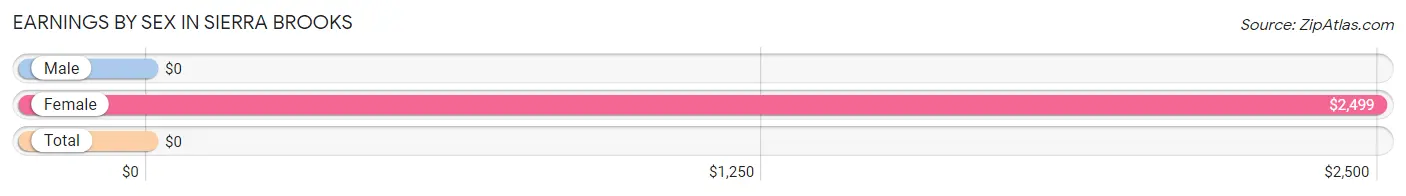
| Sex | Number | Average Earnings |
| Male | 128 (38.6%) | $0 |
| Female | 204 (61.5%) | $2,499 |
| Total | 332 (100.0%) | $0 |
Earnings by Sex by Income Bracket in Sierra Brooks
The most common earnings brackets in Sierra Brooks are $2,500 to $4,999 for men (53 | 41.4%) and $2,499 or less for women (153 | 75.0%).
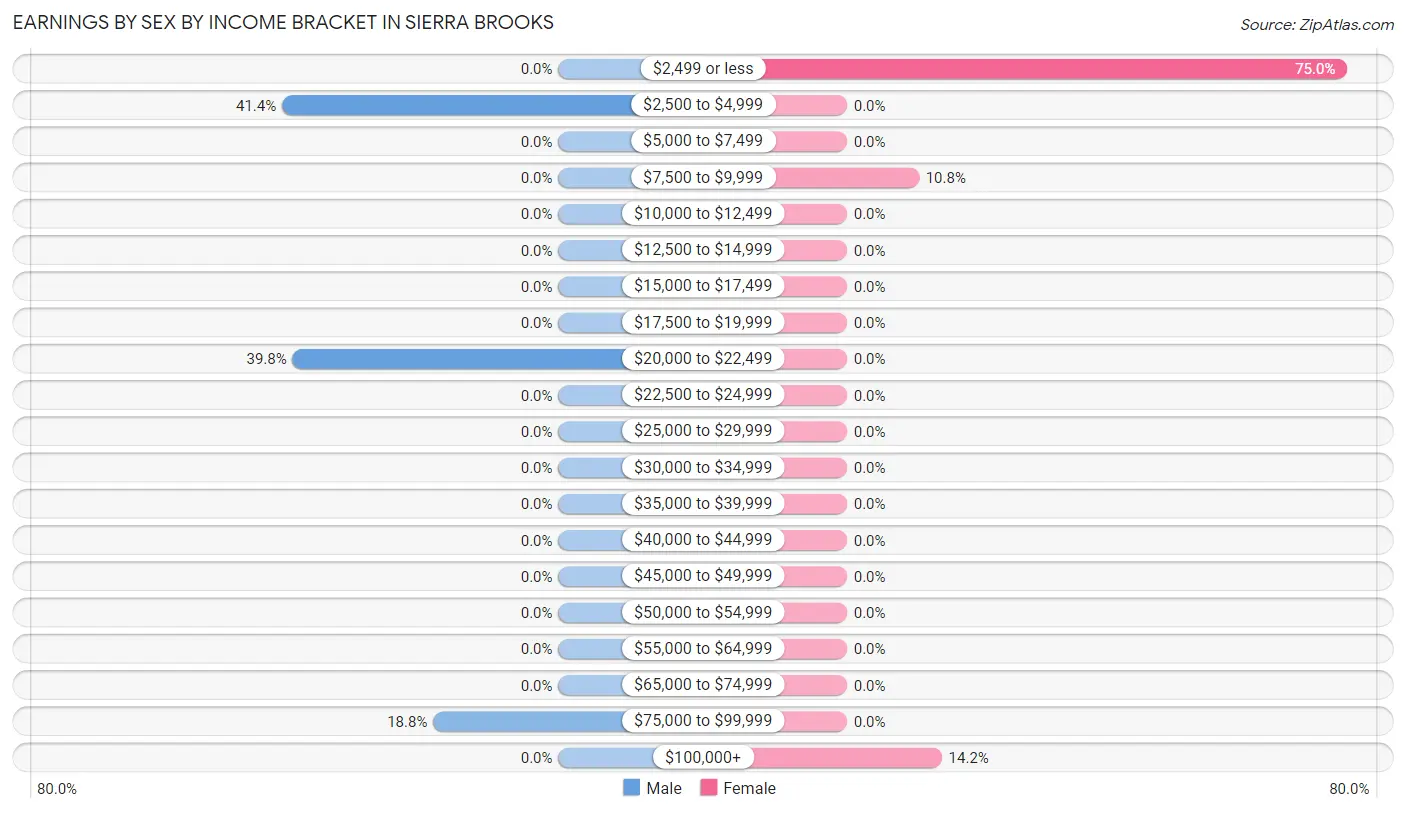
| Income | Male | Female |
| $2,499 or less | 0 (0.0%) | 153 (75.0%) |
| $2,500 to $4,999 | 53 (41.4%) | 0 (0.0%) |
| $5,000 to $7,499 | 0 (0.0%) | 0 (0.0%) |
| $7,500 to $9,999 | 0 (0.0%) | 22 (10.8%) |
| $10,000 to $12,499 | 0 (0.0%) | 0 (0.0%) |
| $12,500 to $14,999 | 0 (0.0%) | 0 (0.0%) |
| $15,000 to $17,499 | 0 (0.0%) | 0 (0.0%) |
| $17,500 to $19,999 | 0 (0.0%) | 0 (0.0%) |
| $20,000 to $22,499 | 51 (39.8%) | 0 (0.0%) |
| $22,500 to $24,999 | 0 (0.0%) | 0 (0.0%) |
| $25,000 to $29,999 | 0 (0.0%) | 0 (0.0%) |
| $30,000 to $34,999 | 0 (0.0%) | 0 (0.0%) |
| $35,000 to $39,999 | 0 (0.0%) | 0 (0.0%) |
| $40,000 to $44,999 | 0 (0.0%) | 0 (0.0%) |
| $45,000 to $49,999 | 0 (0.0%) | 0 (0.0%) |
| $50,000 to $54,999 | 0 (0.0%) | 0 (0.0%) |
| $55,000 to $64,999 | 0 (0.0%) | 0 (0.0%) |
| $65,000 to $74,999 | 0 (0.0%) | 0 (0.0%) |
| $75,000 to $99,999 | 24 (18.8%) | 0 (0.0%) |
| $100,000+ | 0 (0.0%) | 29 (14.2%) |
| Total | 128 (100.0%) | 204 (100.0%) |
Earnings by Sex by Educational Attainment in Sierra Brooks
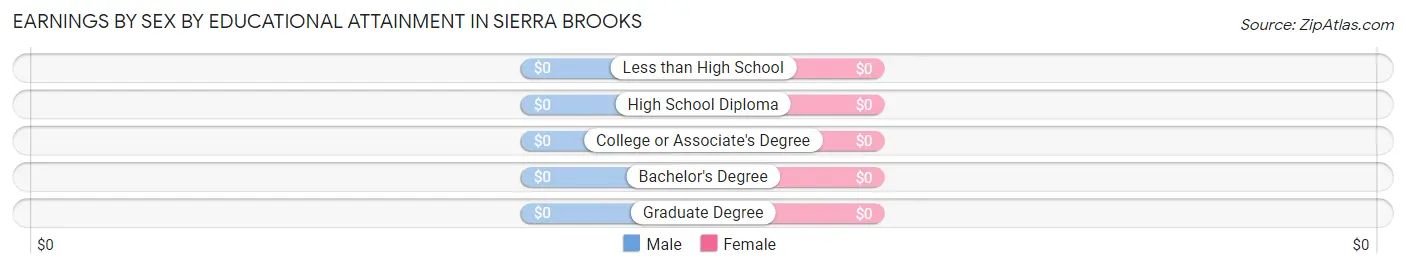
| Educational Attainment | Male Income | Female Income |
| Less than High School | - | - |
| High School Diploma | - | - |
| College or Associate's Degree | - | - |
| Bachelor's Degree | - | - |
| Graduate Degree | - | - |
| Total | - | - |
Family Income in Sierra Brooks
Family Income Brackets in Sierra Brooks
According to the Sierra Brooks family income data, there are 53 families falling into the $50,000 to $74,999 income range, which is the most common income bracket and makes up 28.3% of all families.
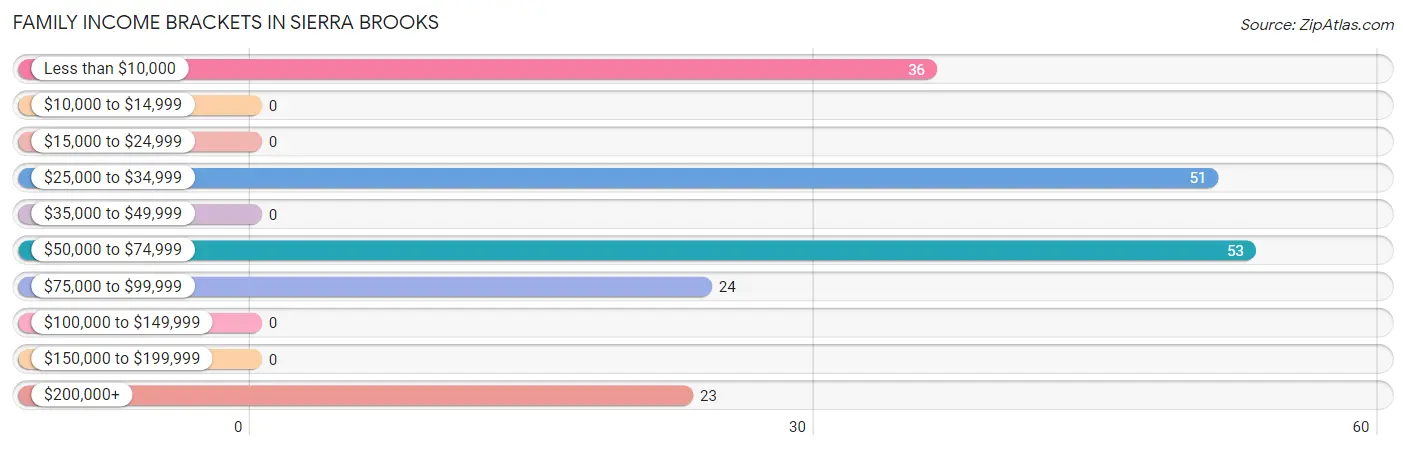
| Income Bracket | # Families | % Families |
| Less than $10,000 | 36 | 19.3% |
| $10,000 to $14,999 | 0 | 0.0% |
| $15,000 to $24,999 | 0 | 0.0% |
| $25,000 to $34,999 | 51 | 27.3% |
| $35,000 to $49,999 | 0 | 0.0% |
| $50,000 to $74,999 | 53 | 28.3% |
| $75,000 to $99,999 | 24 | 12.8% |
| $100,000 to $149,999 | 0 | 0.0% |
| $150,000 to $199,999 | 0 | 0.0% |
| $200,000+ | 23 | 12.3% |
Family Income by Famaliy Size in Sierra Brooks
2-person families (187 | 100.0%) account for the highest median family income in Sierra Brooks with $60,307 per family, while 2-person families (187 | 100.0%) have the highest median income of $30,154 per family member.
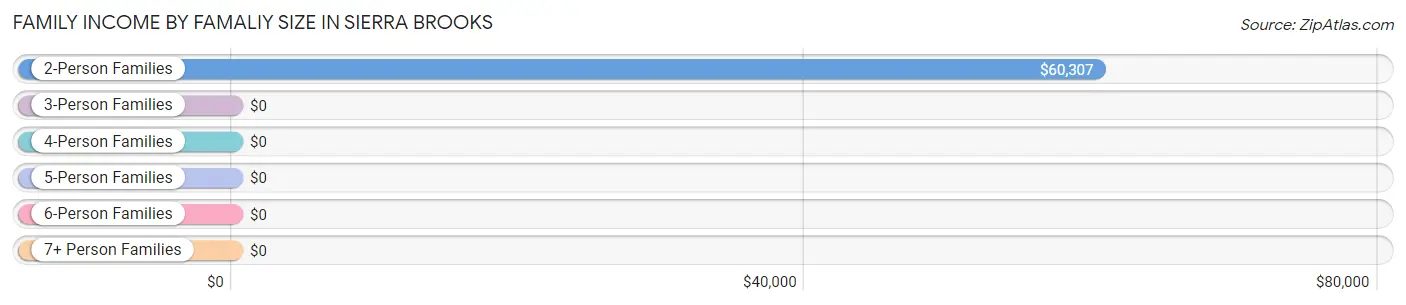
| Income Bracket | # Families | Median Income |
| 2-Person Families | 187 (100.0%) | $60,307 |
| 3-Person Families | 0 (0.0%) | $0 |
| 4-Person Families | 0 (0.0%) | $0 |
| 5-Person Families | 0 (0.0%) | $0 |
| 6-Person Families | 0 (0.0%) | $0 |
| 7+ Person Families | 0 (0.0%) | $0 |
| Total | 187 (100.0%) | $60,307 |
Family Income by Number of Earners in Sierra Brooks
| Number of Earners | # Families | Median Income |
| No Earners | 36 (19.3%) | $0 |
| 1 Earner | 76 (40.6%) | $0 |
| 2 Earners | 75 (40.1%) | $0 |
| 3+ Earners | 0 (0.0%) | $0 |
| Total | 187 (100.0%) | $60,307 |
Household Income in Sierra Brooks
Household Income Brackets in Sierra Brooks
With 53 households falling in the category, the $50,000 to $74,999 income range is the most frequent in Sierra Brooks, accounting for 28.3% of all households.
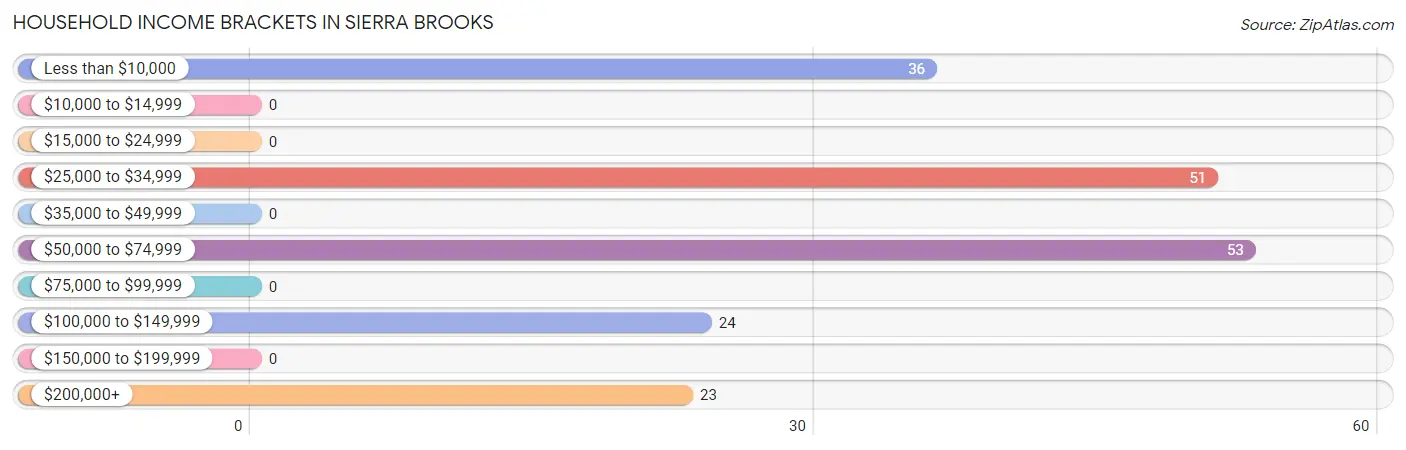
| Income Bracket | # Households | % Households |
| Less than $10,000 | 36 | 19.3% |
| $10,000 to $14,999 | 0 | 0.0% |
| $15,000 to $24,999 | 0 | 0.0% |
| $25,000 to $34,999 | 51 | 27.3% |
| $35,000 to $49,999 | 0 | 0.0% |
| $50,000 to $74,999 | 53 | 28.3% |
| $75,000 to $99,999 | 0 | 0.0% |
| $100,000 to $149,999 | 24 | 12.8% |
| $150,000 to $199,999 | 0 | 0.0% |
| $200,000+ | 23 | 12.3% |
Household Income by Householder Age in Sierra Brooks
| Income Bracket | # Households | Median Income |
| 15 to 24 Years | 0 (0.0%) | $0 |
| 25 to 44 Years | 0 (0.0%) | $0 |
| 45 to 64 Years | 75 (40.1%) | $0 |
| 65+ Years | 112 (59.9%) | $0 |
| Total | 187 (100.0%) | $60,307 |
Poverty in Sierra Brooks
Income Below Poverty by Sex and Age in Sierra Brooks
With 19.3% poverty level for males and 17.1% for females among the residents of Sierra Brooks, 75 year old and over males and 55 to 64 year old females are the most vulnerable to poverty, with 36 males (32.1%) and 22 females (50.0%) in their respective age groups living below the poverty level.
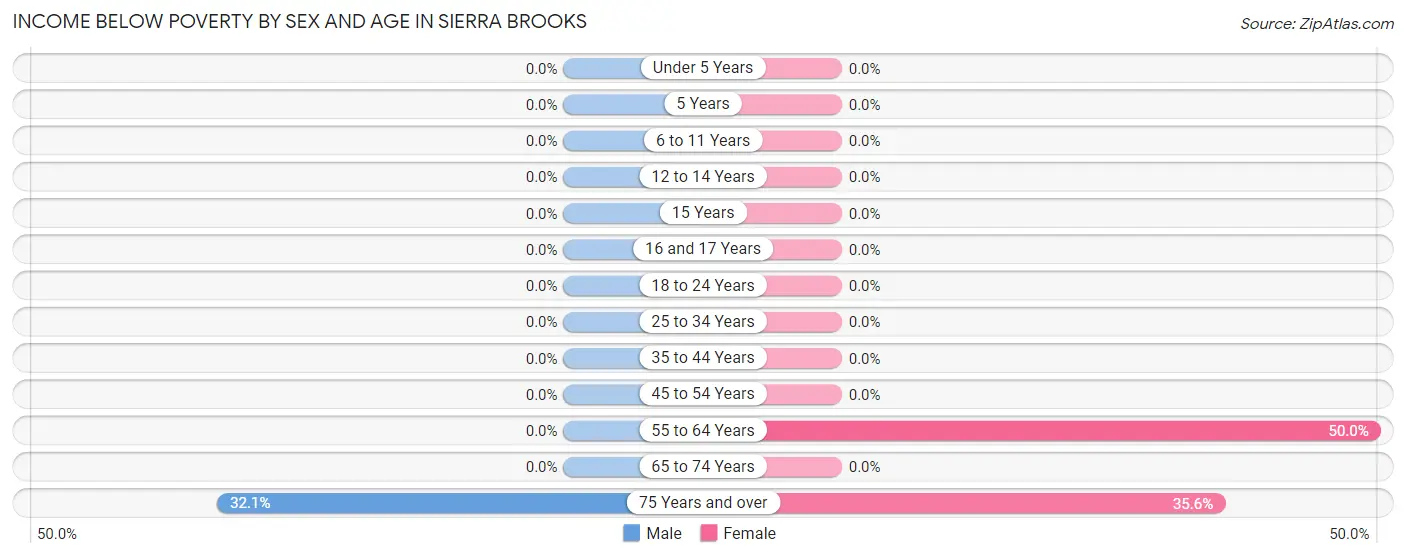
| Age Bracket | Male | Female |
| Under 5 Years | 0 (0.0%) | 0 (0.0%) |
| 5 Years | 0 (0.0%) | 0 (0.0%) |
| 6 to 11 Years | 0 (0.0%) | 0 (0.0%) |
| 12 to 14 Years | 0 (0.0%) | 0 (0.0%) |
| 15 Years | 0 (0.0%) | 0 (0.0%) |
| 16 and 17 Years | 0 (0.0%) | 0 (0.0%) |
| 18 to 24 Years | 0 (0.0%) | 0 (0.0%) |
| 25 to 34 Years | 0 (0.0%) | 0 (0.0%) |
| 35 to 44 Years | 0 (0.0%) | 0 (0.0%) |
| 45 to 54 Years | 0 (0.0%) | 0 (0.0%) |
| 55 to 64 Years | 0 (0.0%) | 22 (50.0%) |
| 65 to 74 Years | 0 (0.0%) | 0 (0.0%) |
| 75 Years and over | 36 (32.1%) | 32 (35.6%) |
| Total | 36 (19.3%) | 54 (17.1%) |
Income Above Poverty by Sex and Age in Sierra Brooks
According to the poverty statistics in Sierra Brooks, males aged 55 to 64 years and females aged 18 to 24 years are the age groups that are most secure financially, with 100.0% of males and 100.0% of females in these age groups living above the poverty line.
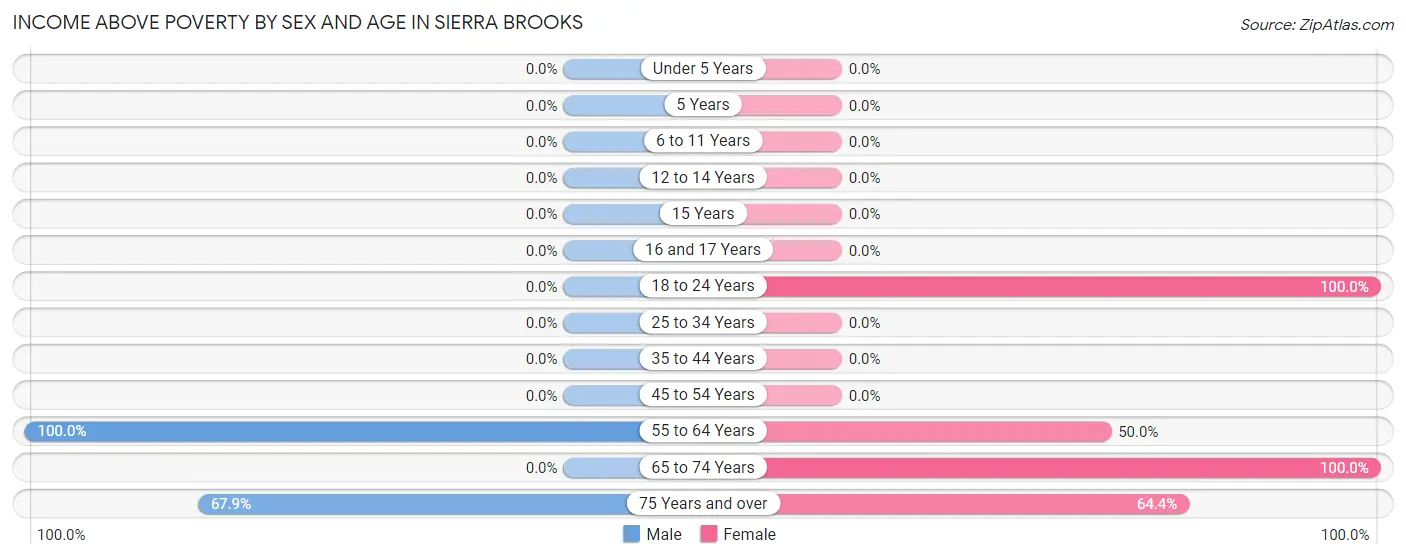
| Age Bracket | Male | Female |
| Under 5 Years | 0 (0.0%) | 0 (0.0%) |
| 5 Years | 0 (0.0%) | 0 (0.0%) |
| 6 to 11 Years | 0 (0.0%) | 0 (0.0%) |
| 12 to 14 Years | 0 (0.0%) | 0 (0.0%) |
| 15 Years | 0 (0.0%) | 0 (0.0%) |
| 16 and 17 Years | 0 (0.0%) | 0 (0.0%) |
| 18 to 24 Years | 0 (0.0%) | 153 (100.0%) |
| 25 to 34 Years | 0 (0.0%) | 0 (0.0%) |
| 35 to 44 Years | 0 (0.0%) | 0 (0.0%) |
| 45 to 54 Years | 0 (0.0%) | 0 (0.0%) |
| 55 to 64 Years | 75 (100.0%) | 22 (50.0%) |
| 65 to 74 Years | 0 (0.0%) | 29 (100.0%) |
| 75 Years and over | 76 (67.9%) | 58 (64.4%) |
| Total | 151 (80.7%) | 262 (82.9%) |
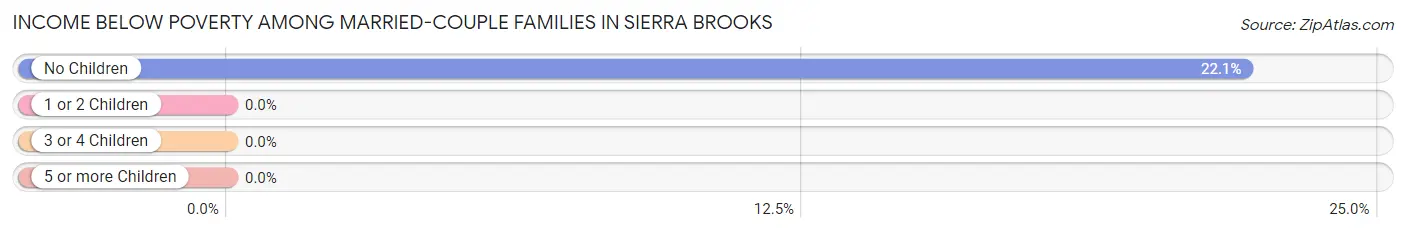
Income Below Poverty Among Married-Couple Families in Sierra Brooks
The poverty statistics for married-couple families in Sierra Brooks show that 22.1% or 36 of the total 163 families live below the poverty line. Families with no children have the highest poverty rate of 22.1%, comprising of 36 families. On the other hand, families with no children have the lowest poverty rate of 22.1%, which includes 36 families.
| Children | Above Poverty | Below Poverty |
| No Children | 127 (77.9%) | 36 (22.1%) |
| 1 or 2 Children | 0 (0.0%) | 0 (0.0%) |
| 3 or 4 Children | 0 (0.0%) | 0 (0.0%) |
| 5 or more Children | 0 (0.0%) | 0 (0.0%) |
| Total | 127 (77.9%) | 36 (22.1%) |
Income Below Poverty Among Single-Parent Households in Sierra Brooks
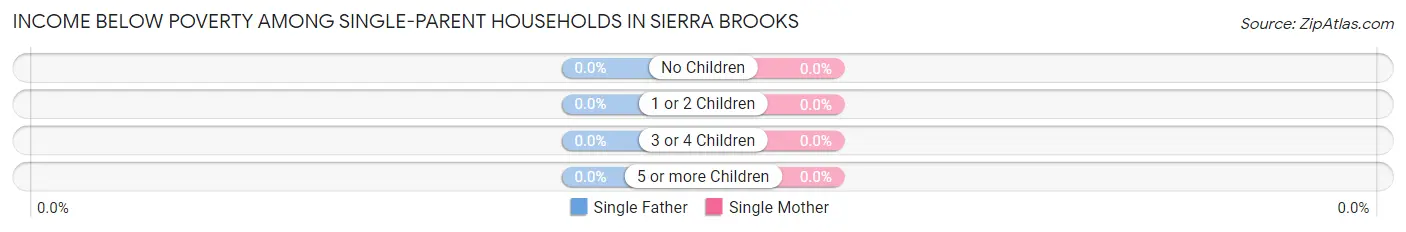
| Children | Single Father | Single Mother |
| No Children | 0 (0.0%) | 0 (0.0%) |
| 1 or 2 Children | 0 (0.0%) | 0 (0.0%) |
| 3 or 4 Children | 0 (0.0%) | 0 (0.0%) |
| 5 or more Children | 0 (0.0%) | 0 (0.0%) |
| Total | 0 (0.0%) | 0 (0.0%) |
Income Below Poverty Among Married-Couple vs Single-Parent Households in Sierra Brooks
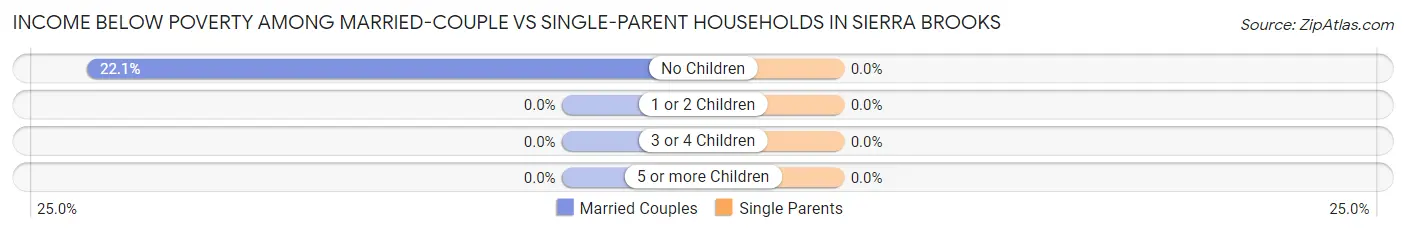
| Children | Married-Couple Families | Single-Parent Households |
| No Children | 36 (22.1%) | 0 (0.0%) |
| 1 or 2 Children | 0 (0.0%) | 0 (0.0%) |
| 3 or 4 Children | 0 (0.0%) | 0 (0.0%) |
| 5 or more Children | 0 (0.0%) | 0 (0.0%) |
| Total | 36 (22.1%) | 0 (0.0%) |
Race in Sierra Brooks
The most populous races in Sierra Brooks are White / Caucasian (452 | 89.9%), Hispanic or Latino (51 | 10.1%), and Native / Alaskan (51 | 10.1%).
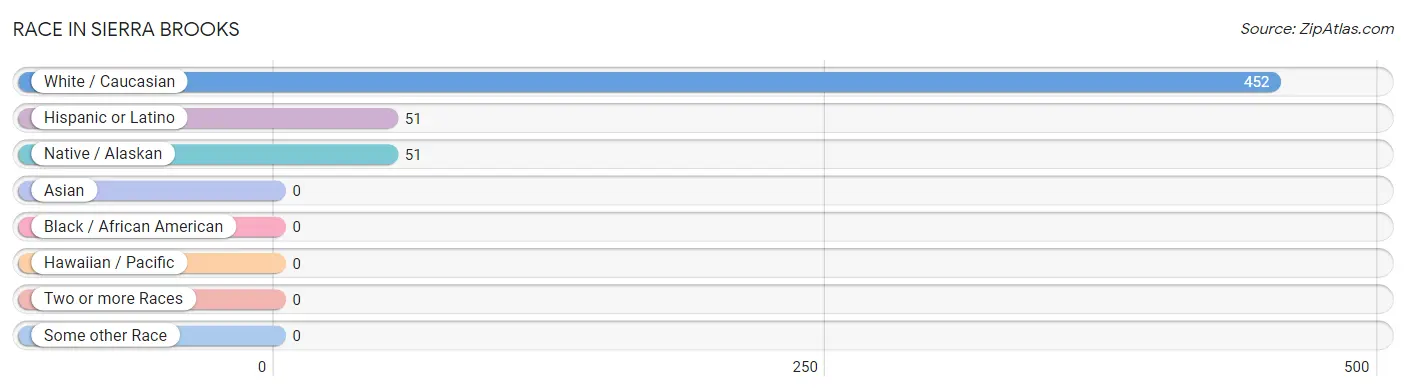
| Race | # Population | % Population |
| Asian | 0 | 0.0% |
| Black / African American | 0 | 0.0% |
| Hawaiian / Pacific | 0 | 0.0% |
| Hispanic or Latino | 51 | 10.1% |
| Native / Alaskan | 51 | 10.1% |
| White / Caucasian | 452 | 89.9% |
| Two or more Races | 0 | 0.0% |
| Some other Race | 0 | 0.0% |
| Total | 503 | 100.0% |
Ancestry in Sierra Brooks
The most populous ancestries reported in Sierra Brooks are English (91 | 18.1%), Mexican (51 | 10.1%), Irish (36 | 7.2%), Italian (29 | 5.8%), and Polish (29 | 5.8%), together accounting for 46.9% of all Sierra Brooks residents.
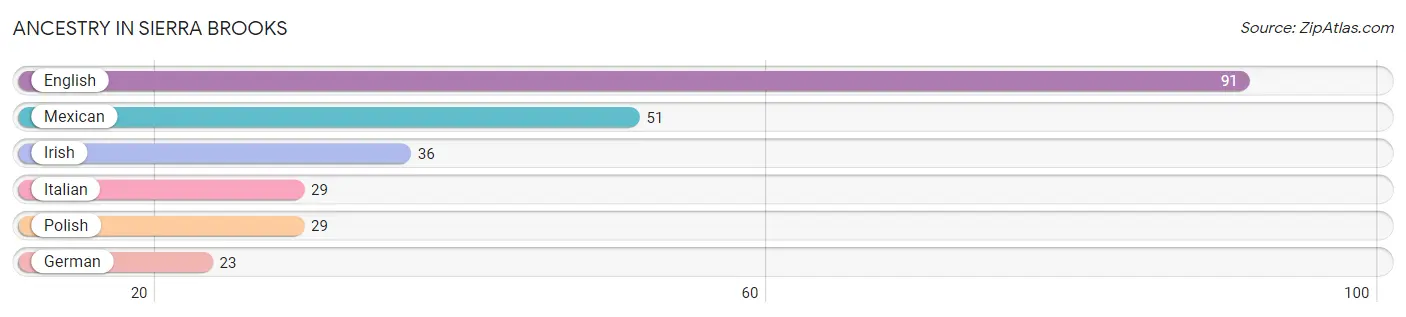
| Ancestry | # Population | % Population |
| English | 91 | 18.1% |
| German | 23 | 4.6% |
| Irish | 36 | 7.2% |
| Italian | 29 | 5.8% |
| Mexican | 51 | 10.1% |
| Polish | 29 | 5.8% | View All 6 Rows |
Immigrants in Sierra Brooks

| Immigration Origin | # Population | % Population | View All 0 Rows |
Sex and Age in Sierra Brooks
Sex and Age in Sierra Brooks
The most populous age groups in Sierra Brooks are 75 to 79 Years (112 | 59.9%) for men and 20 to 24 Years (153 | 48.4%) for women.
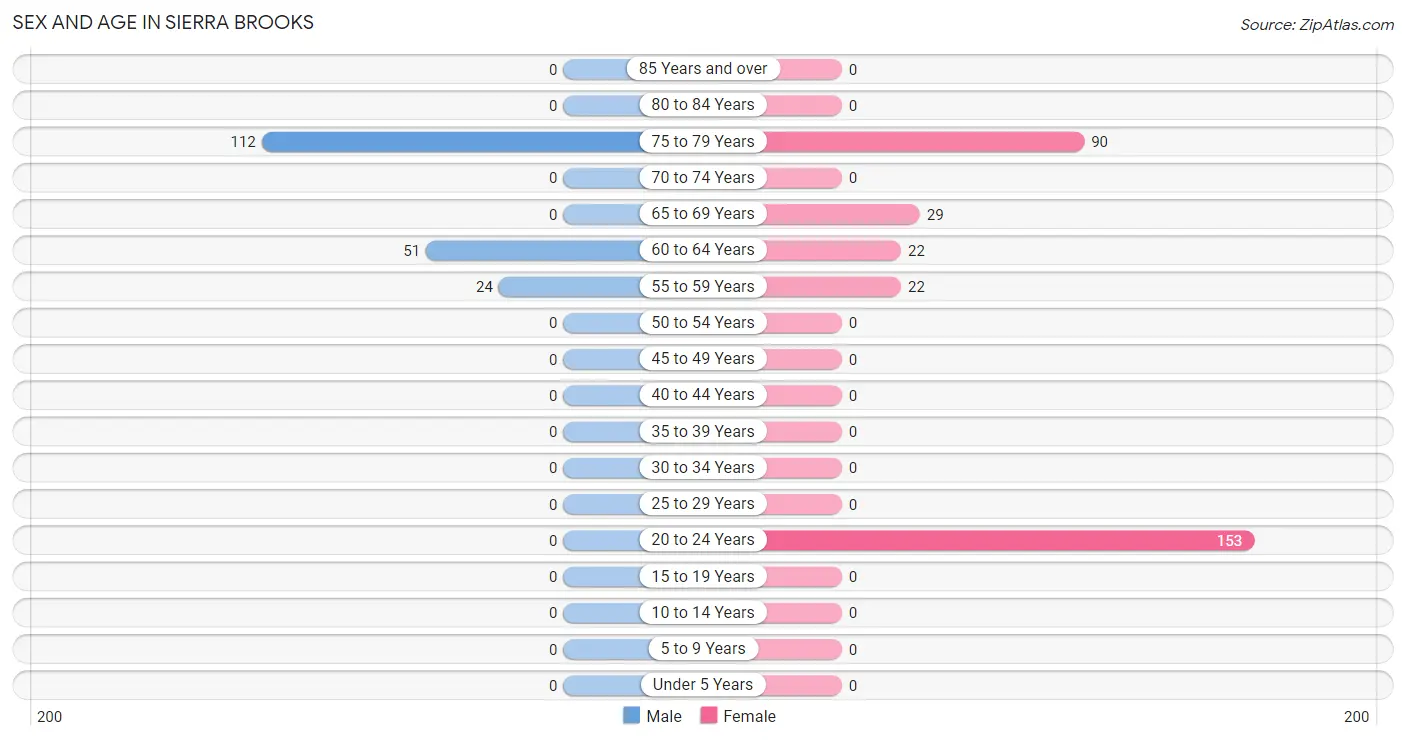
| Age Bracket | Male | Female |
| Under 5 Years | 0 (0.0%) | 0 (0.0%) |
| 5 to 9 Years | 0 (0.0%) | 0 (0.0%) |
| 10 to 14 Years | 0 (0.0%) | 0 (0.0%) |
| 15 to 19 Years | 0 (0.0%) | 0 (0.0%) |
| 20 to 24 Years | 0 (0.0%) | 153 (48.4%) |
| 25 to 29 Years | 0 (0.0%) | 0 (0.0%) |
| 30 to 34 Years | 0 (0.0%) | 0 (0.0%) |
| 35 to 39 Years | 0 (0.0%) | 0 (0.0%) |
| 40 to 44 Years | 0 (0.0%) | 0 (0.0%) |
| 45 to 49 Years | 0 (0.0%) | 0 (0.0%) |
| 50 to 54 Years | 0 (0.0%) | 0 (0.0%) |
| 55 to 59 Years | 24 (12.8%) | 22 (7.0%) |
| 60 to 64 Years | 51 (27.3%) | 22 (7.0%) |
| 65 to 69 Years | 0 (0.0%) | 29 (9.2%) |
| 70 to 74 Years | 0 (0.0%) | 0 (0.0%) |
| 75 to 79 Years | 112 (59.9%) | 90 (28.5%) |
| 80 to 84 Years | 0 (0.0%) | 0 (0.0%) |
| 85 Years and over | 0 (0.0%) | 0 (0.0%) |
| Total | 187 (100.0%) | 316 (100.0%) |
Families and Households in Sierra Brooks
Median Family Size in Sierra Brooks
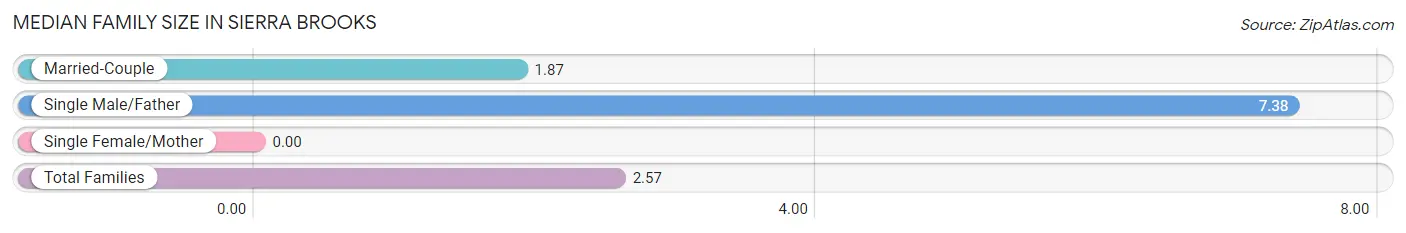
| Family Type | # Families | Family Size |
| Married-Couple | 163 (87.2%) | 1.87 |
| Single Male/Father | 24 (12.8%) | 7.38 |
| Single Female/Mother | 0 (0.0%) | - |
| Total Families | 187 (100.0%) | 2.57 |
Median Household Size in Sierra Brooks
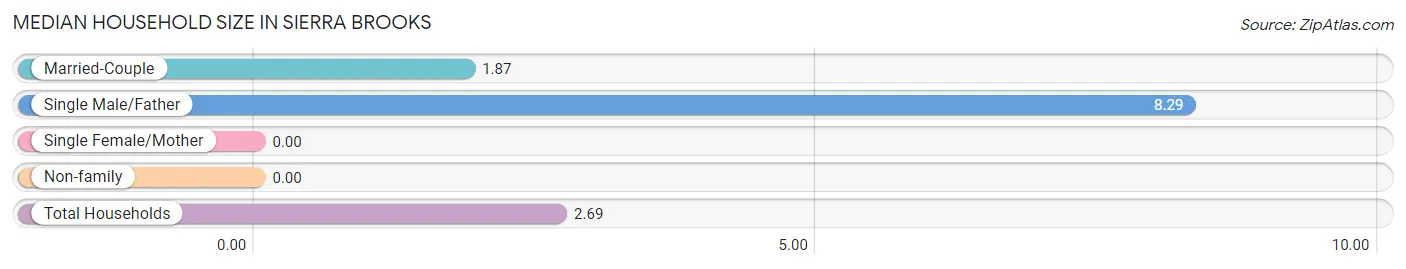
| Household Type | # Households | Household Size |
| Married-Couple | 163 (87.2%) | 1.87 |
| Single Male/Father | 24 (12.8%) | 8.29 |
| Single Female/Mother | 0 (0.0%) | - |
| Non-family | 0 (0.0%) | - |
| Total Households | 187 (100.0%) | 2.69 |
Household Size by Marriage Status in Sierra Brooks
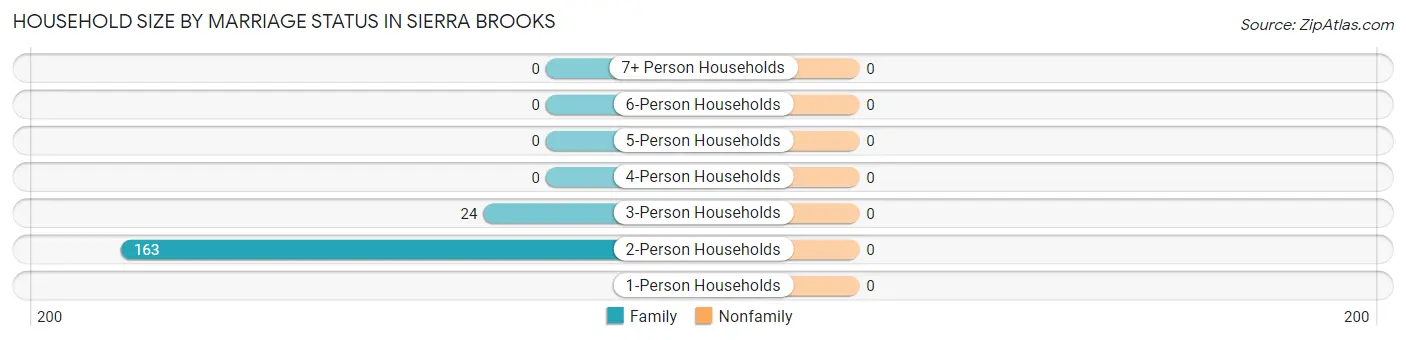
| Household Size | Family Households | Nonfamily Households |
| 1-Person Households | - | 0 (0.0%) |
| 2-Person Households | 163 (87.2%) | 0 (0.0%) |
| 3-Person Households | 24 (12.8%) | 0 (0.0%) |
| 4-Person Households | 0 (0.0%) | 0 (0.0%) |
| 5-Person Households | 0 (0.0%) | 0 (0.0%) |
| 6-Person Households | 0 (0.0%) | 0 (0.0%) |
| 7+ Person Households | 0 (0.0%) | 0 (0.0%) |
| Total | 187 (100.0%) | 0 (0.0%) |
Female Fertility in Sierra Brooks
Fertility by Age in Sierra Brooks
| Age Bracket | Women with Births | Births / 1,000 Women |
| 15 to 19 years | 0 (0.0%) | 0.0 |
| 20 to 34 years | 0 (0.0%) | 0.0 |
| 35 to 50 years | 0 (0.0%) | 0.0 |
| Total | 0 (0.0%) | 0.0 |
Fertility by Age by Marriage Status in Sierra Brooks
| Age Bracket | Married | Unmarried |
| 15 to 19 years | 0 (0.0%) | 0 (0.0%) |
| 20 to 34 years | 0 (0.0%) | 0 (0.0%) |
| 35 to 50 years | 0 (0.0%) | 0 (0.0%) |
| Total | 0 (0.0%) | 0 (0.0%) |
Fertility by Education in Sierra Brooks
| Educational Attainment | Women with Births | Births / 1,000 Women |
| Less than High School | 0 (0.0%) | 0.0 |
| High School Diploma | 0 (0.0%) | 0.0 |
| College or Associate's Degree | 0 (0.0%) | 0.0 |
| Bachelor's Degree | 0 (0.0%) | 0.0 |
| Graduate Degree | 0 (0.0%) | 0.0 |
| Total | 0 (0.0%) | 0.0 |
Fertility by Education by Marriage Status in Sierra Brooks
| Educational Attainment | Married | Unmarried |
| Less than High School | 0 (0.0%) | 0 (0.0%) |
| High School Diploma | 0 (0.0%) | 0 (0.0%) |
| College or Associate's Degree | 0 (0.0%) | 0 (0.0%) |
| Bachelor's Degree | 0 (0.0%) | 0 (0.0%) |
| Graduate Degree | 0 (0.0%) | 0 (0.0%) |
| Total | 0 (0.0%) | 0 (0.0%) |
Employment Characteristics in Sierra Brooks
Employment by Class of Employer in Sierra Brooks
Among the 259 employed individuals in Sierra Brooks, state government employees (153 | 59.1%), self-employed (not incorporated) (53 | 20.5%), and private company employees (29 | 11.2%) make up the most common classes of employment.
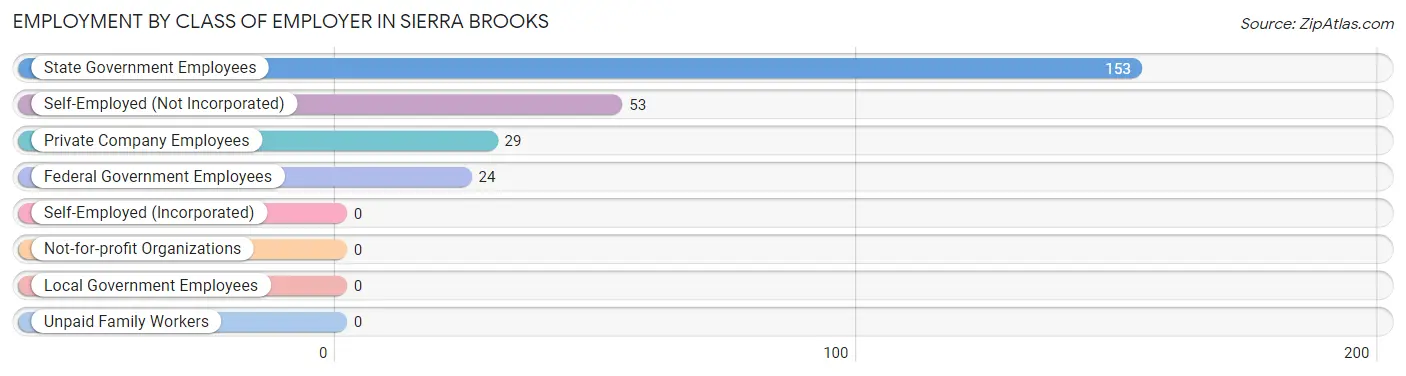
| Employer Class | # Employees | % Employees |
| Private Company Employees | 29 | 11.2% |
| Self-Employed (Incorporated) | 0 | 0.0% |
| Self-Employed (Not Incorporated) | 53 | 20.5% |
| Not-for-profit Organizations | 0 | 0.0% |
| Local Government Employees | 0 | 0.0% |
| State Government Employees | 153 | 59.1% |
| Federal Government Employees | 24 | 9.3% |
| Unpaid Family Workers | 0 | 0.0% |
| Total | 259 | 100.0% |
Employment Status by Age in Sierra Brooks
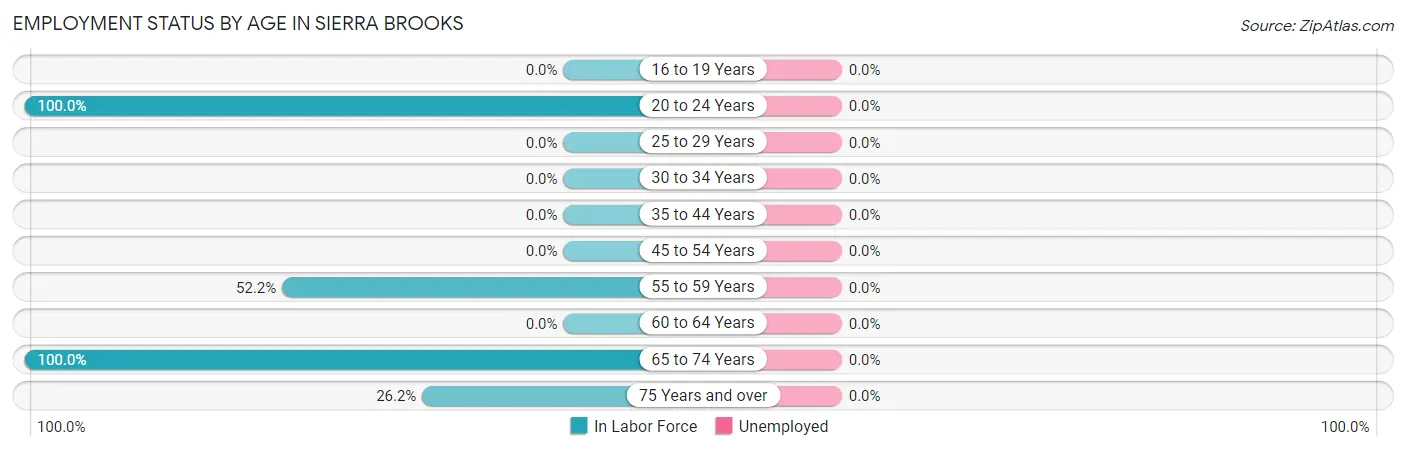
| Age Bracket | In Labor Force | Unemployed |
| 16 to 19 Years | 0 (0.0%) | 0 (0.0%) |
| 20 to 24 Years | 153 (100.0%) | 0 (0.0%) |
| 25 to 29 Years | 0 (0.0%) | 0 (0.0%) |
| 30 to 34 Years | 0 (0.0%) | 0 (0.0%) |
| 35 to 44 Years | 0 (0.0%) | 0 (0.0%) |
| 45 to 54 Years | 0 (0.0%) | 0 (0.0%) |
| 55 to 59 Years | 24 (52.2%) | 0 (0.0%) |
| 60 to 64 Years | 0 (0.0%) | 0 (0.0%) |
| 65 to 74 Years | 29 (100.0%) | 0 (0.0%) |
| 75 Years and over | 53 (26.2%) | 0 (0.0%) |
| Total | 259 (51.5%) | 0 (0.0%) |
Employment Status by Educational Attainment in Sierra Brooks
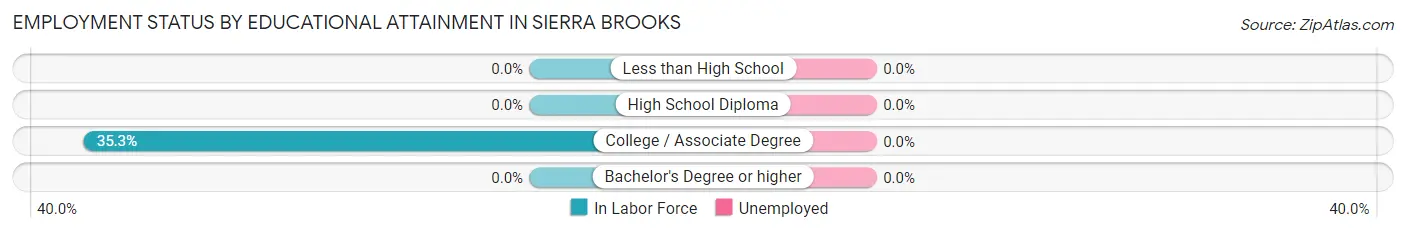
| Educational Attainment | In Labor Force | Unemployed |
| Less than High School | 0 (0.0%) | 0 (0.0%) |
| High School Diploma | 0 (0.0%) | 0 (0.0%) |
| College / Associate Degree | 24 (35.3%) | 0 (0.0%) |
| Bachelor's Degree or higher | 0 (0.0%) | 0 (0.0%) |
| Total | 24 (20.2%) | 0 (0.0%) |
Employment Occupations by Sex in Sierra Brooks
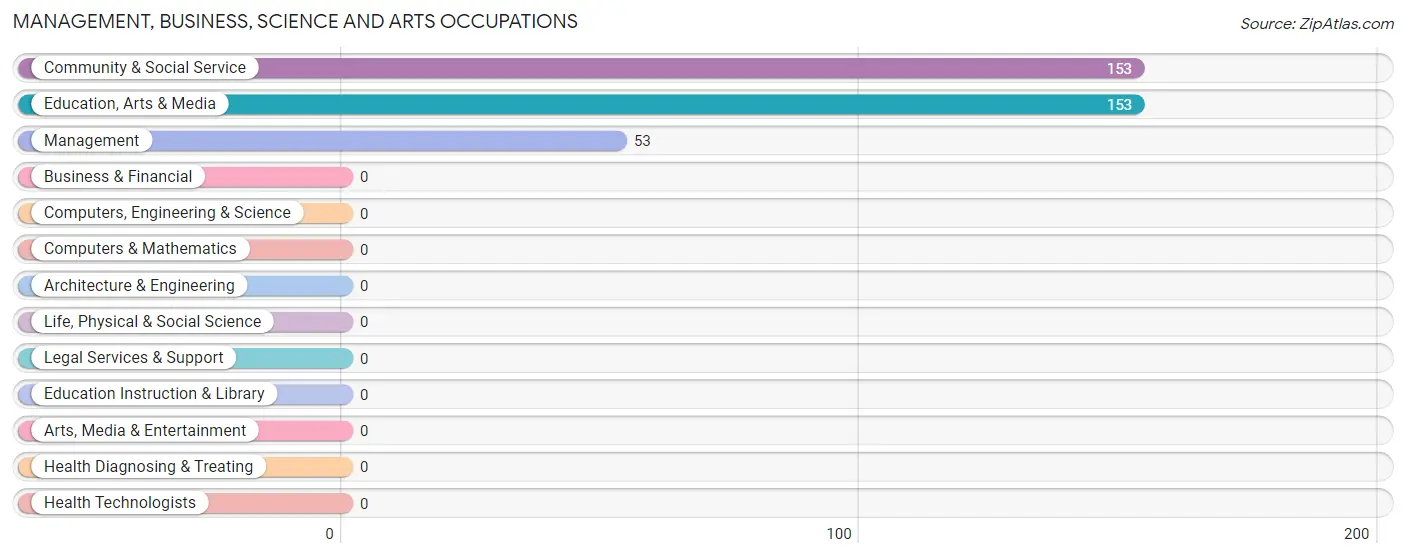
Management, Business, Science and Arts Occupations
The most common Management, Business, Science and Arts occupations in Sierra Brooks are Community & Social Service (153 | 59.1%), Education, Arts & Media (153 | 59.1%), and Management (53 | 20.5%).
Management, Business, Science and Arts Occupations by Sex
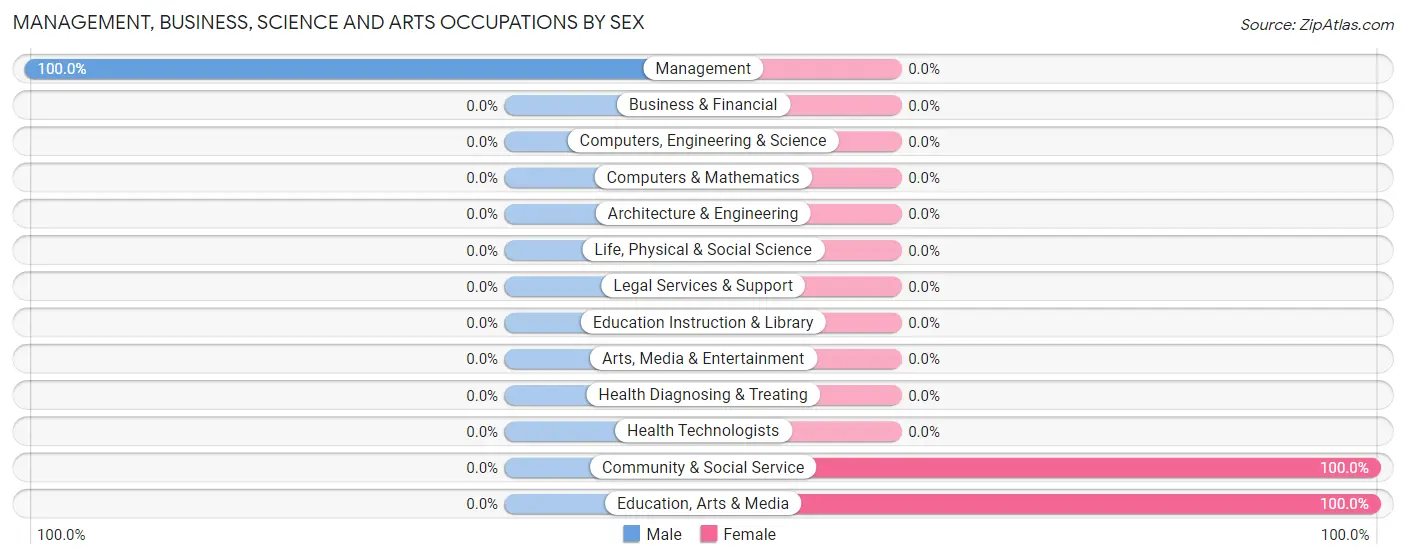
| Occupation | Male | Female |
| Management | 53 (100.0%) | 0 (0.0%) |
| Business & Financial | 0 (0.0%) | 0 (0.0%) |
| Computers, Engineering & Science | 0 (0.0%) | 0 (0.0%) |
| Computers & Mathematics | 0 (0.0%) | 0 (0.0%) |
| Architecture & Engineering | 0 (0.0%) | 0 (0.0%) |
| Life, Physical & Social Science | 0 (0.0%) | 0 (0.0%) |
| Community & Social Service | 0 (0.0%) | 153 (100.0%) |
| Education, Arts & Media | 0 (0.0%) | 153 (100.0%) |
| Legal Services & Support | 0 (0.0%) | 0 (0.0%) |
| Education Instruction & Library | 0 (0.0%) | 0 (0.0%) |
| Arts, Media & Entertainment | 0 (0.0%) | 0 (0.0%) |
| Health Diagnosing & Treating | 0 (0.0%) | 0 (0.0%) |
| Health Technologists | 0 (0.0%) | 0 (0.0%) |
| Total (Category) | 53 (25.7%) | 153 (74.3%) |
| Total (Overall) | 77 (29.7%) | 182 (70.3%) |
Services Occupations
Services Occupations by Sex
| Occupation | Male | Female |
| Healthcare Support | 0 (0.0%) | 0 (0.0%) |
| Security & Protection | 0 (0.0%) | 0 (0.0%) |
| Firefighting & Prevention | 0 (0.0%) | 0 (0.0%) |
| Law Enforcement | 0 (0.0%) | 0 (0.0%) |
| Food Preparation & Serving | 0 (0.0%) | 0 (0.0%) |
| Cleaning & Maintenance | 0 (0.0%) | 0 (0.0%) |
| Personal Care & Service | 0 (0.0%) | 0 (0.0%) |
| Total (Category) | 0 (0.0%) | 0 (0.0%) |
| Total (Overall) | 77 (29.7%) | 182 (70.3%) |
Sales and Office Occupations
The most common Sales and Office occupations in Sierra Brooks are , and Sales & Related (29 | 11.2%).
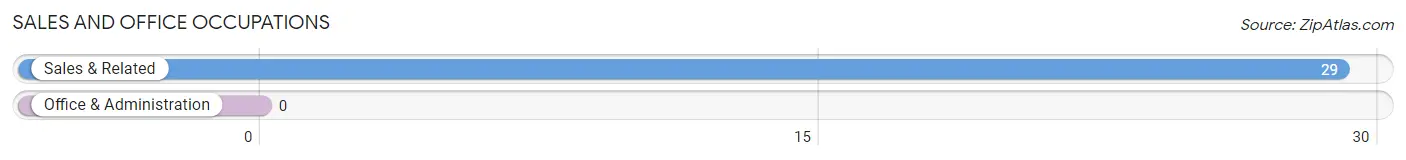
Sales and Office Occupations by Sex
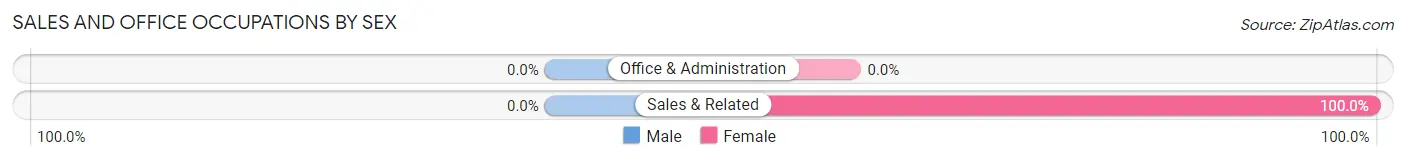
| Occupation | Male | Female |
| Sales & Related | 0 (0.0%) | 29 (100.0%) |
| Office & Administration | 0 (0.0%) | 0 (0.0%) |
| Total (Category) | 0 (0.0%) | 29 (100.0%) |
| Total (Overall) | 77 (29.7%) | 182 (70.3%) |
Natural Resources, Construction and Maintenance Occupations
The most common Natural Resources, Construction and Maintenance occupations in Sierra Brooks are , and Installation, Maintenance & Repair (24 | 9.3%).
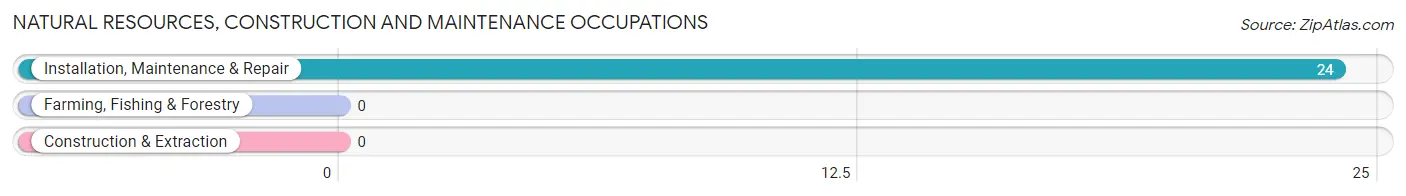
Natural Resources, Construction and Maintenance Occupations by Sex
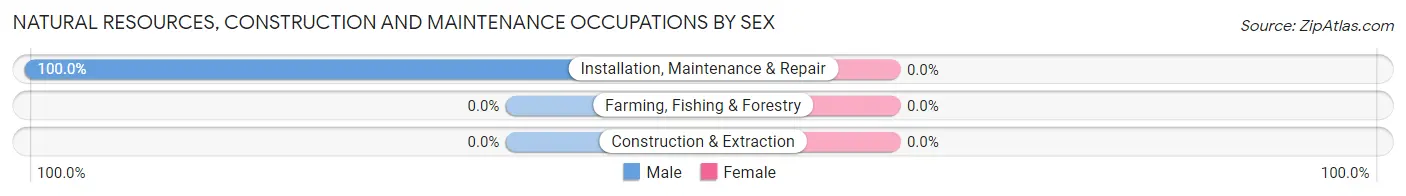
| Occupation | Male | Female |
| Farming, Fishing & Forestry | 0 (0.0%) | 0 (0.0%) |
| Construction & Extraction | 0 (0.0%) | 0 (0.0%) |
| Installation, Maintenance & Repair | 24 (100.0%) | 0 (0.0%) |
| Total (Category) | 24 (100.0%) | 0 (0.0%) |
| Total (Overall) | 77 (29.7%) | 182 (70.3%) |
Production, Transportation and Moving Occupations
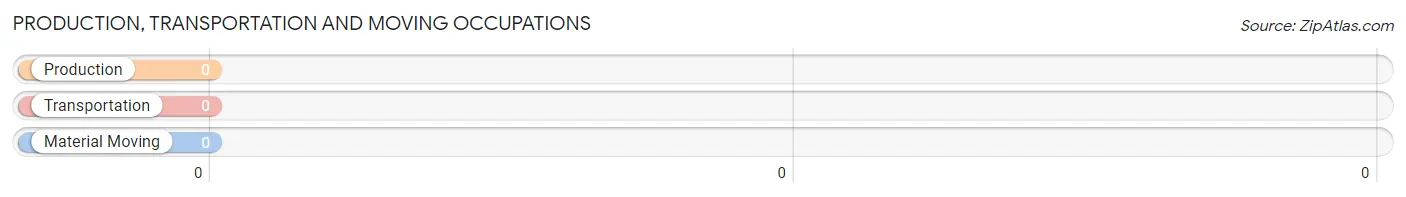
Production, Transportation and Moving Occupations by Sex
| Occupation | Male | Female |
| Production | 0 (0.0%) | 0 (0.0%) |
| Transportation | 0 (0.0%) | 0 (0.0%) |
| Material Moving | 0 (0.0%) | 0 (0.0%) |
| Total (Category) | 0 (0.0%) | 0 (0.0%) |
| Total (Overall) | 77 (29.7%) | 182 (70.3%) |
Employment Industries by Sex in Sierra Brooks
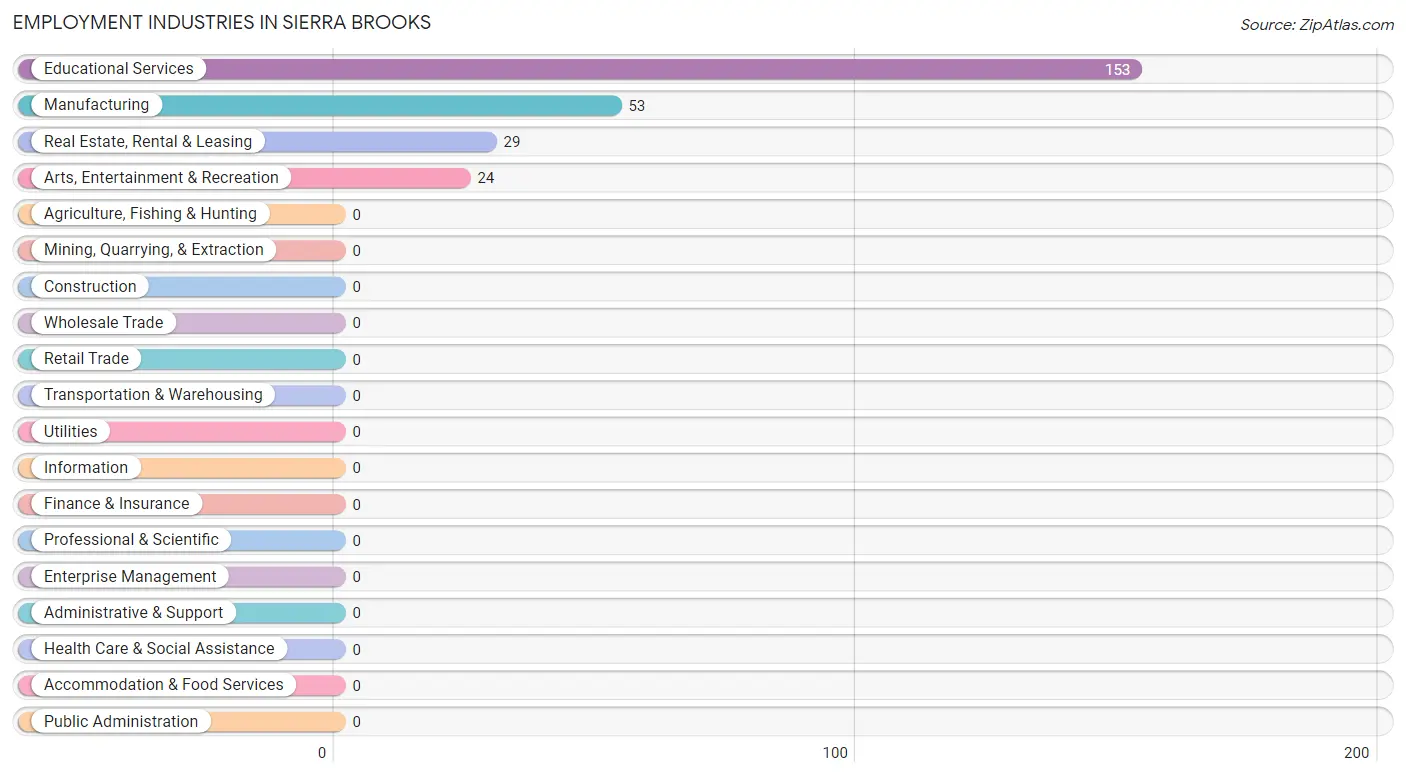
Employment Industries in Sierra Brooks
The major employment industries in Sierra Brooks include Educational Services (153 | 59.1%), Manufacturing (53 | 20.5%), Real Estate, Rental & Leasing (29 | 11.2%), and Arts, Entertainment & Recreation (24 | 9.3%).
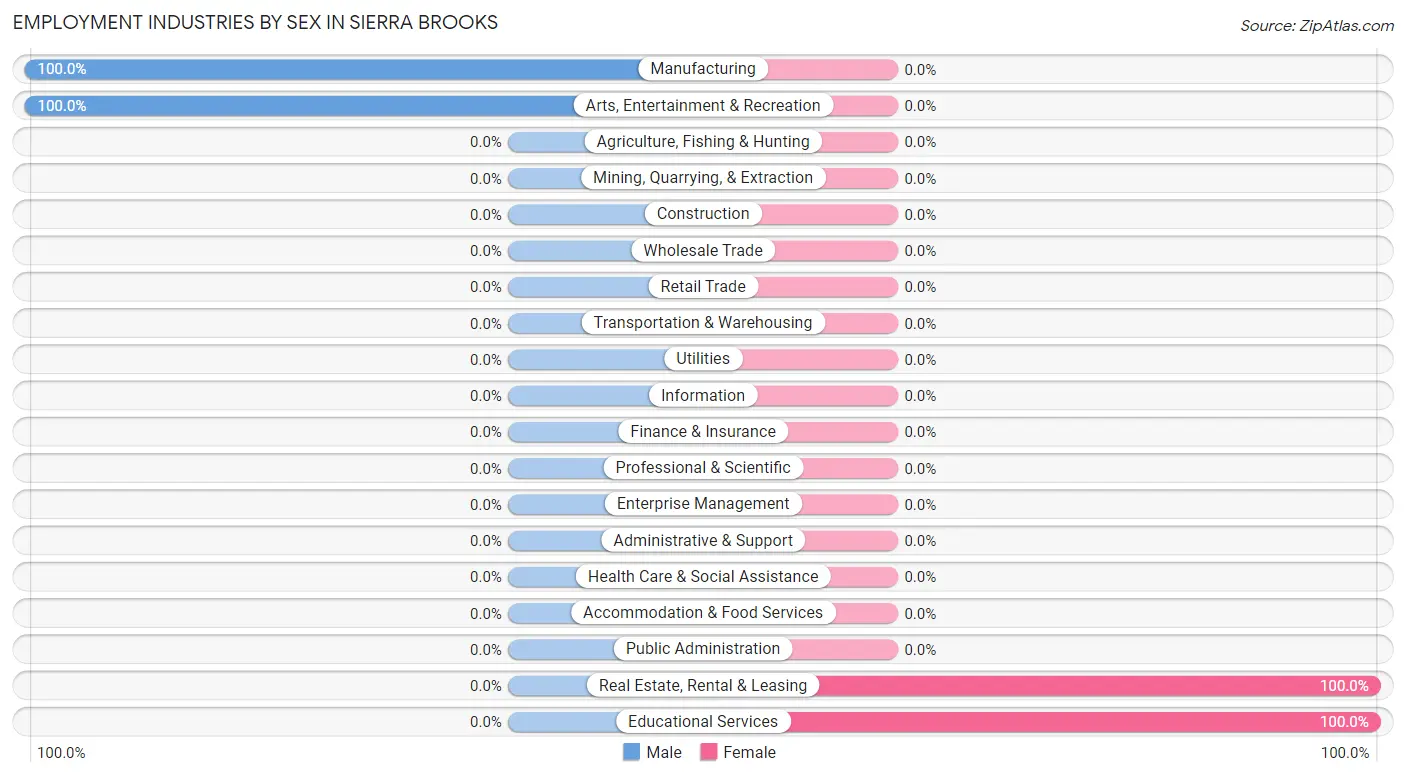
Employment Industries by Sex in Sierra Brooks
The Sierra Brooks industries that see more men than women are Manufacturing (100.0%), and Arts, Entertainment & Recreation (100.0%), whereas the industries that tend to have a higher number of women are Real Estate, Rental & Leasing (100.0%), and Educational Services (100.0%).
| Industry | Male | Female |
| Agriculture, Fishing & Hunting | 0 (0.0%) | 0 (0.0%) |
| Mining, Quarrying, & Extraction | 0 (0.0%) | 0 (0.0%) |
| Construction | 0 (0.0%) | 0 (0.0%) |
| Manufacturing | 53 (100.0%) | 0 (0.0%) |
| Wholesale Trade | 0 (0.0%) | 0 (0.0%) |
| Retail Trade | 0 (0.0%) | 0 (0.0%) |
| Transportation & Warehousing | 0 (0.0%) | 0 (0.0%) |
| Utilities | 0 (0.0%) | 0 (0.0%) |
| Information | 0 (0.0%) | 0 (0.0%) |
| Finance & Insurance | 0 (0.0%) | 0 (0.0%) |
| Real Estate, Rental & Leasing | 0 (0.0%) | 29 (100.0%) |
| Professional & Scientific | 0 (0.0%) | 0 (0.0%) |
| Enterprise Management | 0 (0.0%) | 0 (0.0%) |
| Administrative & Support | 0 (0.0%) | 0 (0.0%) |
| Educational Services | 0 (0.0%) | 153 (100.0%) |
| Health Care & Social Assistance | 0 (0.0%) | 0 (0.0%) |
| Arts, Entertainment & Recreation | 24 (100.0%) | 0 (0.0%) |
| Accommodation & Food Services | 0 (0.0%) | 0 (0.0%) |
| Public Administration | 0 (0.0%) | 0 (0.0%) |
| Total | 77 (29.7%) | 182 (70.3%) |
Education in Sierra Brooks
School Enrollment in Sierra Brooks
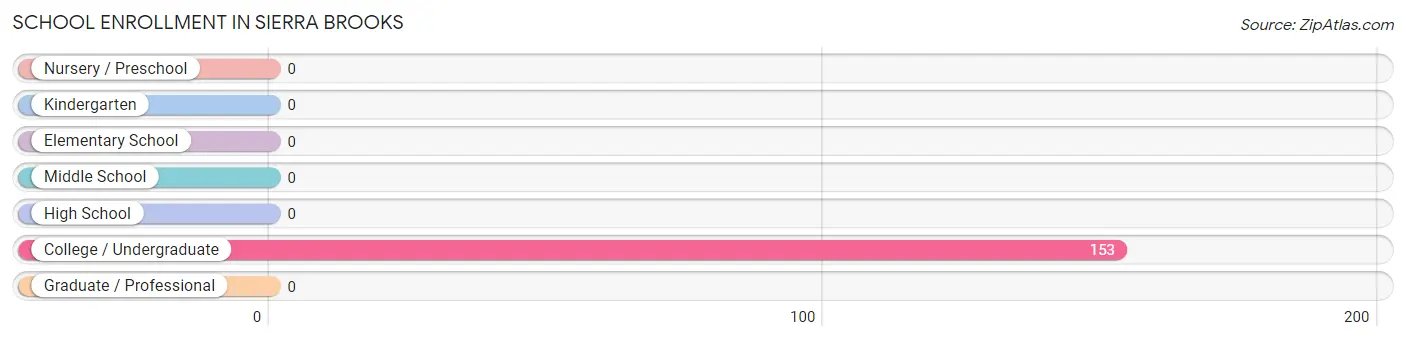
| School Level | # Students | % Students |
| Nursery / Preschool | 0 | 0.0% |
| Kindergarten | 0 | 0.0% |
| Elementary School | 0 | 0.0% |
| Middle School | 0 | 0.0% |
| High School | 0 | 0.0% |
| College / Undergraduate | 153 | 100.0% |
| Graduate / Professional | 0 | 0.0% |
| Total | 153 | 100.0% |
School Enrollment by Age by Funding Source in Sierra Brooks
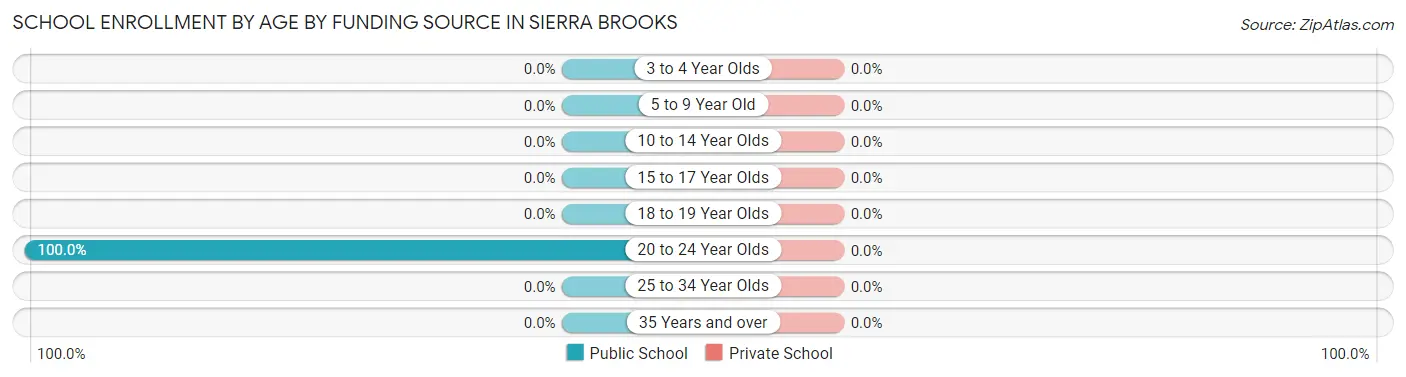
| Age Bracket | Public School | Private School |
| 3 to 4 Year Olds | 0 (0.0%) | 0 (0.0%) |
| 5 to 9 Year Old | 0 (0.0%) | 0 (0.0%) |
| 10 to 14 Year Olds | 0 (0.0%) | 0 (0.0%) |
| 15 to 17 Year Olds | 0 (0.0%) | 0 (0.0%) |
| 18 to 19 Year Olds | 0 (0.0%) | 0 (0.0%) |
| 20 to 24 Year Olds | 153 (100.0%) | 0 (0.0%) |
| 25 to 34 Year Olds | 0 (0.0%) | 0 (0.0%) |
| 35 Years and over | 0 (0.0%) | 0 (0.0%) |
| Total | 153 (100.0%) | 0 (0.0%) |
Educational Attainment by Field of Study in Sierra Brooks
, and education (29 | 100.0%) are the most common fields of study among 29 individuals in Sierra Brooks who have obtained a bachelor's degree or higher.
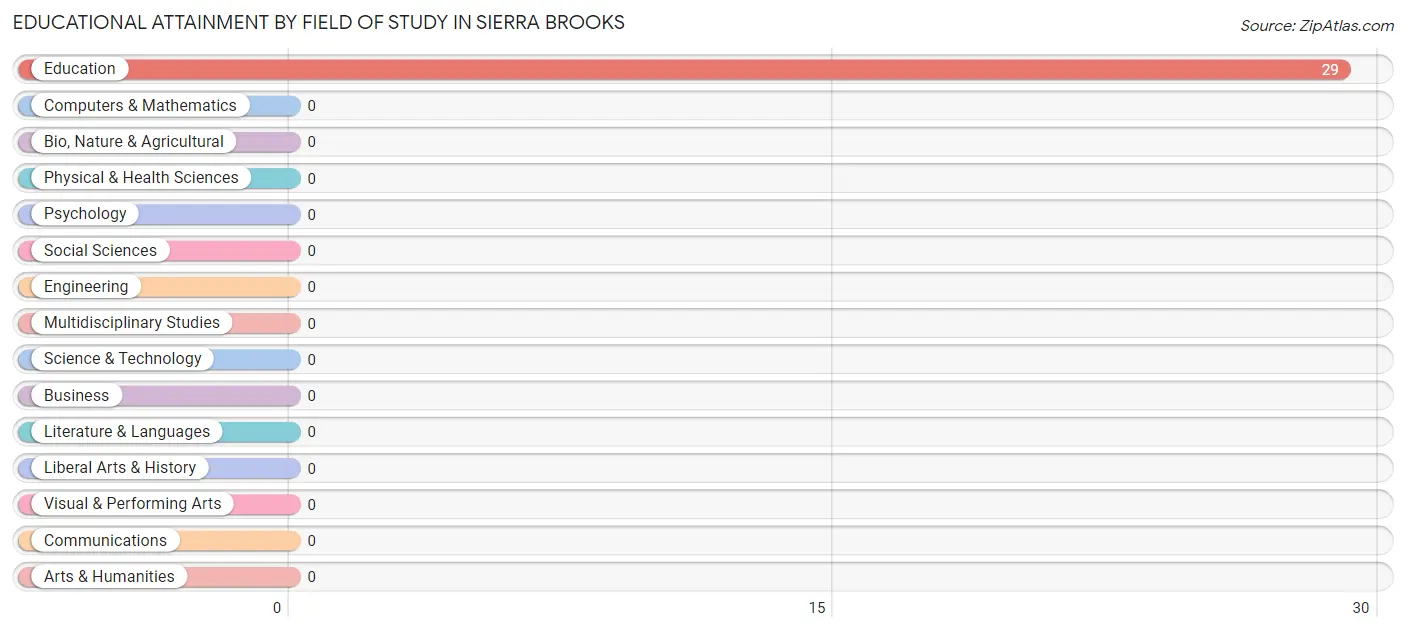
| Field of Study | # Graduates | % Graduates |
| Computers & Mathematics | 0 | 0.0% |
| Bio, Nature & Agricultural | 0 | 0.0% |
| Physical & Health Sciences | 0 | 0.0% |
| Psychology | 0 | 0.0% |
| Social Sciences | 0 | 0.0% |
| Engineering | 0 | 0.0% |
| Multidisciplinary Studies | 0 | 0.0% |
| Science & Technology | 0 | 0.0% |
| Business | 0 | 0.0% |
| Education | 29 | 100.0% |
| Literature & Languages | 0 | 0.0% |
| Liberal Arts & History | 0 | 0.0% |
| Visual & Performing Arts | 0 | 0.0% |
| Communications | 0 | 0.0% |
| Arts & Humanities | 0 | 0.0% |
| Total | 29 | 100.0% |
Transportation & Commute in Sierra Brooks
Vehicle Availability by Sex in Sierra Brooks
The most prevalent vehicle ownership categories in Sierra Brooks are males with 2 vehicles (53, accounting for 68.8%) and females with 2 vehicles (29, making up 29.1%).
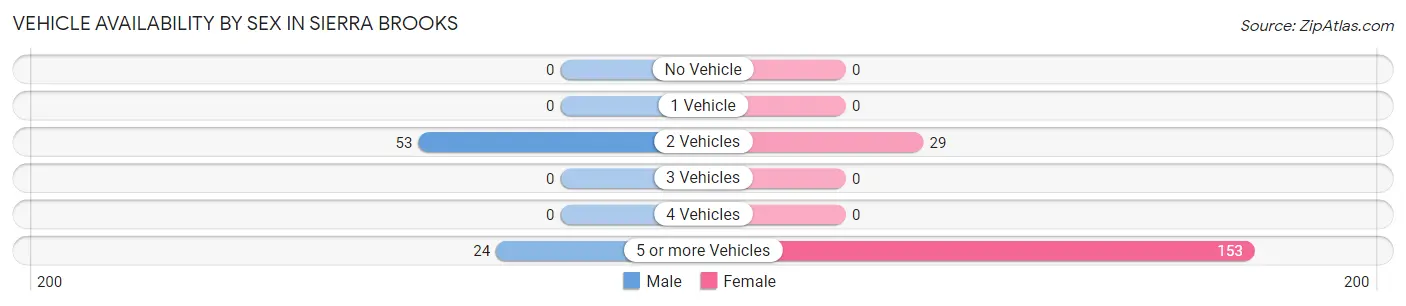
| Vehicles Available | Male | Female |
| No Vehicle | 0 (0.0%) | 0 (0.0%) |
| 1 Vehicle | 0 (0.0%) | 0 (0.0%) |
| 2 Vehicles | 53 (68.8%) | 29 (15.9%) |
| 3 Vehicles | 0 (0.0%) | 0 (0.0%) |
| 4 Vehicles | 0 (0.0%) | 0 (0.0%) |
| 5 or more Vehicles | 24 (31.2%) | 153 (84.1%) |
| Total | 77 (100.0%) | 182 (100.0%) |
Commute Time in Sierra Brooks
The most frequently occuring commute durations in Sierra Brooks are 30 to 34 minutes (153 commuters, 59.1%), less than 5 minutes (53 commuters, 20.5%), and 35 to 39 minutes (29 commuters, 11.2%).
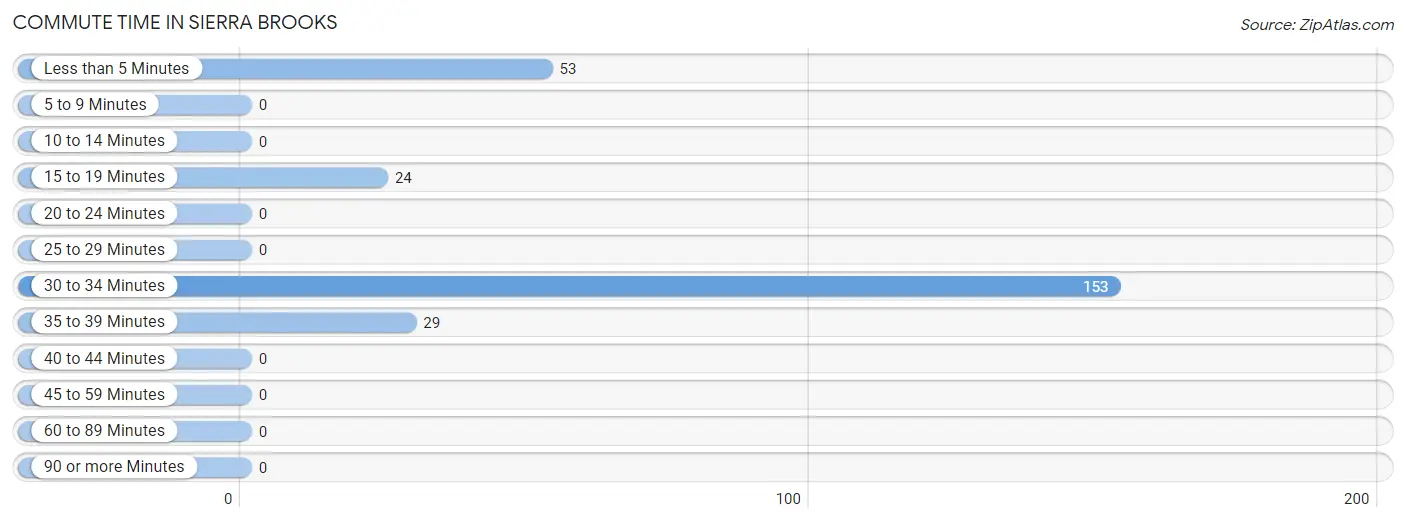
| Commute Time | # Commuters | % Commuters |
| Less than 5 Minutes | 53 | 20.5% |
| 5 to 9 Minutes | 0 | 0.0% |
| 10 to 14 Minutes | 0 | 0.0% |
| 15 to 19 Minutes | 24 | 9.3% |
| 20 to 24 Minutes | 0 | 0.0% |
| 25 to 29 Minutes | 0 | 0.0% |
| 30 to 34 Minutes | 153 | 59.1% |
| 35 to 39 Minutes | 29 | 11.2% |
| 40 to 44 Minutes | 0 | 0.0% |
| 45 to 59 Minutes | 0 | 0.0% |
| 60 to 89 Minutes | 0 | 0.0% |
| 90 or more Minutes | 0 | 0.0% |
Commute Time by Sex in Sierra Brooks
The most common commute times in Sierra Brooks are less than 5 minutes (53 commuters, 68.8%) for males and 30 to 34 minutes (153 commuters, 84.1%) for females.
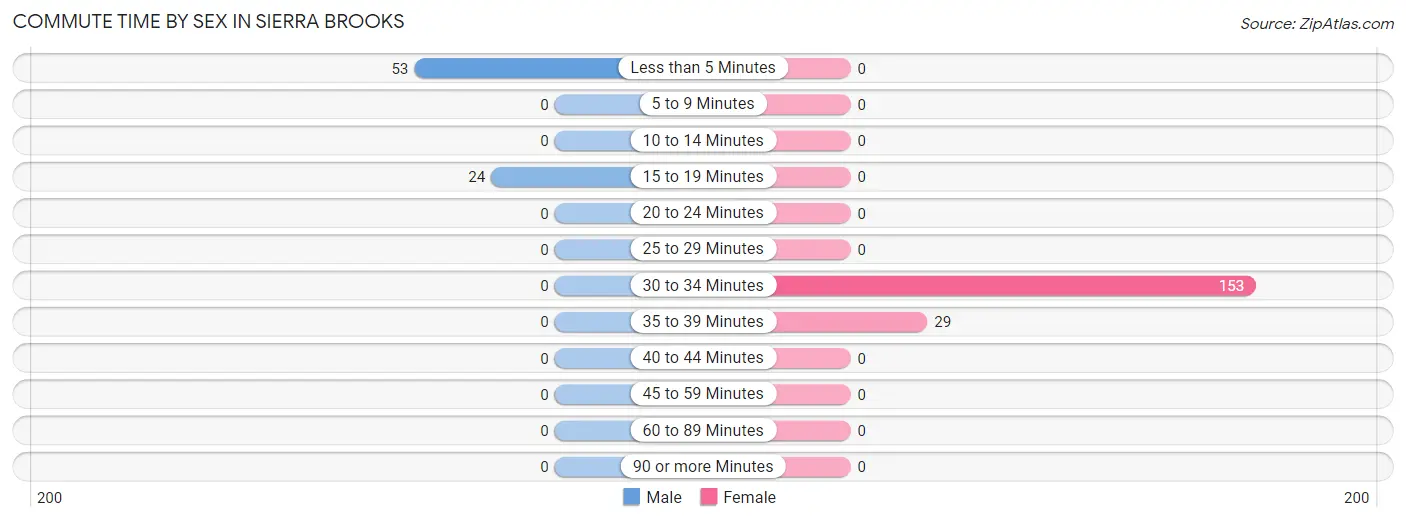
| Commute Time | Male | Female |
| Less than 5 Minutes | 53 (68.8%) | 0 (0.0%) |
| 5 to 9 Minutes | 0 (0.0%) | 0 (0.0%) |
| 10 to 14 Minutes | 0 (0.0%) | 0 (0.0%) |
| 15 to 19 Minutes | 24 (31.2%) | 0 (0.0%) |
| 20 to 24 Minutes | 0 (0.0%) | 0 (0.0%) |
| 25 to 29 Minutes | 0 (0.0%) | 0 (0.0%) |
| 30 to 34 Minutes | 0 (0.0%) | 153 (84.1%) |
| 35 to 39 Minutes | 0 (0.0%) | 29 (15.9%) |
| 40 to 44 Minutes | 0 (0.0%) | 0 (0.0%) |
| 45 to 59 Minutes | 0 (0.0%) | 0 (0.0%) |
| 60 to 89 Minutes | 0 (0.0%) | 0 (0.0%) |
| 90 or more Minutes | 0 (0.0%) | 0 (0.0%) |
Time of Departure to Work by Sex in Sierra Brooks
The most frequent times of departure to work in Sierra Brooks are 7:30 AM to 7:59 AM (53, 68.8%) for males and 8:30 AM to 8:59 AM (153, 84.1%) for females.
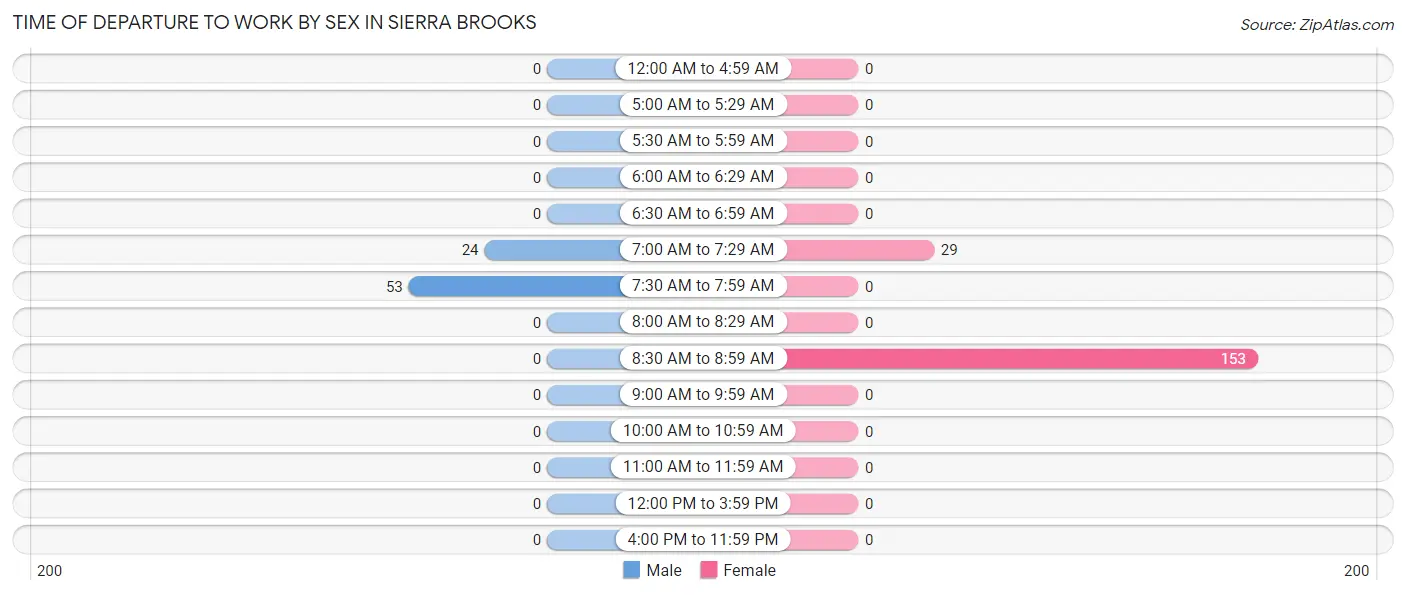
| Time of Departure | Male | Female |
| 12:00 AM to 4:59 AM | 0 (0.0%) | 0 (0.0%) |
| 5:00 AM to 5:29 AM | 0 (0.0%) | 0 (0.0%) |
| 5:30 AM to 5:59 AM | 0 (0.0%) | 0 (0.0%) |
| 6:00 AM to 6:29 AM | 0 (0.0%) | 0 (0.0%) |
| 6:30 AM to 6:59 AM | 0 (0.0%) | 0 (0.0%) |
| 7:00 AM to 7:29 AM | 24 (31.2%) | 29 (15.9%) |
| 7:30 AM to 7:59 AM | 53 (68.8%) | 0 (0.0%) |
| 8:00 AM to 8:29 AM | 0 (0.0%) | 0 (0.0%) |
| 8:30 AM to 8:59 AM | 0 (0.0%) | 153 (84.1%) |
| 9:00 AM to 9:59 AM | 0 (0.0%) | 0 (0.0%) |
| 10:00 AM to 10:59 AM | 0 (0.0%) | 0 (0.0%) |
| 11:00 AM to 11:59 AM | 0 (0.0%) | 0 (0.0%) |
| 12:00 PM to 3:59 PM | 0 (0.0%) | 0 (0.0%) |
| 4:00 PM to 11:59 PM | 0 (0.0%) | 0 (0.0%) |
| Total | 77 (100.0%) | 182 (100.0%) |
Housing Occupancy in Sierra Brooks
Occupancy by Ownership in Sierra Brooks
Of the total 187 dwellings in Sierra Brooks, owner-occupied units account for 187 (100.0%), while renter-occupied units make up 0 (0.0%).
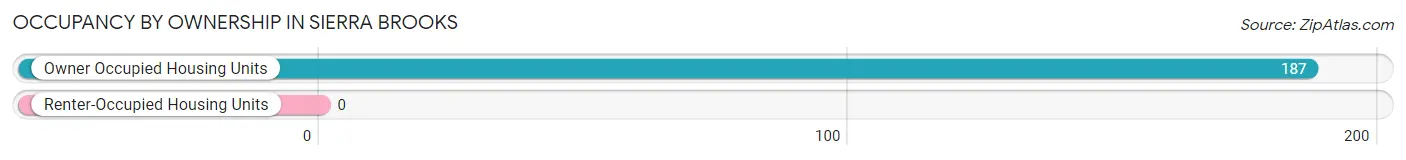
| Occupancy | # Housing Units | % Housing Units |
| Owner Occupied Housing Units | 187 | 100.0% |
| Renter-Occupied Housing Units | 0 | 0.0% |
| Total Occupied Housing Units | 187 | 100.0% |
Occupancy by Household Size in Sierra Brooks
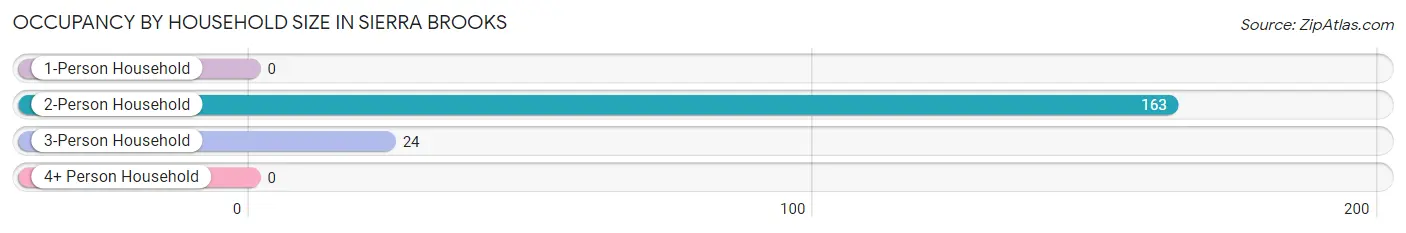
| Household Size | # Housing Units | % Housing Units |
| 1-Person Household | 0 | 0.0% |
| 2-Person Household | 163 | 87.2% |
| 3-Person Household | 24 | 12.8% |
| 4+ Person Household | 0 | 0.0% |
| Total Housing Units | 187 | 100.0% |
Occupancy by Ownership by Household Size in Sierra Brooks
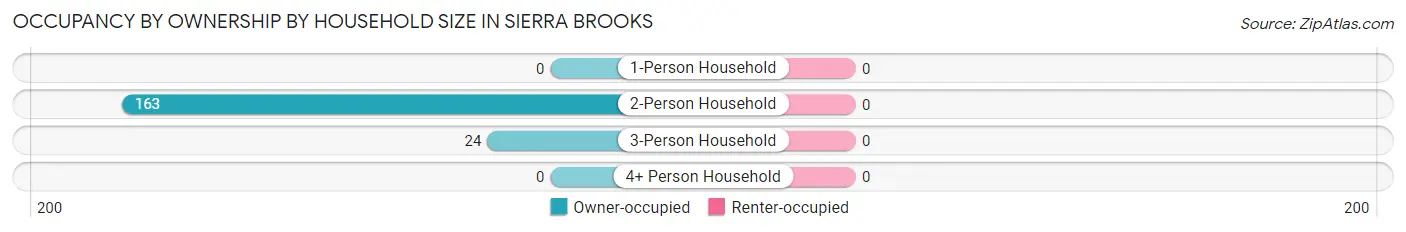
| Household Size | Owner-occupied | Renter-occupied |
| 1-Person Household | 0 (0.0%) | 0 (0.0%) |
| 2-Person Household | 163 (100.0%) | 0 (0.0%) |
| 3-Person Household | 24 (100.0%) | 0 (0.0%) |
| 4+ Person Household | 0 (0.0%) | 0 (0.0%) |
| Total Housing Units | 187 (100.0%) | 0 (0.0%) |
Occupancy by Educational Attainment in Sierra Brooks
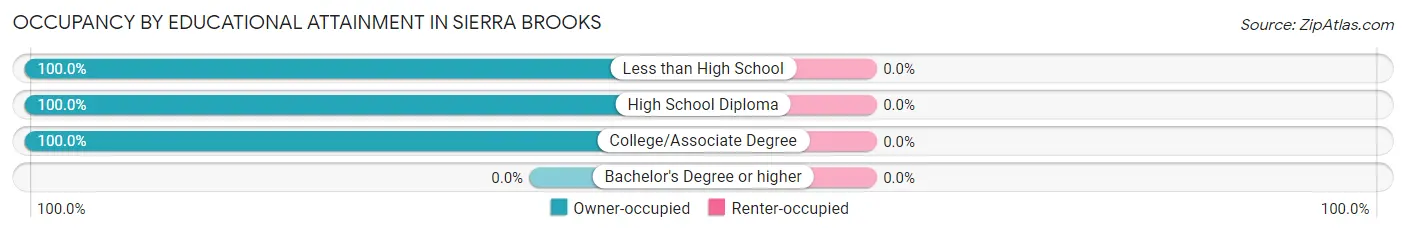
| Household Size | Owner-occupied | Renter-occupied |
| Less than High School | 51 (100.0%) | 0 (0.0%) |
| High School Diploma | 23 (100.0%) | 0 (0.0%) |
| College/Associate Degree | 113 (100.0%) | 0 (0.0%) |
| Bachelor's Degree or higher | 0 (0.0%) | 0 (0.0%) |
Occupancy by Age of Householder in Sierra Brooks
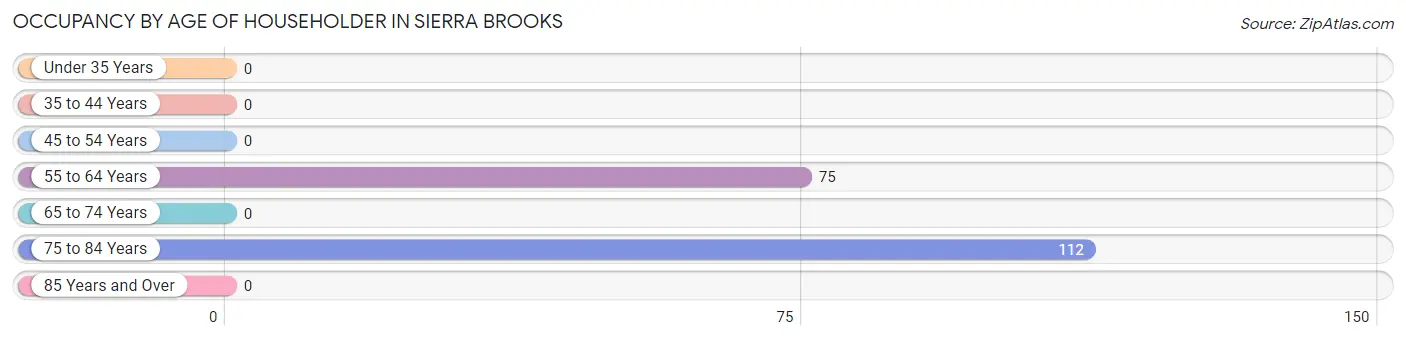
| Age Bracket | # Households | % Households |
| Under 35 Years | 0 | 0.0% |
| 35 to 44 Years | 0 | 0.0% |
| 45 to 54 Years | 0 | 0.0% |
| 55 to 64 Years | 75 | 40.1% |
| 65 to 74 Years | 0 | 0.0% |
| 75 to 84 Years | 112 | 59.9% |
| 85 Years and Over | 0 | 0.0% |
| Total | 187 | 100.0% |
Housing Finances in Sierra Brooks
Median Income by Occupancy in Sierra Brooks
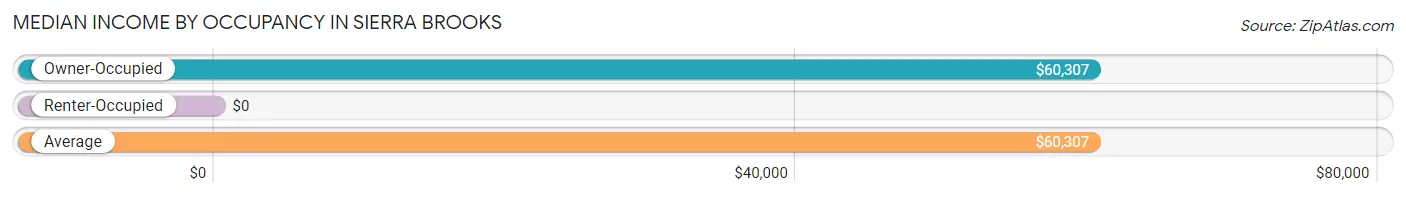
| Occupancy Type | # Households | Median Income |
| Owner-Occupied | 187 (100.0%) | $60,307 |
| Renter-Occupied | 0 (0.0%) | $0 |
| Average | 187 (100.0%) | $60,307 |
Occupancy by Householder Income Bracket in Sierra Brooks
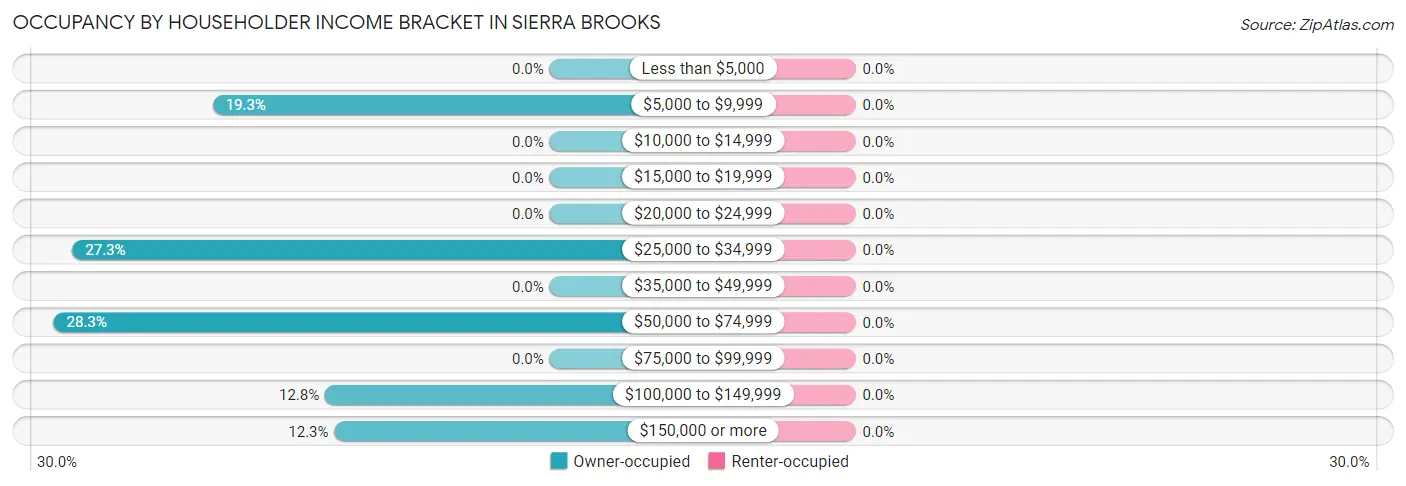
| Income Bracket | Owner-occupied | Renter-occupied |
| Less than $5,000 | 0 (0.0%) | 0 (0.0%) |
| $5,000 to $9,999 | 36 (19.3%) | 0 (0.0%) |
| $10,000 to $14,999 | 0 (0.0%) | 0 (0.0%) |
| $15,000 to $19,999 | 0 (0.0%) | 0 (0.0%) |
| $20,000 to $24,999 | 0 (0.0%) | 0 (0.0%) |
| $25,000 to $34,999 | 51 (27.3%) | 0 (0.0%) |
| $35,000 to $49,999 | 0 (0.0%) | 0 (0.0%) |
| $50,000 to $74,999 | 53 (28.3%) | 0 (0.0%) |
| $75,000 to $99,999 | 0 (0.0%) | 0 (0.0%) |
| $100,000 to $149,999 | 24 (12.8%) | 0 (0.0%) |
| $150,000 or more | 23 (12.3%) | 0 (0.0%) |
| Total | 187 (100.0%) | 0 (0.0%) |
Monthly Housing Cost Tiers in Sierra Brooks
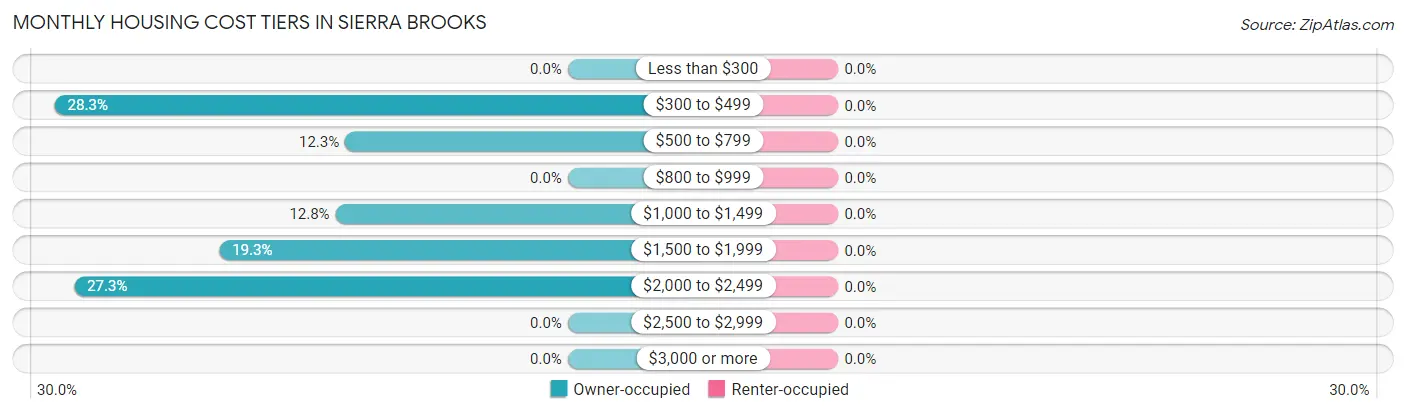
| Monthly Cost | Owner-occupied | Renter-occupied |
| Less than $300 | 0 (0.0%) | 0 (0.0%) |
| $300 to $499 | 53 (28.3%) | 0 (0.0%) |
| $500 to $799 | 23 (12.3%) | 0 (0.0%) |
| $800 to $999 | 0 (0.0%) | 0 (0.0%) |
| $1,000 to $1,499 | 24 (12.8%) | 0 (0.0%) |
| $1,500 to $1,999 | 36 (19.3%) | 0 (0.0%) |
| $2,000 to $2,499 | 51 (27.3%) | 0 (0.0%) |
| $2,500 to $2,999 | 0 (0.0%) | 0 (0.0%) |
| $3,000 or more | 0 (0.0%) | 0 (0.0%) |
| Total | 187 (100.0%) | 0 (0.0%) |
Physical Housing Characteristics in Sierra Brooks
Housing Structures in Sierra Brooks
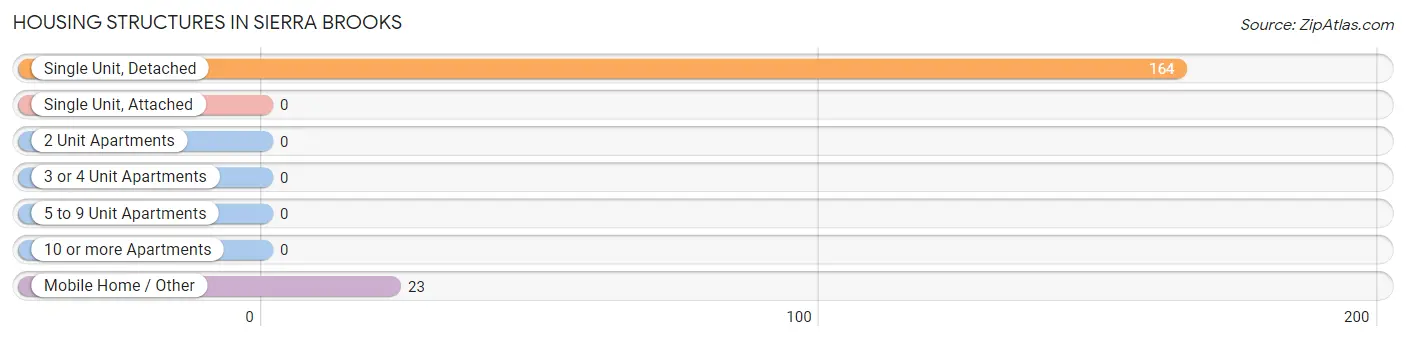
| Structure Type | # Housing Units | % Housing Units |
| Single Unit, Detached | 164 | 87.7% |
| Single Unit, Attached | 0 | 0.0% |
| 2 Unit Apartments | 0 | 0.0% |
| 3 or 4 Unit Apartments | 0 | 0.0% |
| 5 to 9 Unit Apartments | 0 | 0.0% |
| 10 or more Apartments | 0 | 0.0% |
| Mobile Home / Other | 23 | 12.3% |
| Total | 187 | 100.0% |
Housing Structures by Occupancy in Sierra Brooks
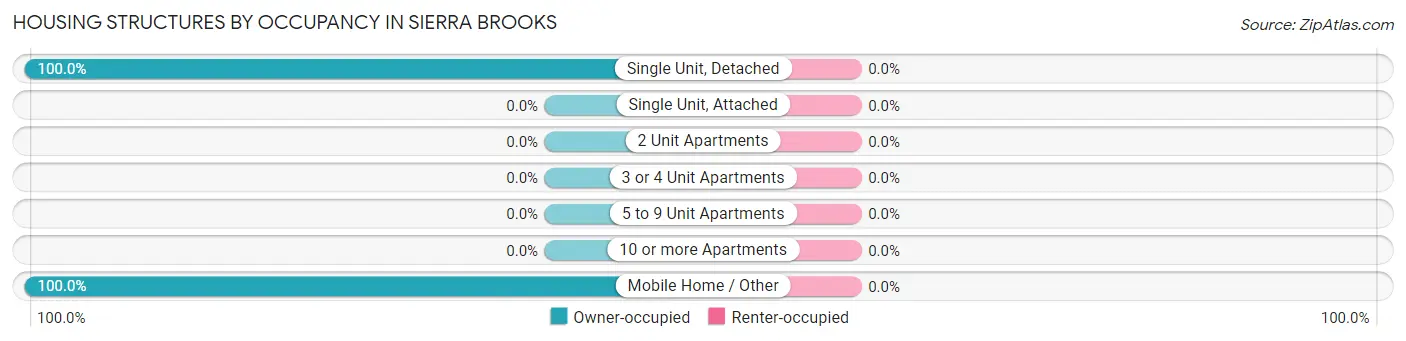
| Structure Type | Owner-occupied | Renter-occupied |
| Single Unit, Detached | 164 (100.0%) | 0 (0.0%) |
| Single Unit, Attached | 0 (0.0%) | 0 (0.0%) |
| 2 Unit Apartments | 0 (0.0%) | 0 (0.0%) |
| 3 or 4 Unit Apartments | 0 (0.0%) | 0 (0.0%) |
| 5 to 9 Unit Apartments | 0 (0.0%) | 0 (0.0%) |
| 10 or more Apartments | 0 (0.0%) | 0 (0.0%) |
| Mobile Home / Other | 23 (100.0%) | 0 (0.0%) |
| Total | 187 (100.0%) | 0 (0.0%) |
Housing Structures by Number of Rooms in Sierra Brooks
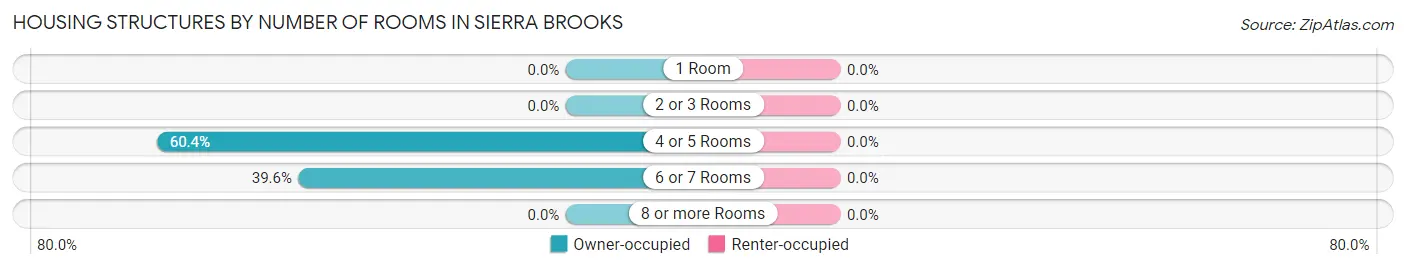
| Number of Rooms | Owner-occupied | Renter-occupied |
| 1 Room | 0 (0.0%) | 0 (0.0%) |
| 2 or 3 Rooms | 0 (0.0%) | 0 (0.0%) |
| 4 or 5 Rooms | 113 (60.4%) | 0 (0.0%) |
| 6 or 7 Rooms | 74 (39.6%) | 0 (0.0%) |
| 8 or more Rooms | 0 (0.0%) | 0 (0.0%) |
| Total | 187 (100.0%) | 0 (0.0%) |
Housing Structure by Heating Type in Sierra Brooks
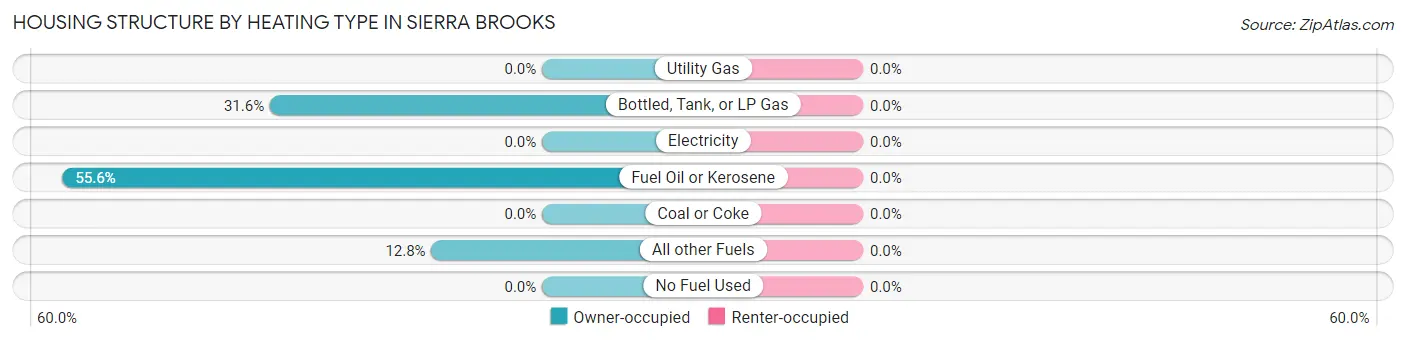
| Heating Type | Owner-occupied | Renter-occupied |
| Utility Gas | 0 (0.0%) | 0 (0.0%) |
| Bottled, Tank, or LP Gas | 59 (31.6%) | 0 (0.0%) |
| Electricity | 0 (0.0%) | 0 (0.0%) |
| Fuel Oil or Kerosene | 104 (55.6%) | 0 (0.0%) |
| Coal or Coke | 0 (0.0%) | 0 (0.0%) |
| All other Fuels | 24 (12.8%) | 0 (0.0%) |
| No Fuel Used | 0 (0.0%) | 0 (0.0%) |
| Total | 187 (100.0%) | 0 (0.0%) |
Household Vehicle Usage in Sierra Brooks
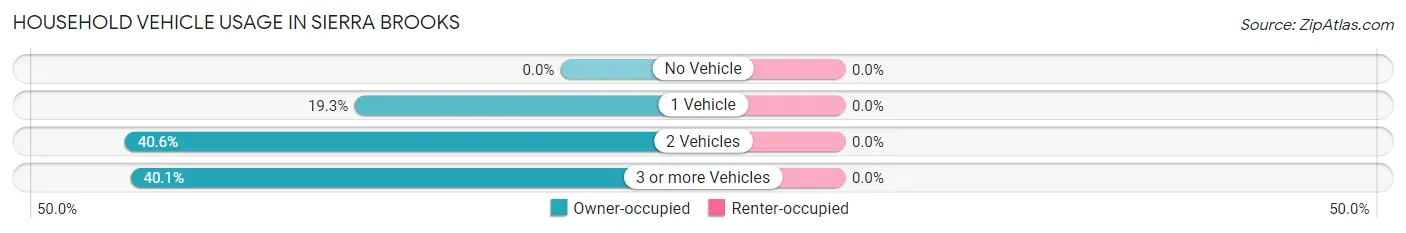
| Vehicles per Household | Owner-occupied | Renter-occupied |
| No Vehicle | 0 (0.0%) | 0 (0.0%) |
| 1 Vehicle | 36 (19.3%) | 0 (0.0%) |
| 2 Vehicles | 76 (40.6%) | 0 (0.0%) |
| 3 or more Vehicles | 75 (40.1%) | 0 (0.0%) |
| Total | 187 (100.0%) | 0 (0.0%) |
Real Estate & Mortgages in Sierra Brooks
Real Estate and Mortgage Overview in Sierra Brooks
| Characteristic | Without Mortgage | With Mortgage |
| Housing Units | 76 | 111 |
| Median Property Value | - | - |
| Median Household Income | - | - |
| Monthly Housing Costs | - | - |
| Real Estate Taxes | - | - |
Property Value by Mortgage Status in Sierra Brooks
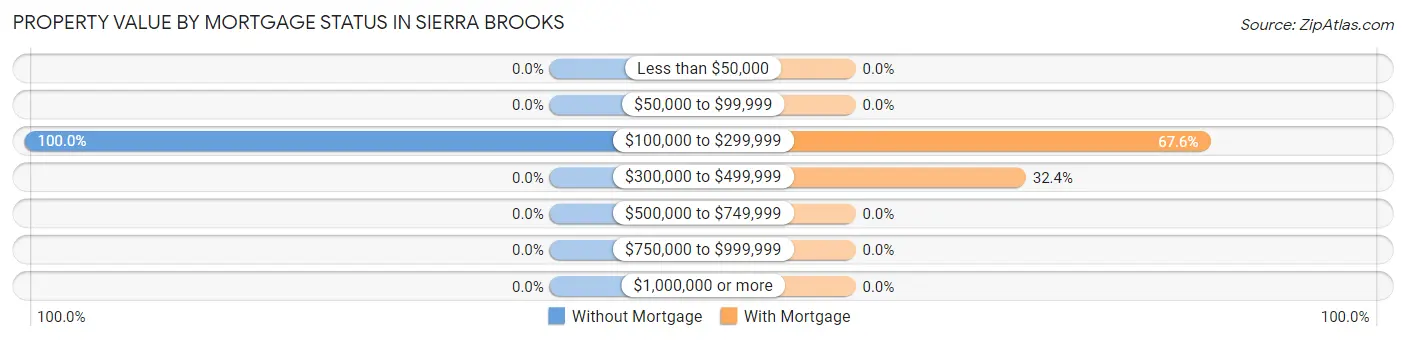
| Property Value | Without Mortgage | With Mortgage |
| Less than $50,000 | 0 (0.0%) | 0 (0.0%) |
| $50,000 to $99,999 | 0 (0.0%) | 0 (0.0%) |
| $100,000 to $299,999 | 76 (100.0%) | 75 (67.6%) |
| $300,000 to $499,999 | 0 (0.0%) | 36 (32.4%) |
| $500,000 to $749,999 | 0 (0.0%) | 0 (0.0%) |
| $750,000 to $999,999 | 0 (0.0%) | 0 (0.0%) |
| $1,000,000 or more | 0 (0.0%) | 0 (0.0%) |
| Total | 76 (100.0%) | 111 (100.0%) |
Household Income by Mortgage Status in Sierra Brooks
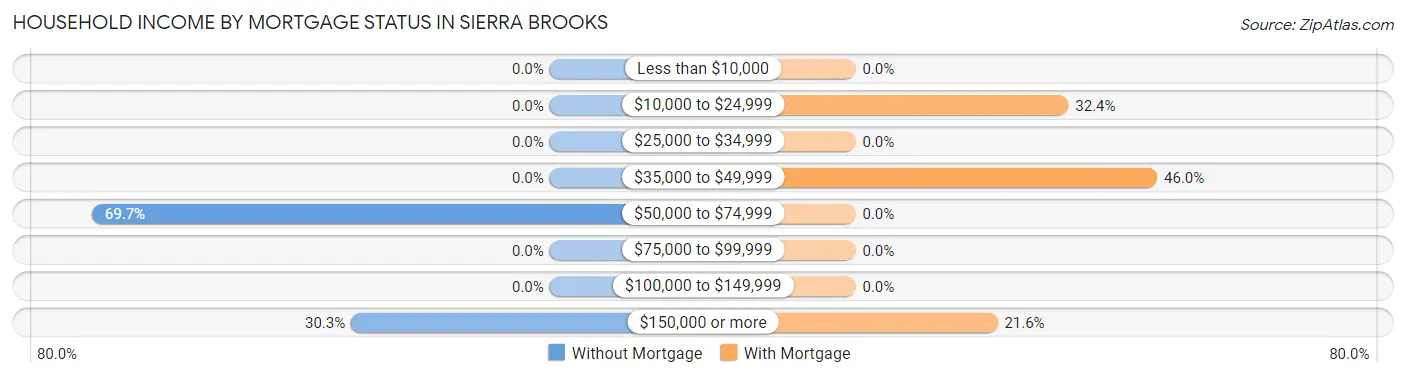
| Household Income | Without Mortgage | With Mortgage |
| Less than $10,000 | 0 (0.0%) | 0 (0.0%) |
| $10,000 to $24,999 | 0 (0.0%) | 36 (32.4%) |
| $25,000 to $34,999 | 0 (0.0%) | 0 (0.0%) |
| $35,000 to $49,999 | 0 (0.0%) | 51 (46.0%) |
| $50,000 to $74,999 | 53 (69.7%) | 0 (0.0%) |
| $75,000 to $99,999 | 0 (0.0%) | 0 (0.0%) |
| $100,000 to $149,999 | 0 (0.0%) | 0 (0.0%) |
| $150,000 or more | 23 (30.3%) | 24 (21.6%) |
| Total | 76 (100.0%) | 111 (100.0%) |
Property Value to Household Income Ratio in Sierra Brooks
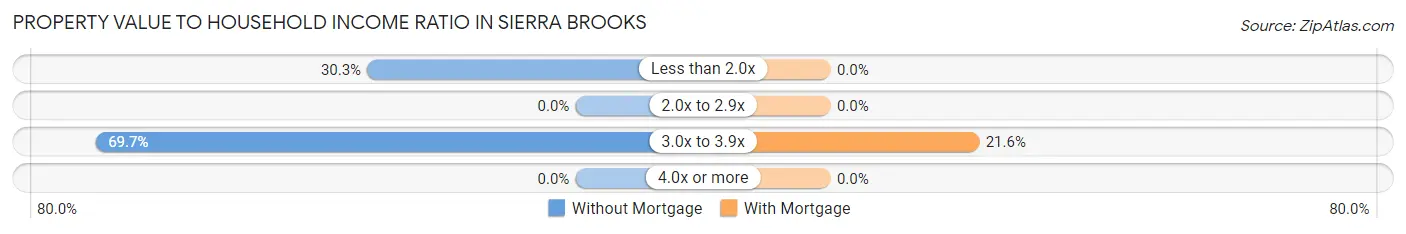
| Value-to-Income Ratio | Without Mortgage | With Mortgage |
| Less than 2.0x | 23 (30.3%) | 0 (0.0%) |
| 2.0x to 2.9x | 0 (0.0%) | 0 (0.0%) |
| 3.0x to 3.9x | 53 (69.7%) | 24 (21.6%) |
| 4.0x or more | 0 (0.0%) | 0 (0.0%) |
| Total | 76 (100.0%) | 111 (100.0%) |
Real Estate Taxes by Mortgage Status in Sierra Brooks
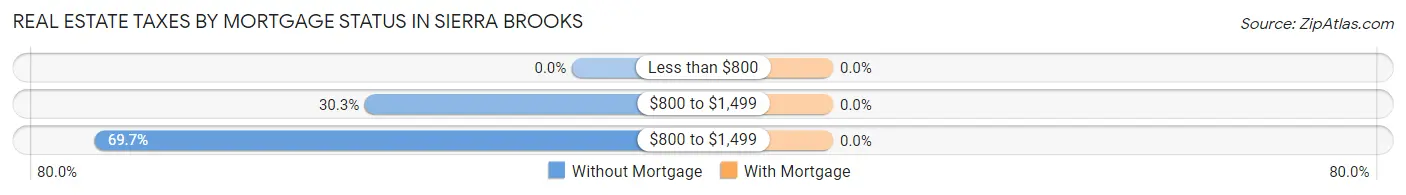
| Property Taxes | Without Mortgage | With Mortgage |
| Less than $800 | 0 (0.0%) | 0 (0.0%) |
| $800 to $1,499 | 23 (30.3%) | 0 (0.0%) |
| $800 to $1,499 | 53 (69.7%) | 0 (0.0%) |
| Total | 76 (100.0%) | 111 (100.0%) |
Health & Disability in Sierra Brooks
Health Insurance Coverage by Age in Sierra Brooks
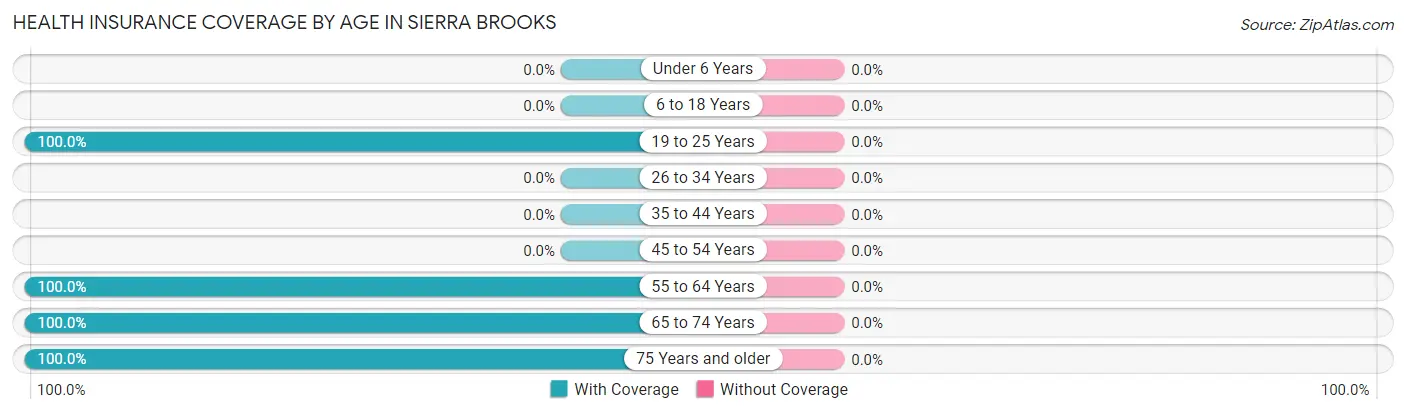
| Age Bracket | With Coverage | Without Coverage |
| Under 6 Years | 0 (0.0%) | 0 (0.0%) |
| 6 to 18 Years | 0 (0.0%) | 0 (0.0%) |
| 19 to 25 Years | 153 (100.0%) | 0 (0.0%) |
| 26 to 34 Years | 0 (0.0%) | 0 (0.0%) |
| 35 to 44 Years | 0 (0.0%) | 0 (0.0%) |
| 45 to 54 Years | 0 (0.0%) | 0 (0.0%) |
| 55 to 64 Years | 119 (100.0%) | 0 (0.0%) |
| 65 to 74 Years | 29 (100.0%) | 0 (0.0%) |
| 75 Years and older | 202 (100.0%) | 0 (0.0%) |
| Total | 503 (100.0%) | 0 (0.0%) |
Health Insurance Coverage by Citizenship Status in Sierra Brooks
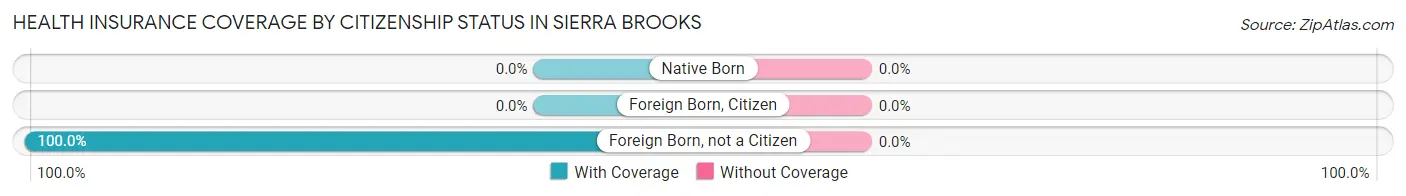
| Citizenship Status | With Coverage | Without Coverage |
| Native Born | 0 (0.0%) | 0 (0.0%) |
| Foreign Born, Citizen | 0 (0.0%) | 0 (0.0%) |
| Foreign Born, not a Citizen | 153 (100.0%) | 0 (0.0%) |
Health Insurance Coverage by Household Income in Sierra Brooks
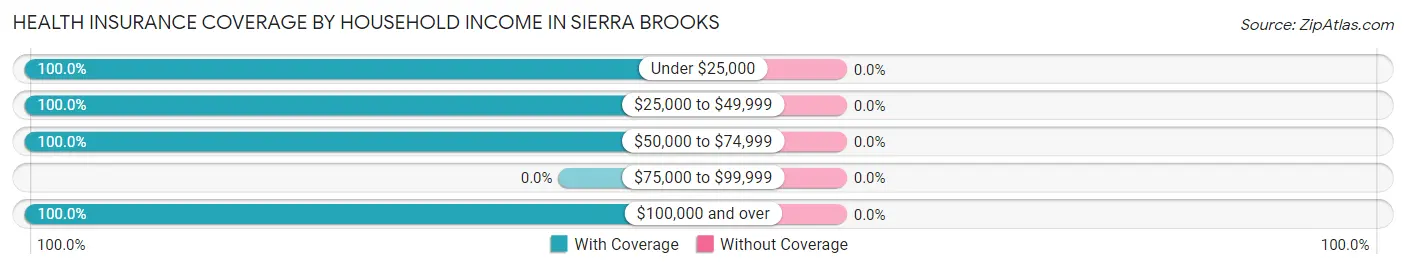
| Household Income | With Coverage | Without Coverage |
| Under $25,000 | 68 (100.0%) | 0 (0.0%) |
| $25,000 to $49,999 | 73 (100.0%) | 0 (0.0%) |
| $50,000 to $74,999 | 111 (100.0%) | 0 (0.0%) |
| $75,000 to $99,999 | 0 (0.0%) | 0 (0.0%) |
| $100,000 and over | 251 (100.0%) | 0 (0.0%) |
Public vs Private Health Insurance Coverage by Age in Sierra Brooks
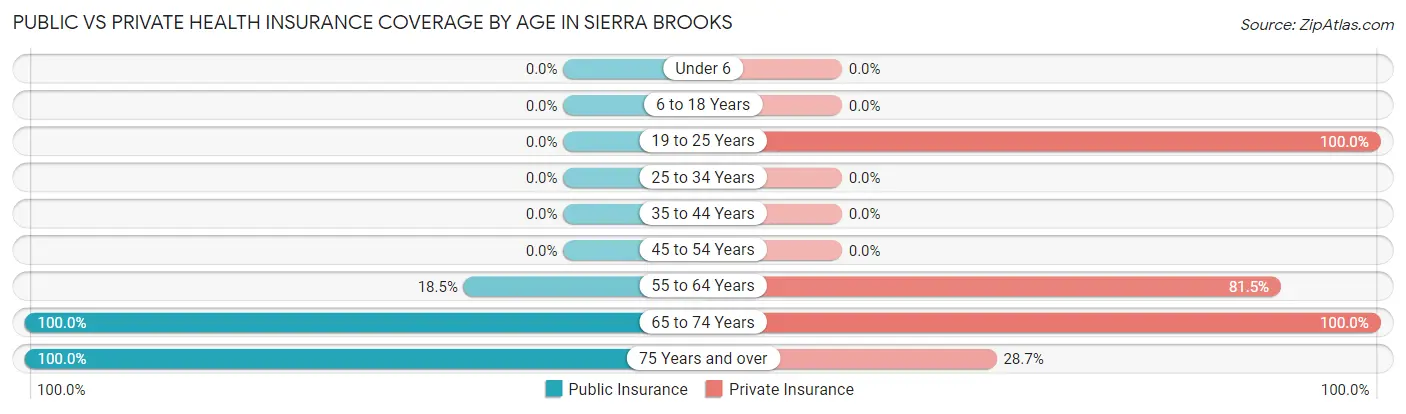
| Age Bracket | Public Insurance | Private Insurance |
| Under 6 | 0 (0.0%) | 0 (0.0%) |
| 6 to 18 Years | 0 (0.0%) | 0 (0.0%) |
| 19 to 25 Years | 0 (0.0%) | 153 (100.0%) |
| 25 to 34 Years | 0 (0.0%) | 0 (0.0%) |
| 35 to 44 Years | 0 (0.0%) | 0 (0.0%) |
| 45 to 54 Years | 0 (0.0%) | 0 (0.0%) |
| 55 to 64 Years | 22 (18.5%) | 97 (81.5%) |
| 65 to 74 Years | 29 (100.0%) | 29 (100.0%) |
| 75 Years and over | 202 (100.0%) | 58 (28.7%) |
| Total | 253 (50.3%) | 337 (67.0%) |
Disability Status by Sex by Age in Sierra Brooks
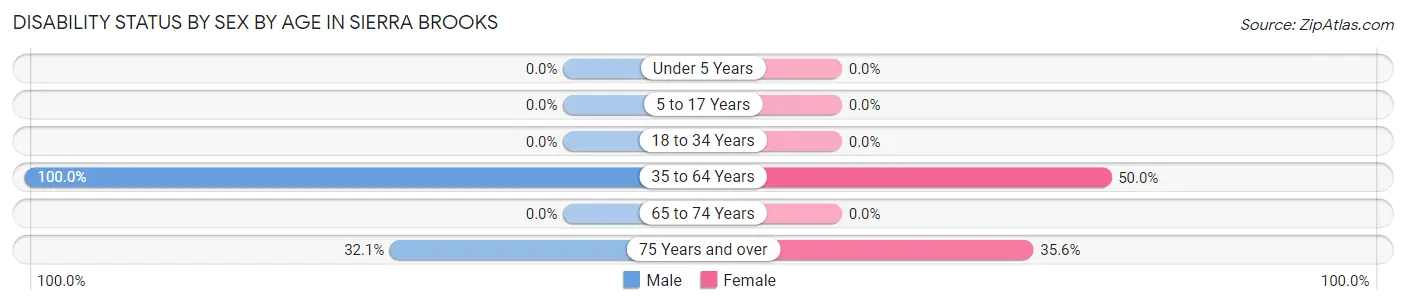
| Age Bracket | Male | Female |
| Under 5 Years | 0 (0.0%) | 0 (0.0%) |
| 5 to 17 Years | 0 (0.0%) | 0 (0.0%) |
| 18 to 34 Years | 0 (0.0%) | 0 (0.0%) |
| 35 to 64 Years | 75 (100.0%) | 22 (50.0%) |
| 65 to 74 Years | 0 (0.0%) | 0 (0.0%) |
| 75 Years and over | 36 (32.1%) | 32 (35.6%) |
Disability Class by Sex by Age in Sierra Brooks
Disability Class: Hearing Difficulty
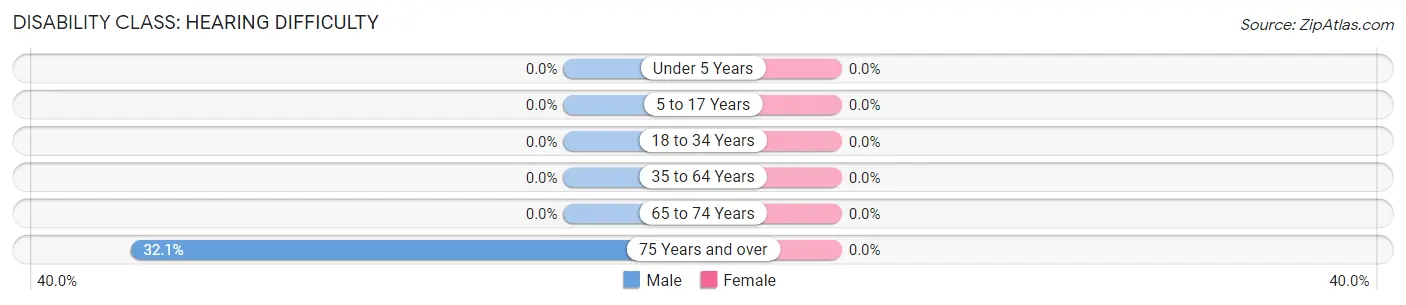
| Age Bracket | Male | Female |
| Under 5 Years | 0 (0.0%) | 0 (0.0%) |
| 5 to 17 Years | 0 (0.0%) | 0 (0.0%) |
| 18 to 34 Years | 0 (0.0%) | 0 (0.0%) |
| 35 to 64 Years | 0 (0.0%) | 0 (0.0%) |
| 65 to 74 Years | 0 (0.0%) | 0 (0.0%) |
| 75 Years and over | 36 (32.1%) | 0 (0.0%) |
Disability Class: Vision Difficulty
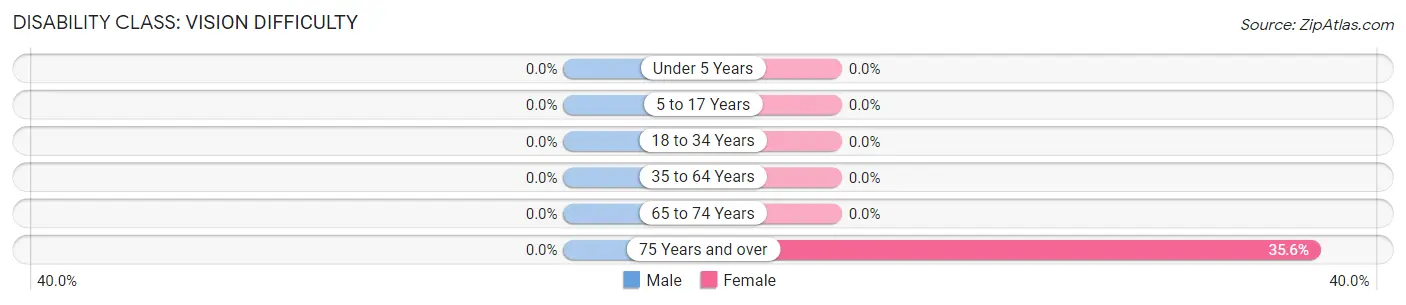
| Age Bracket | Male | Female |
| Under 5 Years | 0 (0.0%) | 0 (0.0%) |
| 5 to 17 Years | 0 (0.0%) | 0 (0.0%) |
| 18 to 34 Years | 0 (0.0%) | 0 (0.0%) |
| 35 to 64 Years | 0 (0.0%) | 0 (0.0%) |
| 65 to 74 Years | 0 (0.0%) | 0 (0.0%) |
| 75 Years and over | 0 (0.0%) | 32 (35.6%) |
Disability Class: Cognitive Difficulty
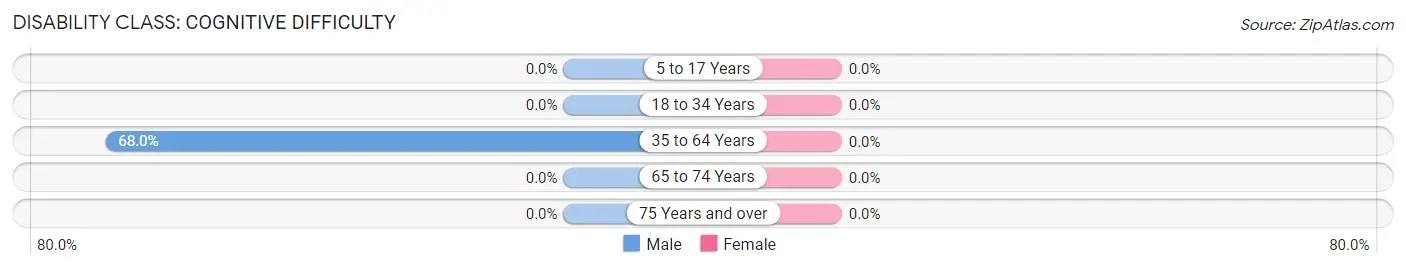
| Age Bracket | Male | Female |
| 5 to 17 Years | 0 (0.0%) | 0 (0.0%) |
| 18 to 34 Years | 0 (0.0%) | 0 (0.0%) |
| 35 to 64 Years | 51 (68.0%) | 0 (0.0%) |
| 65 to 74 Years | 0 (0.0%) | 0 (0.0%) |
| 75 Years and over | 0 (0.0%) | 0 (0.0%) |
Disability Class: Ambulatory Difficulty
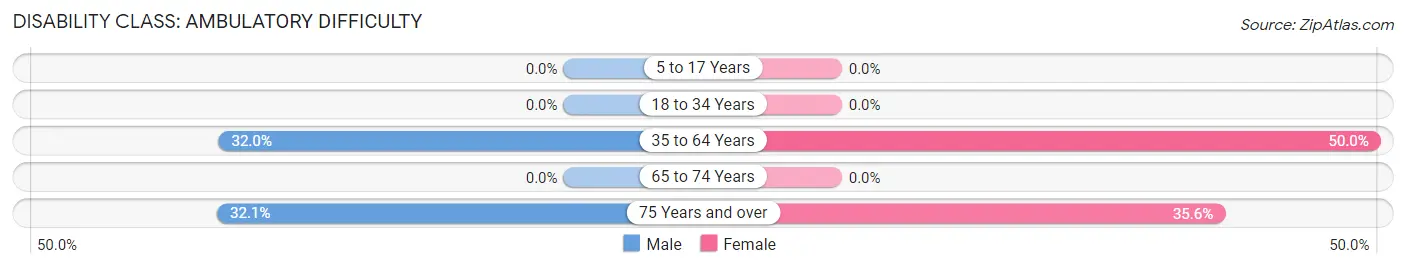
| Age Bracket | Male | Female |
| 5 to 17 Years | 0 (0.0%) | 0 (0.0%) |
| 18 to 34 Years | 0 (0.0%) | 0 (0.0%) |
| 35 to 64 Years | 24 (32.0%) | 22 (50.0%) |
| 65 to 74 Years | 0 (0.0%) | 0 (0.0%) |
| 75 Years and over | 36 (32.1%) | 32 (35.6%) |
Disability Class: Self-Care Difficulty
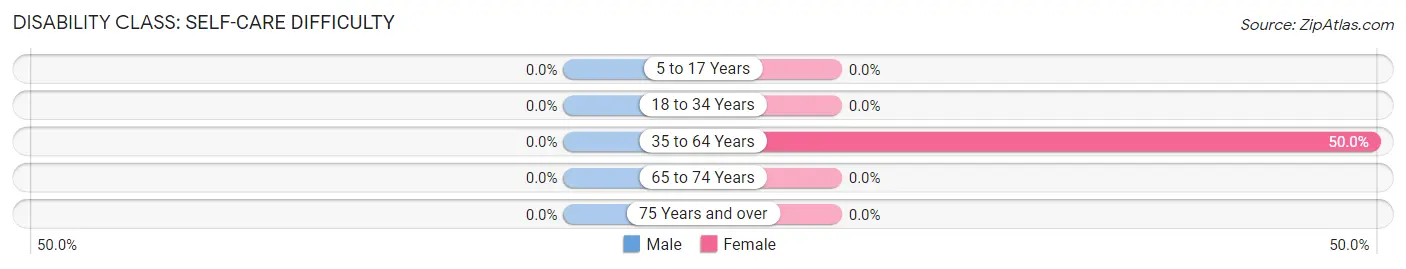
| Age Bracket | Male | Female |
| 5 to 17 Years | 0 (0.0%) | 0 (0.0%) |
| 18 to 34 Years | 0 (0.0%) | 0 (0.0%) |
| 35 to 64 Years | 0 (0.0%) | 22 (50.0%) |
| 65 to 74 Years | 0 (0.0%) | 0 (0.0%) |
| 75 Years and over | 0 (0.0%) | 0 (0.0%) |
Technology Access in Sierra Brooks
Computing Device Access in Sierra Brooks
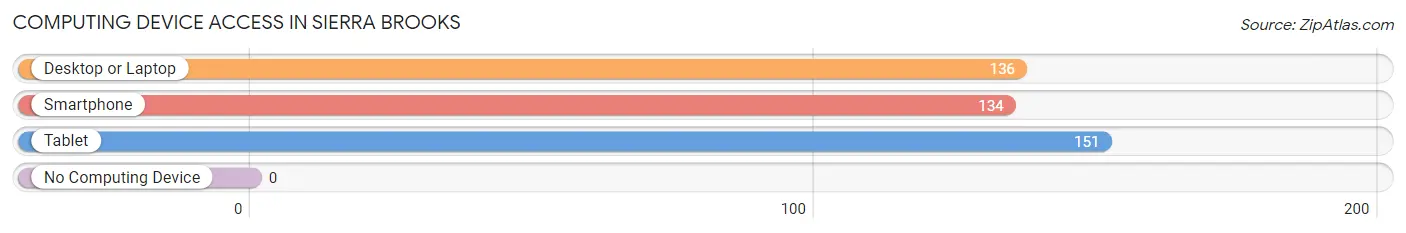
| Device Type | # Households | % Households |
| Desktop or Laptop | 136 | 72.7% |
| Smartphone | 134 | 71.7% |
| Tablet | 151 | 80.7% |
| No Computing Device | 0 | 0.0% |
| Total | 187 | 100.0% |
Internet Access in Sierra Brooks
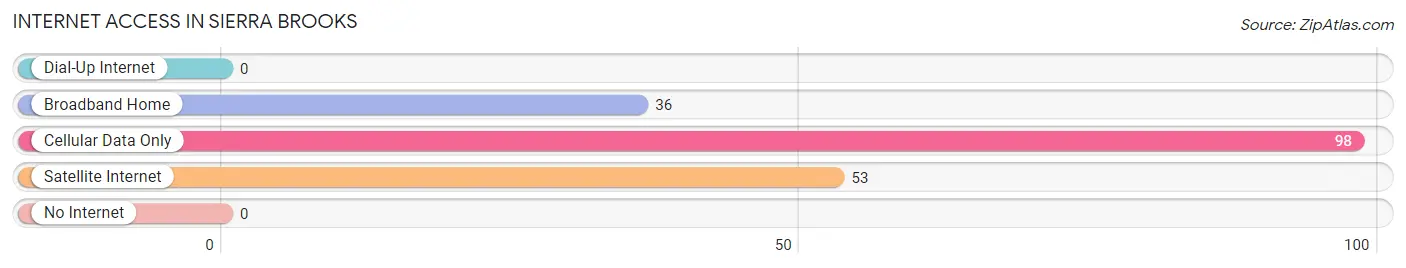
| Internet Type | # Households | % Households |
| Dial-Up Internet | 0 | 0.0% |
| Broadband Home | 36 | 19.3% |
| Cellular Data Only | 98 | 52.4% |
| Satellite Internet | 53 | 28.3% |
| No Internet | 0 | 0.0% |
| Total | 187 | 100.0% |
Sierra Brooks Summary
Sierra Brooks is a small town located in the Sierra Nevada Mountains of California. It is situated in the foothills of the Sierra Nevada Mountains, approximately 30 miles east of Sacramento. The town has a population of approximately 1,500 people and is known for its picturesque mountain views and outdoor activities.
History
Sierra Brooks was founded in 1849 by a group of miners who were searching for gold in the area. The town was originally called “Sierra City” but was later changed to Sierra Brooks. The town was named after the Sierra Nevada Mountains, which are located nearby. The town quickly grew in population and became a popular destination for miners and prospectors.
In the late 1800s, Sierra Brooks became a popular tourist destination for those looking to escape the hustle and bustle of city life. The town was known for its beautiful mountain views and outdoor activities. In the early 1900s, the town was home to several resorts and hotels, which attracted visitors from all over the world.
Geography
Sierra Brooks is located in the Sierra Nevada Mountains of California. The town is situated in the foothills of the Sierra Nevada Mountains, approximately 30 miles east of Sacramento. The town is surrounded by mountains and is known for its picturesque views. The town is located at an elevation of approximately 4,000 feet and has a mild climate year-round.
Economy
Sierra Brooks is a small town with a population of approximately 1,500 people. The town’s economy is largely based on tourism and outdoor activities. The town is home to several resorts and hotels, which attract visitors from all over the world. The town is also home to several restaurants, shops, and other businesses.
Demographics
Sierra Brooks is a small town with a population of approximately 1,500 people. The town is predominantly white, with approximately 75% of the population identifying as Caucasian. The remaining 25% of the population is made up of African Americans, Hispanics, and other ethnicities. The median household income in Sierra Brooks is approximately $50,000. The town has a low unemployment rate and a high rate of homeownership.
Conclusion
Sierra Brooks is a small town located in the Sierra Nevada Mountains of California. The town is known for its picturesque mountain views and outdoor activities. The town has a population of approximately 1,500 people and is predominantly white. The town’s economy is largely based on tourism and outdoor activities. The town has a low unemployment rate and a high rate of homeownership.
Common Questions
What is Per Capita Income in Sierra Brooks?
Per Capita income in Sierra Brooks is $28,112.
What is the Median Family Income in Sierra Brooks?
Median Family Income in Sierra Brooks is $60,307.
What is the Median Household income in Sierra Brooks?
Median Household Income in Sierra Brooks is $60,307.
What is Inequality or Gini Index in Sierra Brooks?
Inequality or Gini Index in Sierra Brooks is 0.45.
What is the Total Population of Sierra Brooks?
Total Population of Sierra Brooks is 503.
What is the Total Male Population of Sierra Brooks?
Total Male Population of Sierra Brooks is 187.
What is the Total Female Population of Sierra Brooks?
Total Female Population of Sierra Brooks is 316.
What is the Ratio of Males per 100 Females in Sierra Brooks?
There are 59.18 Males per 100 Females in Sierra Brooks.
What is the Ratio of Females per 100 Males in Sierra Brooks?
There are 168.98 Females per 100 Males in Sierra Brooks.
What is the Median Population Age in Sierra Brooks?
Median Population Age in Sierra Brooks is 63.6 Years.
What is the Average Family Size in Sierra Brooks
Average Family Size in Sierra Brooks is 2.6 People.
What is the Average Household Size in Sierra Brooks
Average Household Size in Sierra Brooks is 2.7 People.
How Large is the Labor Force in Sierra Brooks?
There are 259 People in the Labor Forcein in Sierra Brooks.
What is the Percentage of People in the Labor Force in Sierra Brooks?
51.5% of People are in the Labor Force in Sierra Brooks.