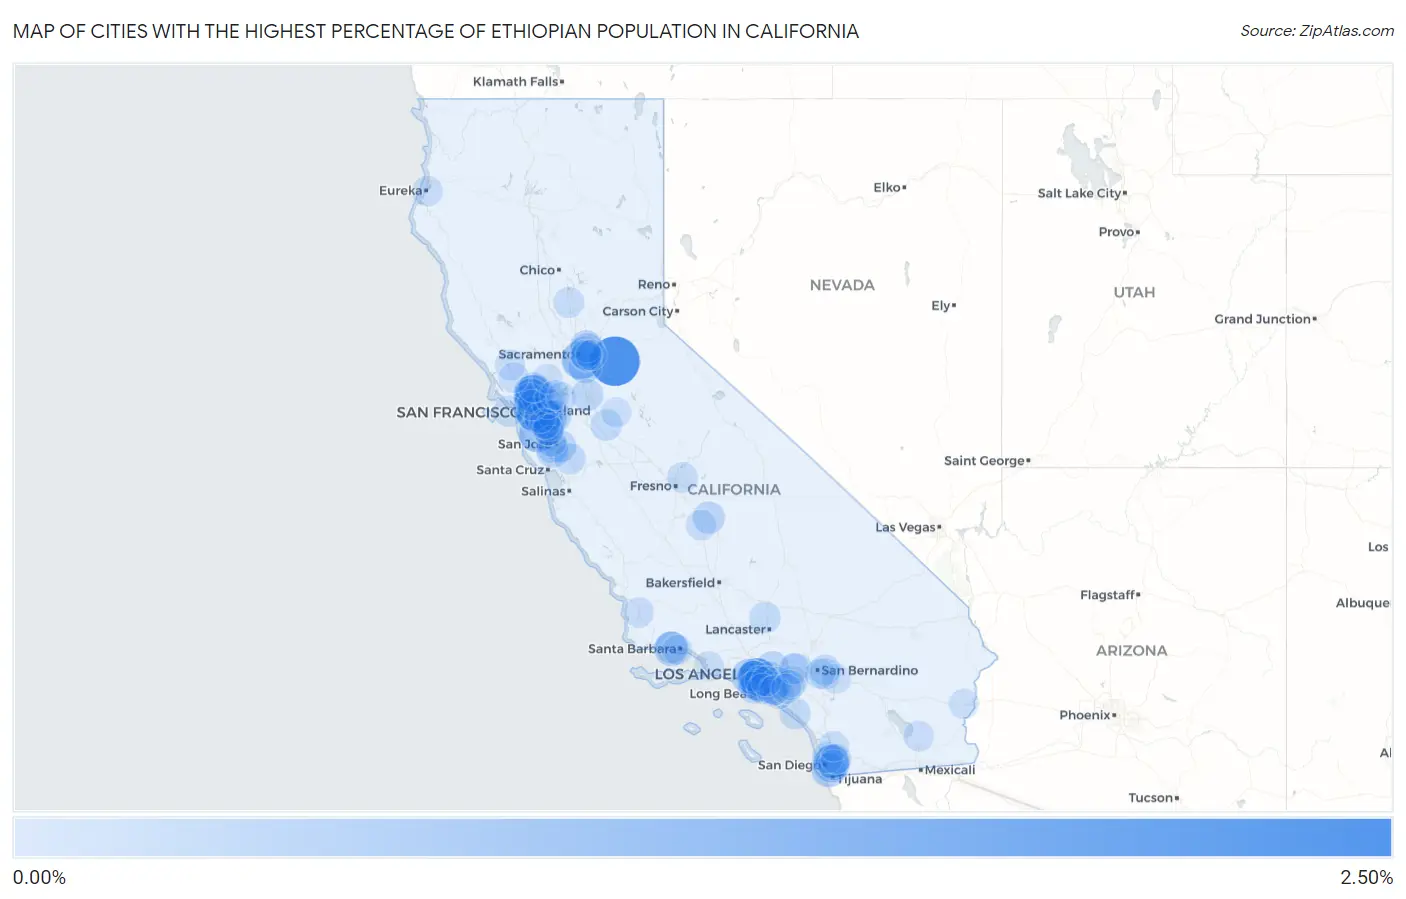
Cities with the Highest Percentage of Ethiopian Population in California
RELATED REPORTS & OPTIONS
Ethiopian
California
Compare Cities
Map of Cities with the Highest Percentage of Ethiopian Population in California
0.00%
2.50%
Cities with the Highest Percentage of Ethiopian Population in California
| City | Ethiopian | vs State | vs National | |
| 1. | Plymouth | 2.47% | 0.099%(+2.37)#1 | 0.11%(+2.36)#87 |
| 2. | Parkway | 1.13% | 0.099%(+1.03)#2 | 0.11%(+1.03)#211 |
| 3. | Ladera Heights | 1.10% | 0.099%(+1.00)#3 | 0.11%(+0.996)#217 |
| 4. | View Park Windsor Hills | 1.10% | 0.099%(+1.00)#4 | 0.11%(+0.993)#218 |
| 5. | Oakland | 1.08% | 0.099%(+0.976)#5 | 0.11%(+0.968)#224 |
| 6. | Emeryville | 1.06% | 0.099%(+0.961)#6 | 0.11%(+0.952)#228 |
| 7. | Ashland | 1.01% | 0.099%(+0.916)#7 | 0.11%(+0.907)#235 |
| 8. | Fairview | 0.99% | 0.099%(+0.894)#8 | 0.11%(+0.885)#241 |
| 9. | Rodeo | 0.99% | 0.099%(+0.887)#9 | 0.11%(+0.878)#244 |
| 10. | Hercules | 0.96% | 0.099%(+0.858)#10 | 0.11%(+0.849)#247 |
| 11. | North Fair Oaks | 0.91% | 0.099%(+0.813)#11 | 0.11%(+0.804)#260 |
| 12. | Lemon Grove | 0.88% | 0.099%(+0.786)#12 | 0.11%(+0.777)#272 |
| 13. | Petaluma Center | 0.82% | 0.099%(+0.726)#13 | 0.11%(+0.717)#284 |
| 14. | Inglewood | 0.75% | 0.099%(+0.651)#14 | 0.11%(+0.643)#303 |
| 15. | Hawthorne | 0.74% | 0.099%(+0.642)#15 | 0.11%(+0.633)#306 |
| 16. | Tara Hills | 0.65% | 0.099%(+0.555)#16 | 0.11%(+0.546)#337 |
| 17. | Alameda | 0.64% | 0.099%(+0.541)#17 | 0.11%(+0.532)#340 |
| 18. | Camp Pendleton Mainside | 0.61% | 0.099%(+0.516)#18 | 0.11%(+0.507)#345 |
| 19. | Isla Vista | 0.61% | 0.099%(+0.513)#19 | 0.11%(+0.504)#347 |
| 20. | Santa Monica | 0.61% | 0.099%(+0.512)#20 | 0.11%(+0.504)#348 |
| 21. | National City | 0.61% | 0.099%(+0.510)#21 | 0.11%(+0.501)#352 |
| 22. | Culver City | 0.56% | 0.099%(+0.461)#22 | 0.11%(+0.453)#378 |
| 23. | La Mesa | 0.54% | 0.099%(+0.437)#23 | 0.11%(+0.428)#389 |
| 24. | Elk Grove | 0.49% | 0.099%(+0.393)#24 | 0.11%(+0.384)#415 |
| 25. | Pinole | 0.47% | 0.099%(+0.371)#25 | 0.11%(+0.362)#420 |
| 26. | Castro Valley | 0.46% | 0.099%(+0.361)#26 | 0.11%(+0.353)#424 |
| 27. | Carmichael | 0.43% | 0.099%(+0.331)#27 | 0.11%(+0.323)#445 |
| 28. | East Pasadena | 0.38% | 0.099%(+0.285)#28 | 0.11%(+0.276)#477 |
| 29. | Los Gatos | 0.38% | 0.099%(+0.282)#29 | 0.11%(+0.273)#478 |
| 30. | Lakewood | 0.38% | 0.099%(+0.279)#30 | 0.11%(+0.271)#483 |
| 31. | Dublin | 0.37% | 0.099%(+0.276)#31 | 0.11%(+0.267)#487 |
| 32. | San Jose | 0.36% | 0.099%(+0.263)#32 | 0.11%(+0.255)#499 |
| 33. | Arden Arcade | 0.35% | 0.099%(+0.253)#33 | 0.11%(+0.245)#514 |
| 34. | Commerce | 0.35% | 0.099%(+0.252)#34 | 0.11%(+0.244)#517 |
| 35. | Foothill Farms | 0.33% | 0.099%(+0.231)#35 | 0.11%(+0.222)#538 |
| 36. | Goleta | 0.33% | 0.099%(+0.229)#36 | 0.11%(+0.221)#542 |
| 37. | Farmersville | 0.32% | 0.099%(+0.219)#37 | 0.11%(+0.210)#551 |
| 38. | Lincoln Village | 0.31% | 0.099%(+0.212)#38 | 0.11%(+0.203)#559 |
| 39. | Sonoma State University | 0.29% | 0.099%(+0.194)#39 | 0.11%(+0.186)#580 |
| 40. | Campbell | 0.28% | 0.099%(+0.182)#40 | 0.11%(+0.173)#598 |
| 41. | Union City | 0.28% | 0.099%(+0.178)#41 | 0.11%(+0.169)#606 |
| 42. | Hermosa Beach | 0.28% | 0.099%(+0.178)#42 | 0.11%(+0.169)#607 |
| 43. | Placentia | 0.26% | 0.099%(+0.166)#43 | 0.11%(+0.157)#620 |
| 44. | Upland | 0.26% | 0.099%(+0.163)#44 | 0.11%(+0.154)#623 |
| 45. | Modesto | 0.26% | 0.099%(+0.163)#45 | 0.11%(+0.154)#624 |
| 46. | Morgan Hill | 0.24% | 0.099%(+0.138)#46 | 0.11%(+0.129)#660 |
| 47. | Spring Valley Cdp San Diego County | 0.22% | 0.099%(+0.126)#47 | 0.11%(+0.117)#678 |
| 48. | Rosamond | 0.22% | 0.099%(+0.124)#48 | 0.11%(+0.115)#681 |
| 49. | San Diego | 0.22% | 0.099%(+0.124)#49 | 0.11%(+0.115)#685 |
| 50. | Dana Point | 0.22% | 0.099%(+0.122)#50 | 0.11%(+0.114)#686 |
| 51. | East Whittier | 0.21% | 0.099%(+0.116)#51 | 0.11%(+0.107)#703 |
| 52. | Redlands | 0.21% | 0.099%(+0.116)#52 | 0.11%(+0.107)#704 |
| 53. | Rosemont | 0.21% | 0.099%(+0.111)#53 | 0.11%(+0.102)#716 |
| 54. | Richmond | 0.21% | 0.099%(+0.111)#54 | 0.11%(+0.102)#717 |
| 55. | La Riviera | 0.20% | 0.099%(+0.099)#55 | 0.11%(+0.090)#732 |
| 56. | San Francisco | 0.20% | 0.099%(+0.098)#56 | 0.11%(+0.089)#737 |
| 57. | Santa Clara | 0.19% | 0.099%(+0.095)#57 | 0.11%(+0.086)#744 |
| 58. | Eastern Goleta Valley | 0.19% | 0.099%(+0.091)#58 | 0.11%(+0.082)#757 |
| 59. | Newark | 0.19% | 0.099%(+0.089)#59 | 0.11%(+0.080)#762 |
| 60. | Highland | 0.18% | 0.099%(+0.086)#60 | 0.11%(+0.078)#765 |
| 61. | Fremont | 0.18% | 0.099%(+0.078)#61 | 0.11%(+0.069)#778 |
| 62. | Chino Hills | 0.17% | 0.099%(+0.075)#62 | 0.11%(+0.067)#785 |
| 63. | Live Oak | 0.17% | 0.099%(+0.075)#63 | 0.11%(+0.066)#787 |
| 64. | San Leandro | 0.17% | 0.099%(+0.069)#64 | 0.11%(+0.060)#797 |
| 65. | Walnut Creek | 0.16% | 0.099%(+0.065)#65 | 0.11%(+0.056)#809 |
| 66. | Los Angeles | 0.16% | 0.099%(+0.063)#66 | 0.11%(+0.055)#811 |
| 67. | Rancho Cordova | 0.16% | 0.099%(+0.062)#67 | 0.11%(+0.053)#815 |
| 68. | Clovis | 0.16% | 0.099%(+0.060)#68 | 0.11%(+0.051)#820 |
| 69. | Hayward | 0.15% | 0.099%(+0.051)#69 | 0.11%(+0.042)#840 |
| 70. | Garden Grove | 0.15% | 0.099%(+0.049)#70 | 0.11%(+0.040)#843 |
| 71. | Berkeley | 0.15% | 0.099%(+0.047)#71 | 0.11%(+0.039)#847 |
| 72. | La Presa | 0.15% | 0.099%(+0.046)#72 | 0.11%(+0.038)#851 |
| 73. | Poway | 0.14% | 0.099%(+0.045)#73 | 0.11%(+0.036)#857 |
| 74. | Lawndale | 0.14% | 0.099%(+0.044)#74 | 0.11%(+0.035)#860 |
| 75. | Tulare | 0.14% | 0.099%(+0.043)#75 | 0.11%(+0.034)#865 |
| 76. | Calipatria | 0.14% | 0.099%(+0.038)#76 | 0.11%(+0.030)#880 |
| 77. | Eureka | 0.14% | 0.099%(+0.037)#77 | 0.11%(+0.028)#884 |
| 78. | Santa Rosa | 0.13% | 0.099%(+0.036)#78 | 0.11%(+0.027)#886 |
| 79. | Claremont | 0.13% | 0.099%(+0.034)#79 | 0.11%(+0.026)#890 |
| 80. | Concord | 0.13% | 0.099%(+0.028)#80 | 0.11%(+0.019)#910 |
| 81. | Westmont | 0.12% | 0.099%(+0.026)#81 | 0.11%(+0.017)#917 |
| 82. | Vallejo | 0.12% | 0.099%(+0.023)#82 | 0.11%(+0.014)#930 |
| 83. | Carson | 0.12% | 0.099%(+0.022)#83 | 0.11%(+0.013)#933 |
| 84. | Rossmoor | 0.12% | 0.099%(+0.021)#84 | 0.11%(+0.012)#936 |
| 85. | Petaluma | 0.12% | 0.099%(+0.019)#85 | 0.11%(+0.010)#942 |
| 86. | Santa Maria | 0.12% | 0.099%(+0.018)#86 | 0.11%(+0.010)#945 |
| 87. | El Cajon | 0.12% | 0.099%(+0.018)#87 | 0.11%(+0.009)#948 |
| 88. | Cypress | 0.12% | 0.099%(+0.018)#88 | 0.11%(+0.009)#949 |
| 89. | Fairfield | 0.11% | 0.099%(+0.012)#89 | 0.11%(+0.003)#960 |
| 90. | Port Hueneme | 0.11% | 0.099%(+0.007)#90 | 0.11%(-0.002)#979 |
| 91. | Antioch | 0.11% | 0.099%(+0.007)#91 | 0.11%(-0.002)#980 |
| 92. | Cherry Valley | 0.10% | 0.099%(+0.006)#92 | 0.11%(-0.003)#984 |
| 93. | Blythe | 0.10% | 0.099%(+0.002)#93 | 0.11%(-0.007)#999 |
| 94. | Yorba Linda | 0.097% | 0.099%(-0.002)#94 | 0.11%(-0.010)#1,005 |
| 95. | Loma Linda | 0.096% | 0.099%(-0.002)#95 | 0.11%(-0.011)#1,007 |
| 96. | Santa Barbara | 0.096% | 0.099%(-0.003)#96 | 0.11%(-0.011)#1,012 |
| 97. | Pittsburg | 0.096% | 0.099%(-0.003)#97 | 0.11%(-0.012)#1,014 |
| 98. | South Gate | 0.095% | 0.099%(-0.003)#98 | 0.11%(-0.012)#1,015 |
| 99. | Oakdale | 0.095% | 0.099%(-0.003)#99 | 0.11%(-0.012)#1,016 |
| 100. | Anaheim | 0.095% | 0.099%(-0.004)#100 | 0.11%(-0.012)#1,017 |
Common Questions
What are the Top 10 Cities with the Highest Percentage of Ethiopian Population in California?
Top 10 Cities with the Highest Percentage of Ethiopian Population in California are:
#1
2.47%
#2
1.13%
#3
1.10%
#4
1.10%
#5
1.08%
#6
1.06%
#7
1.01%
#8
0.99%
#9
0.99%
#10
0.96%
What city has the Highest Percentage of Ethiopian Population in California?
Plymouth has the Highest Percentage of Ethiopian Population in California with 2.47%.
What is the Percentage of Ethiopian Population in the State of California?
Percentage of Ethiopian Population in California is 0.099%.
What is the Percentage of Ethiopian Population in the United States?
Percentage of Ethiopian Population in the United States is 0.11%.