Cities with the Most Immigrants from Western Europe in California
RELATED REPORTS & OPTIONS
Western Europe
California
Compare Cities
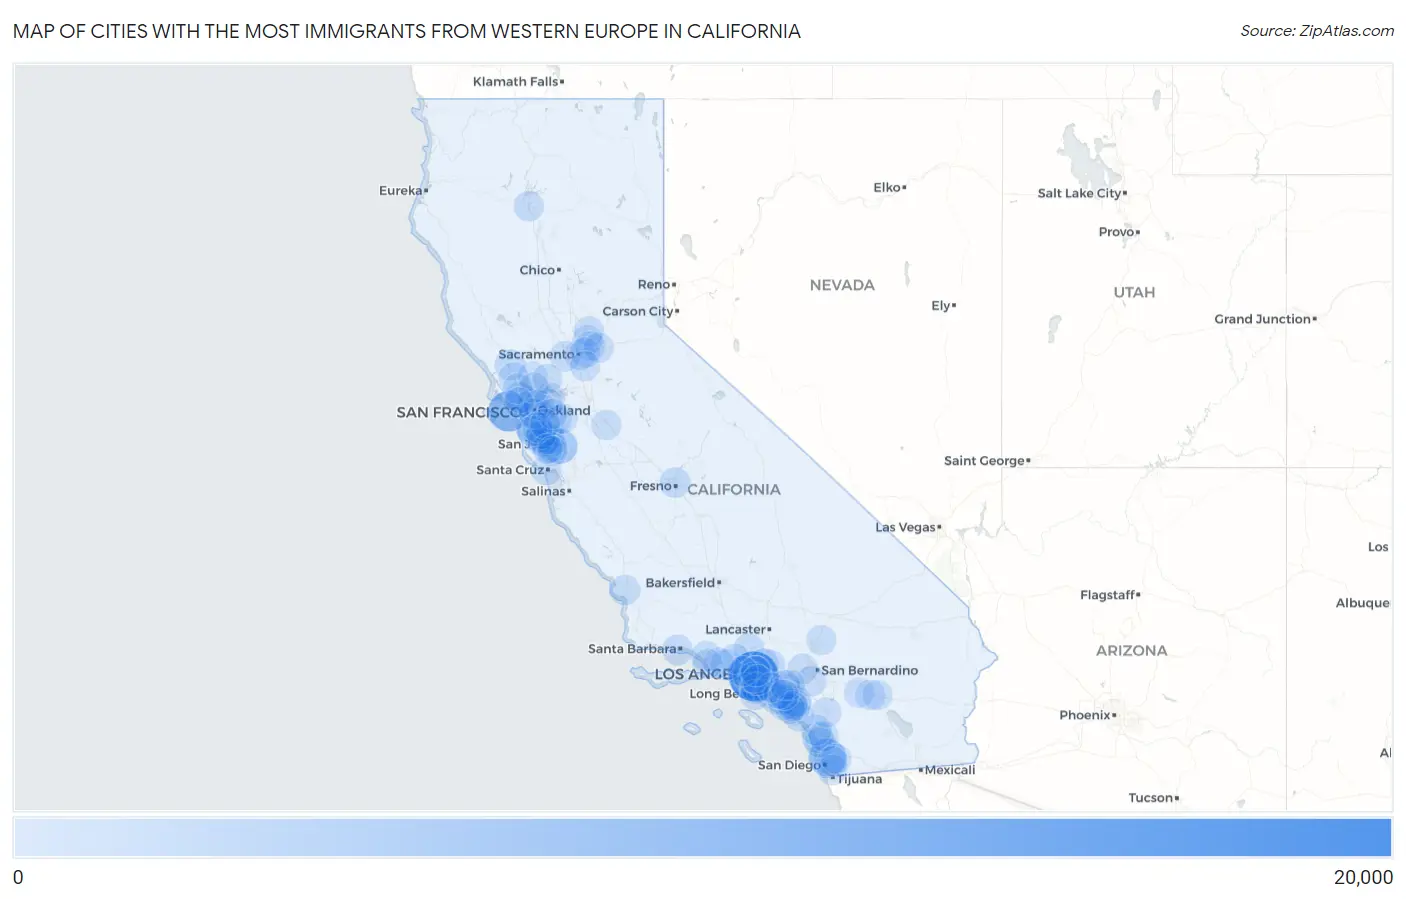
Map of Cities with the Most Immigrants from Western Europe in California
0
20,000
Cities with the Most Immigrants from Western Europe in California
| City | Western Europe | vs State | vs National | |
| 1. | Los Angeles | 18,395 | 153,868(11.96%)#1 | 924,665(1.99%)#2 |
| 2. | San Francisco | 9,934 | 153,868(6.46%)#2 | 924,665(1.07%)#3 |
| 3. | San Diego | 7,020 | 153,868(4.56%)#3 | 924,665(0.76%)#5 |
| 4. | San Jose | 4,633 | 153,868(3.01%)#4 | 924,665(0.50%)#7 |
| 5. | Oakland | 2,327 | 153,868(1.51%)#5 | 924,665(0.25%)#22 |
| 6. | Berkeley | 1,859 | 153,868(1.21%)#6 | 924,665(0.20%)#29 |
| 7. | Irvine | 1,744 | 153,868(1.13%)#7 | 924,665(0.19%)#31 |
| 8. | Palo Alto | 1,624 | 153,868(1.06%)#8 | 924,665(0.18%)#34 |
| 9. | Sunnyvale | 1,441 | 153,868(0.94%)#9 | 924,665(0.16%)#43 |
| 10. | Long Beach | 1,373 | 153,868(0.89%)#10 | 924,665(0.15%)#45 |
| 11. | Mountain View | 1,248 | 153,868(0.81%)#11 | 924,665(0.13%)#51 |
| 12. | Santa Rosa | 1,124 | 153,868(0.73%)#12 | 924,665(0.12%)#62 |
| 13. | Carlsbad | 1,122 | 153,868(0.73%)#13 | 924,665(0.12%)#63 |
| 14. | Huntington Beach | 1,052 | 153,868(0.68%)#14 | 924,665(0.11%)#72 |
| 15. | Santa Clara | 1,042 | 153,868(0.68%)#15 | 924,665(0.11%)#73 |
| 16. | Santa Monica | 951 | 153,868(0.62%)#16 | 924,665(0.10%)#79 |
| 17. | Thousand Oaks | 942 | 153,868(0.61%)#17 | 924,665(0.10%)#81 |
| 18. | Encinitas | 932 | 153,868(0.61%)#18 | 924,665(0.10%)#83 |
| 19. | Santa Barbara | 897 | 153,868(0.58%)#19 | 924,665(0.10%)#88 |
| 20. | Pasadena | 851 | 153,868(0.55%)#20 | 924,665(0.09%)#91 |
| 21. | Oceanside | 828 | 153,868(0.54%)#21 | 924,665(0.09%)#93 |
| 22. | Santa Clarita | 816 | 153,868(0.53%)#22 | 924,665(0.09%)#96 |
| 23. | Laguna Niguel | 800 | 153,868(0.52%)#23 | 924,665(0.09%)#100 |
| 24. | Fresno | 784 | 153,868(0.51%)#24 | 924,665(0.08%)#103 |
| 25. | San Mateo | 780 | 153,868(0.51%)#25 | 924,665(0.08%)#105 |
| 26. | San Rafael | 780 | 153,868(0.51%)#26 | 924,665(0.08%)#106 |
| 27. | Redwood City | 768 | 153,868(0.50%)#27 | 924,665(0.08%)#108 |
| 28. | Fremont | 753 | 153,868(0.49%)#28 | 924,665(0.08%)#113 |
| 29. | Glendale | 741 | 153,868(0.48%)#29 | 924,665(0.08%)#117 |
| 30. | Los Altos | 722 | 153,868(0.47%)#30 | 924,665(0.08%)#124 |
| 31. | Sacramento | 721 | 153,868(0.47%)#31 | 924,665(0.08%)#125 |
| 32. | Newport Beach | 719 | 153,868(0.47%)#32 | 924,665(0.08%)#128 |
| 33. | Beverly Hills | 707 | 153,868(0.46%)#33 | 924,665(0.08%)#134 |
| 34. | Walnut Creek | 668 | 153,868(0.43%)#34 | 924,665(0.07%)#142 |
| 35. | Anaheim | 635 | 153,868(0.41%)#35 | 924,665(0.07%)#149 |
| 36. | Riverside | 618 | 153,868(0.40%)#36 | 924,665(0.07%)#154 |
| 37. | Stanford | 605 | 153,868(0.39%)#37 | 924,665(0.07%)#158 |
| 38. | Torrance | 601 | 153,868(0.39%)#38 | 924,665(0.06%)#159 |
| 39. | San Luis Obispo | 595 | 153,868(0.39%)#39 | 924,665(0.06%)#162 |
| 40. | Lake Forest | 589 | 153,868(0.38%)#40 | 924,665(0.06%)#166 |
| 41. | Rancho Cucamonga | 579 | 153,868(0.38%)#41 | 924,665(0.06%)#168 |
| 42. | Mission Viejo | 577 | 153,868(0.37%)#42 | 924,665(0.06%)#169 |
| 43. | Redding | 561 | 153,868(0.36%)#43 | 924,665(0.06%)#177 |
| 44. | Menlo Park | 555 | 153,868(0.36%)#44 | 924,665(0.06%)#180 |
| 45. | San Buenaventura Ventura | 524 | 153,868(0.34%)#45 | 924,665(0.06%)#187 |
| 46. | Santa Cruz | 511 | 153,868(0.33%)#46 | 924,665(0.06%)#193 |
| 47. | Davis | 510 | 153,868(0.33%)#47 | 924,665(0.06%)#194 |
| 48. | Petaluma | 501 | 153,868(0.33%)#48 | 924,665(0.05%)#196 |
| 49. | Simi Valley | 476 | 153,868(0.31%)#49 | 924,665(0.05%)#208 |
| 50. | San Clemente | 466 | 153,868(0.30%)#50 | 924,665(0.05%)#213 |
| 51. | Pleasanton | 459 | 153,868(0.30%)#51 | 924,665(0.05%)#218 |
| 52. | Modesto | 457 | 153,868(0.30%)#52 | 924,665(0.05%)#219 |
| 53. | Redondo Beach | 451 | 153,868(0.29%)#53 | 924,665(0.05%)#222 |
| 54. | Novato | 451 | 153,868(0.29%)#54 | 924,665(0.05%)#223 |
| 55. | Rancho Palos Verdes | 437 | 153,868(0.28%)#55 | 924,665(0.05%)#234 |
| 56. | Concord | 436 | 153,868(0.28%)#56 | 924,665(0.05%)#235 |
| 57. | Costa Mesa | 434 | 153,868(0.28%)#57 | 924,665(0.05%)#236 |
| 58. | Palm Springs | 429 | 153,868(0.28%)#58 | 924,665(0.05%)#239 |
| 59. | Livermore | 424 | 153,868(0.28%)#59 | 924,665(0.05%)#244 |
| 60. | San Marcos | 419 | 153,868(0.27%)#60 | 924,665(0.05%)#248 |
| 61. | Camarillo | 415 | 153,868(0.27%)#61 | 924,665(0.04%)#251 |
| 62. | Roseville | 414 | 153,868(0.27%)#62 | 924,665(0.04%)#252 |
| 63. | Alameda | 414 | 153,868(0.27%)#63 | 924,665(0.04%)#253 |
| 64. | Culver City | 413 | 153,868(0.27%)#64 | 924,665(0.04%)#255 |
| 65. | West Hollywood | 413 | 153,868(0.27%)#65 | 924,665(0.04%)#256 |
| 66. | Belmont | 410 | 153,868(0.27%)#66 | 924,665(0.04%)#259 |
| 67. | Napa | 398 | 153,868(0.26%)#67 | 924,665(0.04%)#266 |
| 68. | Chula Vista | 394 | 153,868(0.26%)#68 | 924,665(0.04%)#268 |
| 69. | Laguna Woods | 394 | 153,868(0.26%)#69 | 924,665(0.04%)#269 |
| 70. | Laguna Beach | 390 | 153,868(0.25%)#70 | 924,665(0.04%)#272 |
| 71. | Yorba Linda | 384 | 153,868(0.25%)#71 | 924,665(0.04%)#276 |
| 72. | Lincoln | 384 | 153,868(0.25%)#72 | 924,665(0.04%)#277 |
| 73. | Aliso Viejo | 378 | 153,868(0.25%)#73 | 924,665(0.04%)#283 |
| 74. | Campbell | 375 | 153,868(0.24%)#74 | 924,665(0.04%)#287 |
| 75. | Orinda | 374 | 153,868(0.24%)#75 | 924,665(0.04%)#289 |
| 76. | Palm Desert | 370 | 153,868(0.24%)#76 | 924,665(0.04%)#291 |
| 77. | Vallejo | 364 | 153,868(0.24%)#77 | 924,665(0.04%)#297 |
| 78. | Citrus Heights | 364 | 153,868(0.24%)#78 | 924,665(0.04%)#298 |
| 79. | Arden Arcade | 360 | 153,868(0.23%)#79 | 924,665(0.04%)#303 |
| 80. | Folsom | 359 | 153,868(0.23%)#80 | 924,665(0.04%)#304 |
| 81. | Elk Grove | 358 | 153,868(0.23%)#81 | 924,665(0.04%)#305 |
| 82. | Temecula | 354 | 153,868(0.23%)#82 | 924,665(0.04%)#308 |
| 83. | Garden Grove | 352 | 153,868(0.23%)#83 | 924,665(0.04%)#311 |
| 84. | Topanga | 347 | 153,868(0.23%)#84 | 924,665(0.04%)#321 |
| 85. | Oxnard | 346 | 153,868(0.22%)#85 | 924,665(0.04%)#322 |
| 86. | Mill Valley | 345 | 153,868(0.22%)#86 | 924,665(0.04%)#327 |
| 87. | Lakewood | 339 | 153,868(0.22%)#87 | 924,665(0.04%)#337 |
| 88. | Foster City | 337 | 153,868(0.22%)#88 | 924,665(0.04%)#339 |
| 89. | San Ramon | 335 | 153,868(0.22%)#89 | 924,665(0.04%)#340 |
| 90. | El Cajon | 334 | 153,868(0.22%)#90 | 924,665(0.04%)#342 |
| 91. | Placentia | 331 | 153,868(0.22%)#91 | 924,665(0.04%)#349 |
| 92. | Indio | 329 | 153,868(0.21%)#92 | 924,665(0.04%)#352 |
| 93. | Fairfield | 327 | 153,868(0.21%)#93 | 924,665(0.04%)#354 |
| 94. | Hayward | 325 | 153,868(0.21%)#94 | 924,665(0.04%)#358 |
| 95. | La Mesa | 322 | 153,868(0.21%)#95 | 924,665(0.03%)#363 |
| 96. | Santa Ana | 321 | 153,868(0.21%)#96 | 924,665(0.03%)#366 |
| 97. | Inglewood | 321 | 153,868(0.21%)#97 | 924,665(0.03%)#367 |
| 98. | Los Gatos | 321 | 153,868(0.21%)#98 | 924,665(0.03%)#369 |
| 99. | Saratoga | 321 | 153,868(0.21%)#99 | 924,665(0.03%)#370 |
| 100. | Apple Valley | 319 | 153,868(0.21%)#100 | 924,665(0.03%)#374 |
Common Questions
What are the Top 10 Cities with the Most Immigrants from Western Europe in California?
Top 10 Cities with the Most Immigrants from Western Europe in California are:
#1
18,395
#2
9,934
#3
7,020
#4
4,633
#5
2,327
#6
1,859
#7
1,744
#8
1,624
#9
1,441
#10
1,373
What city has the Most Immigrants from Western Europe in California?
Los Angeles has the Most Immigrants from Western Europe in California with 18,395.
What is the Total Immigrants from Western Europe in the State of California?
Total Immigrants from Western Europe in California is 153,868.
What is the Total Immigrants from Western Europe in the United States?
Total Immigrants from Western Europe in the United States is 924,665.