Maryland Map & Demographics
Maryland Map
Maryland Overview
Apr 28, 1788
INCORPORATED
12,406
TOTAL AREA [ SQ MI ]
9,705
LAND AREA [ SQ MI ]
2,700
WATER AREA [ SQ MI ]
350
ELEVATION AVG [ FT ]
3,360
ELEVATION HIGH [ FT ]
Sea Level
ELEVATION LOW [ FT ]
634.9
POP DENSITY [ PPL / SQ MI ]
$49,865
PER CAPITA INCOME
$120,081
AVG FAMILY INCOME
$98,461
AVG HOUSEHOLD INCOME
21.9%
WAGE / INCOME GAP [ % ]
78.1¢/ $1
WAGE / INCOME GAP [ $ ]
$11,512
FAMILY INCOME DEFICIT
0.46
INEQUALITY / GINI INDEX
20906
LARGEST ZIP CODE
Baltimore
LARGEST CITY
Montgomery County
LARGEST COUNTY
6,161,707
TOTAL POPULATION
3,002,896
MALE POPULATION
3,158,811
FEMALE POPULATION
95.06
MALES / 100 FEMALES
105.19
FEMALES / 100 MALES
39.1
MEDIAN AGE
3.2
AVG FAMILY SIZE
2.6
AVG HOUSEHOLD SIZE
3,331,304
LABOR FORCE [ PEOPLE ]
67.2%
PERCENT IN LABOR FORCE
5.1%
UNEMPLOYMENT RATE
Income in Maryland
Income Overview in Maryland
Per Capita Income in Maryland is $49,865, while median incomes of families and households are $120,081 and $98,461 respectively.
| Characteristic | Number | Measure |
| Per Capita Income | 6,161,707 | $49,865 |
| Median Family Income | 1,525,066 | $120,081 |
| Mean Family Income | 1,525,066 | $152,797 |
| Median Household Income | 2,318,124 | $98,461 |
| Mean Household Income | 2,318,124 | $129,642 |
| Income Deficit | 1,525,066 | $11,512 |
| Wage / Income Gap (%) | 6,161,707 | 21.90% |
| Wage / Income Gap ($) | 6,161,707 | 78.10¢ per $1 |
| Gini / Inequality Index | 6,161,707 | 0.46 |
Earnings by Sex in Maryland
Average Earnings in Maryland are $53,024, $59,324 for men and $46,332 for women, a difference of 21.9%.
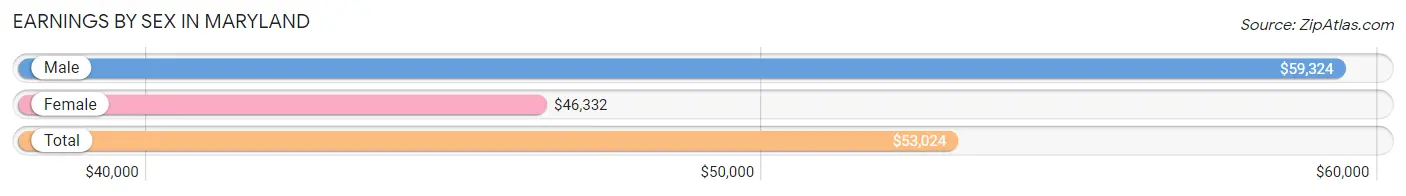
| Sex | Number | Average Earnings |
| Male | 1,761,611 (51.2%) | $59,324 |
| Female | 1,679,767 (48.8%) | $46,332 |
| Total | 3,441,378 (100.0%) | $53,024 |
Earnings by Sex by Income Bracket in Maryland
The most common earnings brackets in Maryland are $100,000+ for men (487,572 | 27.7%) and $100,000+ for women (301,426 | 17.9%).
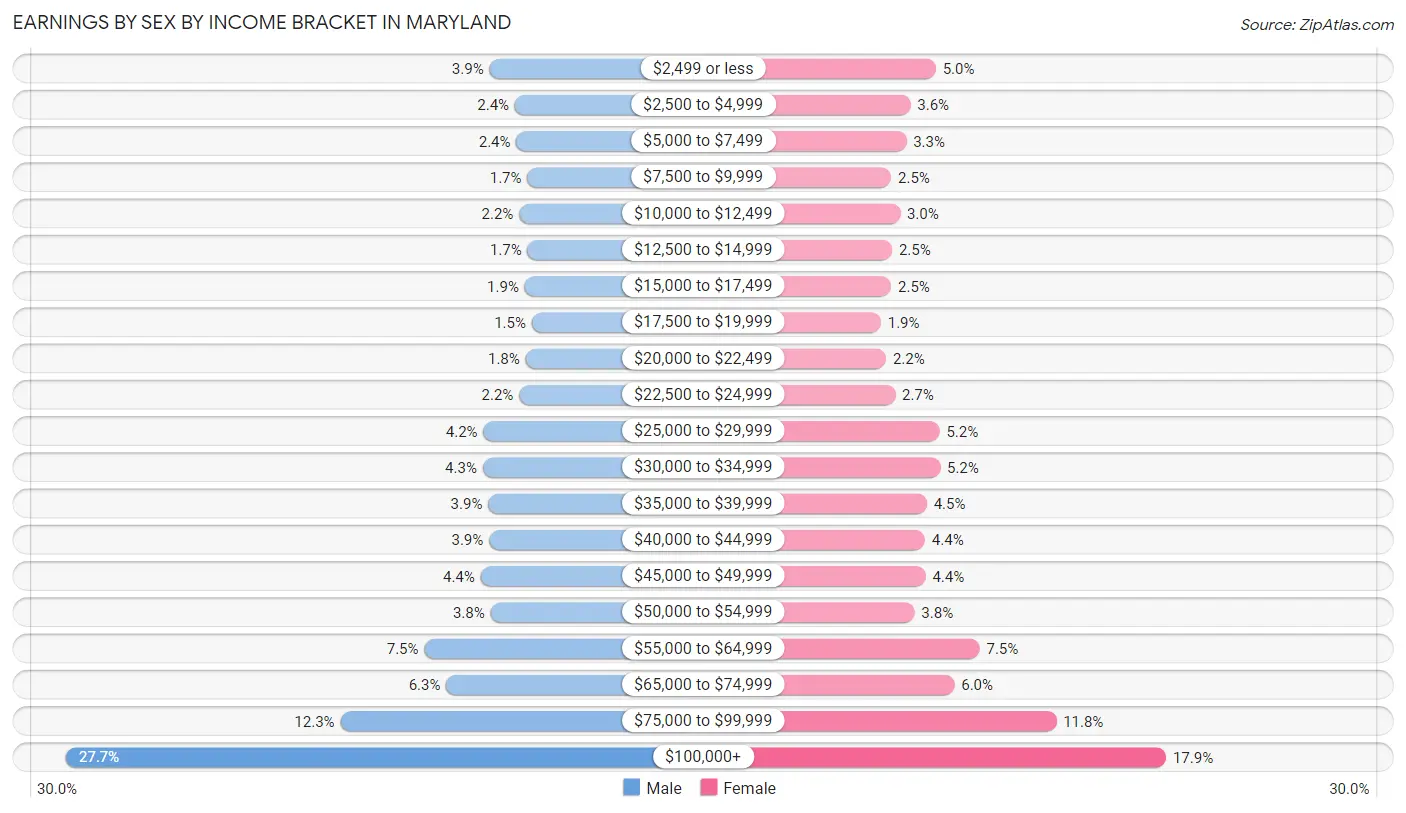
| Income | Male | Female |
| $2,499 or less | 68,227 (3.9%) | 84,048 (5.0%) |
| $2,500 to $4,999 | 42,907 (2.4%) | 60,043 (3.6%) |
| $5,000 to $7,499 | 41,554 (2.4%) | 56,113 (3.3%) |
| $7,500 to $9,999 | 30,680 (1.7%) | 41,870 (2.5%) |
| $10,000 to $12,499 | 38,797 (2.2%) | 50,173 (3.0%) |
| $12,500 to $14,999 | 30,548 (1.7%) | 42,707 (2.5%) |
| $15,000 to $17,499 | 33,265 (1.9%) | 41,825 (2.5%) |
| $17,500 to $19,999 | 26,309 (1.5%) | 32,100 (1.9%) |
| $20,000 to $22,499 | 32,445 (1.8%) | 36,952 (2.2%) |
| $22,500 to $24,999 | 38,720 (2.2%) | 45,448 (2.7%) |
| $25,000 to $29,999 | 74,078 (4.2%) | 87,445 (5.2%) |
| $30,000 to $34,999 | 74,857 (4.3%) | 87,972 (5.2%) |
| $35,000 to $39,999 | 69,345 (3.9%) | 75,364 (4.5%) |
| $40,000 to $44,999 | 68,605 (3.9%) | 73,769 (4.4%) |
| $45,000 to $49,999 | 76,907 (4.4%) | 74,169 (4.4%) |
| $50,000 to $54,999 | 67,174 (3.8%) | 63,905 (3.8%) |
| $55,000 to $64,999 | 132,682 (7.5%) | 125,357 (7.5%) |
| $65,000 to $74,999 | 111,067 (6.3%) | 101,455 (6.0%) |
| $75,000 to $99,999 | 215,872 (12.2%) | 197,626 (11.8%) |
| $100,000+ | 487,572 (27.7%) | 301,426 (17.9%) |
| Total | 1,761,611 (100.0%) | 1,679,767 (100.0%) |
Earnings by Sex by Educational Attainment in Maryland
Average earnings in Maryland are $68,442 for men and $53,968 for women, a difference of 21.1%. Men with an educational attainment of graduate degree enjoy the highest average annual earnings of $119,327, while those with less than high school education earn the least with $39,843. Women with an educational attainment of graduate degree earn the most with the average annual earnings of $88,099, while those with less than high school education have the smallest earnings of $23,975.
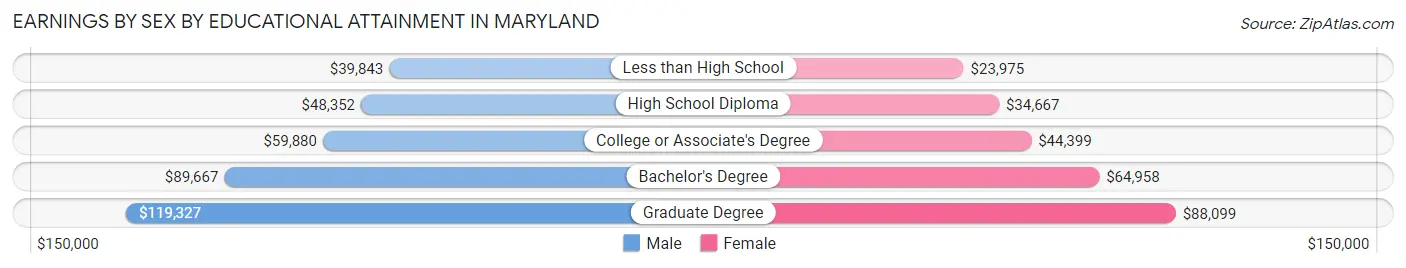
| Educational Attainment | Male Income | Female Income |
| Less than High School | $39,843 | $23,975 |
| High School Diploma | $48,352 | $34,667 |
| College or Associate's Degree | $59,880 | $44,399 |
| Bachelor's Degree | $89,667 | $64,958 |
| Graduate Degree | $119,327 | $88,099 |
| Total | $68,442 | $53,968 |
Family Income in Maryland
Family Income Brackets in Maryland
According to the Maryland family income data, there are 359,916 families falling into the $200,000+ income range, which is the most common income bracket and makes up 23.6% of all families. Conversely, the $10,000 to $14,999 income bracket is the least frequent group with only 18,301 families (1.2%) belonging to this category.
| Income Bracket | # Families | % Families |
| Less than $10,000 | 36,602 | 2.4% |
| $10,000 to $14,999 | 18,301 | 1.2% |
| $15,000 to $24,999 | 45,752 | 3.0% |
| $25,000 to $34,999 | 56,427 | 3.7% |
| $35,000 to $49,999 | 100,654 | 6.6% |
| $50,000 to $74,999 | 179,958 | 11.8% |
| $75,000 to $99,999 | 181,483 | 11.9% |
| $100,000 to $149,999 | 321,789 | 21.1% |
| $150,000 to $199,999 | 224,185 | 14.7% |
| $200,000+ | 359,916 | 23.6% |
Family Income by Famaliy Size in Maryland
4-person families (293,897 | 19.3%) account for the highest median family income in Maryland with $149,249 per family, while 2-person families (671,572 | 44.0%) have the highest median income of $51,972 per family member.
| Income Bracket | # Families | Median Income |
| 2-Person Families | 671,572 (44.0%) | $103,943 |
| 3-Person Families | 357,790 (23.5%) | $123,136 |
| 4-Person Families | 293,897 (19.3%) | $149,249 |
| 5-Person Families | 126,083 (8.3%) | $140,125 |
| 6-Person Families | 46,875 (3.1%) | $133,238 |
| 7+ Person Families | 28,849 (1.9%) | $137,021 |
| Total | 1,525,066 (100.0%) | $120,081 |
Family Income by Number of Earners in Maryland
The median family income in Maryland is $120,081, with families comprising 3+ earners (218,713) having the highest median family income of $177,944, while families with no earners (174,267) have the lowest median family income of $61,423, accounting for 14.3% and 11.4% of families, respectively.
| Number of Earners | # Families | Median Income |
| No Earners | 174,267 (11.4%) | $61,423 |
| 1 Earner | 458,832 (30.1%) | $80,244 |
| 2 Earners | 673,254 (44.2%) | $147,734 |
| 3+ Earners | 218,713 (14.3%) | $177,944 |
| Total | 1,525,066 (100.0%) | $120,081 |
Household Income in Maryland
Household Income Brackets in Maryland
With 447,398 households falling in the category, the $100,000 to $149,999 income range is the most frequent in Maryland, accounting for 19.3% of all households. In contrast, only 60,271 households (2.6%) fall into the $10,000 to $14,999 income bracket, making it the least populous group.
| Income Bracket | # Households | % Households |
| Less than $10,000 | 97,361 | 4.2% |
| $10,000 to $14,999 | 60,271 | 2.6% |
| $15,000 to $24,999 | 111,270 | 4.8% |
| $25,000 to $34,999 | 120,542 | 5.2% |
| $35,000 to $49,999 | 187,768 | 8.1% |
| $50,000 to $74,999 | 315,265 | 13.6% |
| $75,000 to $99,999 | 285,129 | 12.3% |
| $100,000 to $149,999 | 447,398 | 19.3% |
| $150,000 to $199,999 | 280,493 | 12.1% |
| $200,000+ | 414,944 | 17.9% |
Household Income by Householder Age in Maryland
The median household income in Maryland is $98,461, with the highest median household income of $119,705 found in the 45 to 64 years age bracket for the primary householder. A total of 915,094 households (39.5%) fall into this category. Meanwhile, the 15 to 24 years age bracket for the primary householder has the lowest median household income of $49,616, with 59,157 households (2.5%) in this group.
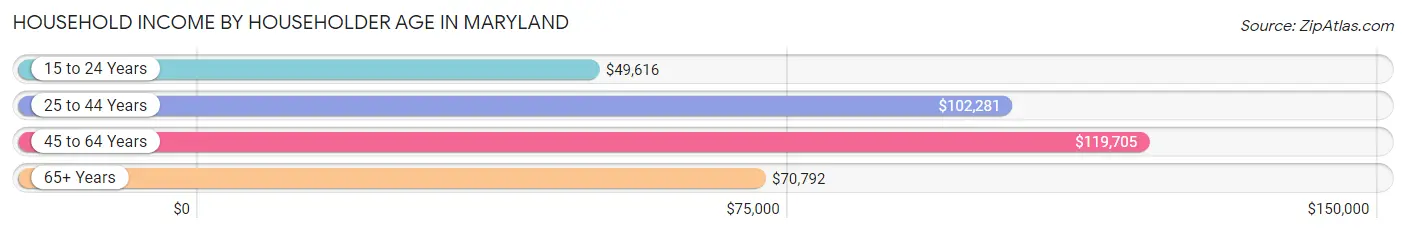
| Income Bracket | # Households | Median Income |
| 15 to 24 Years | 59,157 (2.5%) | $49,616 |
| 25 to 44 Years | 743,827 (32.1%) | $102,281 |
| 45 to 64 Years | 915,094 (39.5%) | $119,705 |
| 65+ Years | 600,046 (25.9%) | $70,792 |
| Total | 2,318,124 (100.0%) | $98,461 |
Poverty in Maryland
Income Below Poverty by Sex and Age in Maryland
With 8.2% poverty level for males and 10.2% for females among the residents of Maryland, 5 year old males and 18 to 24 year old females are the most vulnerable to poverty, with 5,019 males (14.1%) and 38,461 females (15.9%) in their respective age groups living below the poverty level.
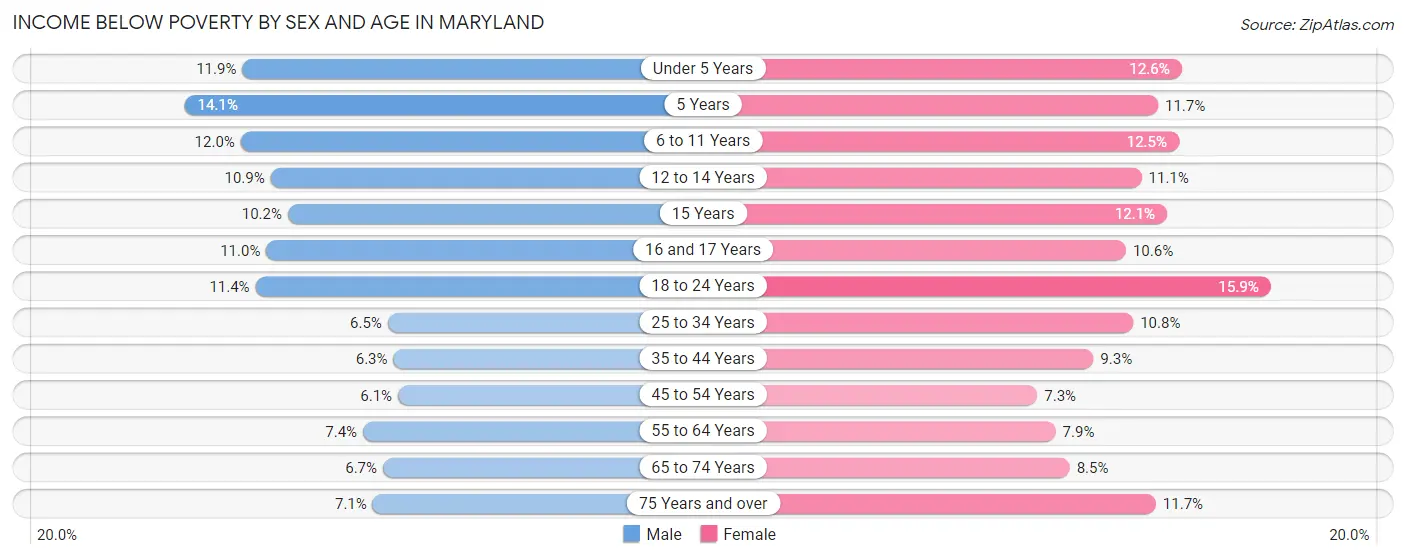
| Age Bracket | Male | Female |
| Under 5 Years | 21,315 (11.9%) | 21,812 (12.6%) |
| 5 Years | 5,019 (14.1%) | 4,156 (11.7%) |
| 6 to 11 Years | 27,615 (12.0%) | 27,367 (12.5%) |
| 12 to 14 Years | 12,983 (10.9%) | 12,634 (11.1%) |
| 15 Years | 4,088 (10.2%) | 4,764 (12.1%) |
| 16 and 17 Years | 8,751 (11.0%) | 7,970 (10.5%) |
| 18 to 24 Years | 28,384 (11.4%) | 38,461 (15.9%) |
| 25 to 34 Years | 26,119 (6.5%) | 44,527 (10.8%) |
| 35 to 44 Years | 24,873 (6.3%) | 38,525 (9.3%) |
| 45 to 54 Years | 23,736 (6.1%) | 29,738 (7.3%) |
| 55 to 64 Years | 29,582 (7.4%) | 34,175 (7.9%) |
| 65 to 74 Years | 17,646 (6.7%) | 26,315 (8.5%) |
| 75 Years and over | 11,082 (7.1%) | 26,930 (11.7%) |
| Total | 241,193 (8.2%) | 317,374 (10.2%) |
Income Above Poverty by Sex and Age in Maryland
According to the poverty statistics in Maryland, males aged 45 to 54 years and females aged 45 to 54 years are the age groups that are most secure financially, with 93.9% of males and 92.7% of females in these age groups living above the poverty line.
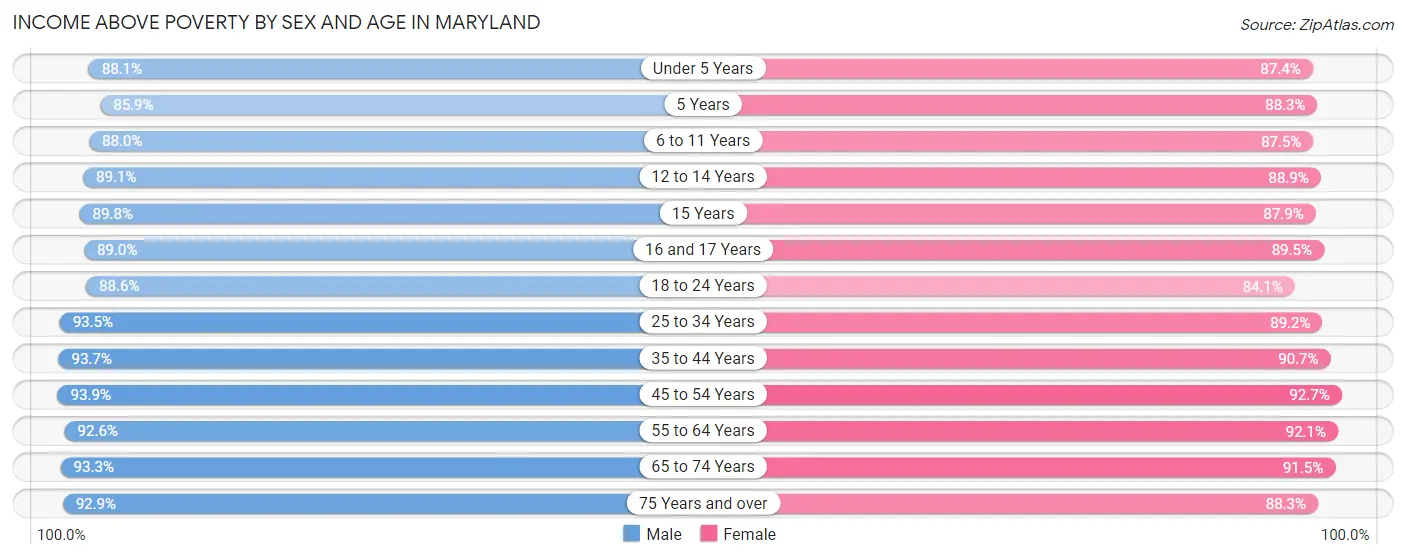
| Age Bracket | Male | Female |
| Under 5 Years | 157,538 (88.1%) | 151,220 (87.4%) |
| 5 Years | 30,679 (85.9%) | 31,256 (88.3%) |
| 6 to 11 Years | 202,889 (88.0%) | 191,361 (87.5%) |
| 12 to 14 Years | 106,427 (89.1%) | 100,896 (88.9%) |
| 15 Years | 35,864 (89.8%) | 34,712 (87.9%) |
| 16 and 17 Years | 70,614 (89.0%) | 67,585 (89.4%) |
| 18 to 24 Years | 219,965 (88.6%) | 203,126 (84.1%) |
| 25 to 34 Years | 374,390 (93.5%) | 366,854 (89.2%) |
| 35 to 44 Years | 369,148 (93.7%) | 374,142 (90.7%) |
| 45 to 54 Years | 363,145 (93.9%) | 379,813 (92.7%) |
| 55 to 64 Years | 367,929 (92.6%) | 395,981 (92.1%) |
| 65 to 74 Years | 245,839 (93.3%) | 284,787 (91.5%) |
| 75 Years and over | 145,474 (92.9%) | 204,119 (88.3%) |
| Total | 2,689,901 (91.8%) | 2,785,852 (89.8%) |
Income Below Poverty Among Married-Couple Families in Maryland
The poverty statistics for married-couple families in Maryland show that 3.0% or 33,104 of the total 1,092,896 families live below the poverty line. Families with 5 or more children have the highest poverty rate of 13.7%, comprising of 983 families. On the other hand, families with no children have the lowest poverty rate of 2.4%, which includes 15,176 families.
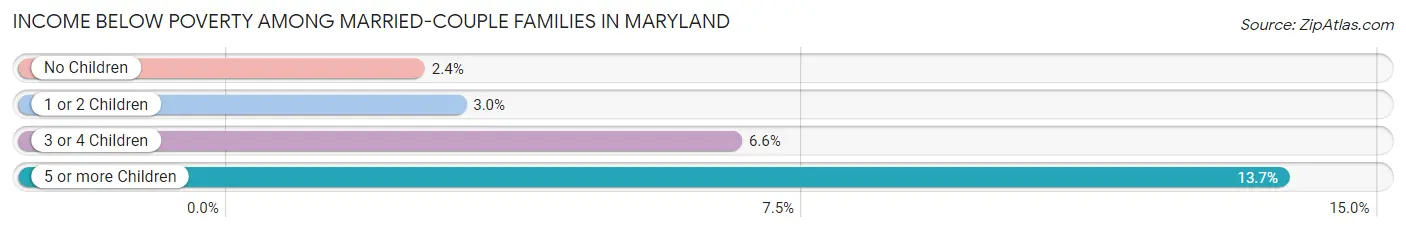
| Children | Above Poverty | Below Poverty |
| No Children | 607,852 (97.6%) | 15,176 (2.4%) |
| 1 or 2 Children | 363,751 (97.0%) | 11,168 (3.0%) |
| 3 or 4 Children | 82,013 (93.4%) | 5,777 (6.6%) |
| 5 or more Children | 6,176 (86.3%) | 983 (13.7%) |
| Total | 1,059,792 (97.0%) | 33,104 (3.0%) |
Income Below Poverty Among Single-Parent Households in Maryland
According to the poverty data in Maryland, 8.3% or 9,374 single-father households and 16.4% or 52,301 single-mother households are living below the poverty line. Among single-father households, those with 5 or more children have the highest poverty rate, with 125 households (20.5%) experiencing poverty. Likewise, among single-mother households, those with 5 or more children have the highest poverty rate, with 1,243 households (53.4%) falling below the poverty line.
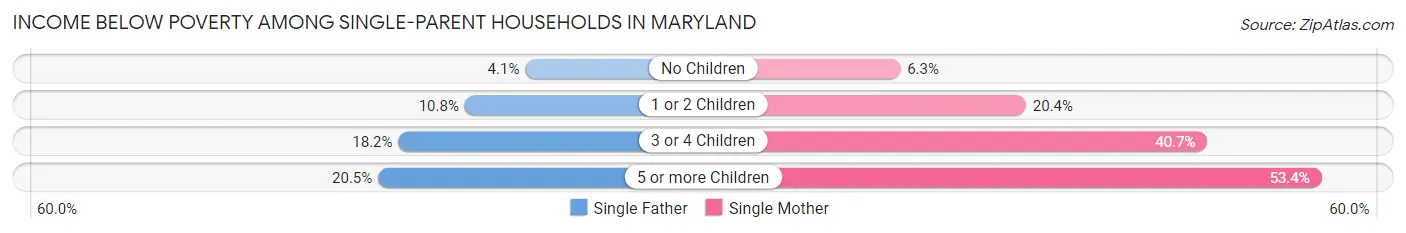
| Children | Single Father | Single Mother |
| No Children | 2,123 (4.1%) | 8,538 (6.3%) |
| 1 or 2 Children | 5,524 (10.8%) | 31,479 (20.4%) |
| 3 or 4 Children | 1,602 (18.2%) | 11,041 (40.6%) |
| 5 or more Children | 125 (20.5%) | 1,243 (53.4%) |
| Total | 9,374 (8.3%) | 52,301 (16.4%) |
Income Below Poverty Among Married-Couple vs Single-Parent Households in Maryland
The poverty data for Maryland shows that 33,104 of the married-couple family households (3.0%) and 61,675 of the single-parent households (14.3%) are living below the poverty level. Within the married-couple family households, those with 5 or more children have the highest poverty rate, with 983 households (13.7%) falling below the poverty line. Among the single-parent households, those with 5 or more children have the highest poverty rate, with 1,368 household (46.6%) living below poverty.
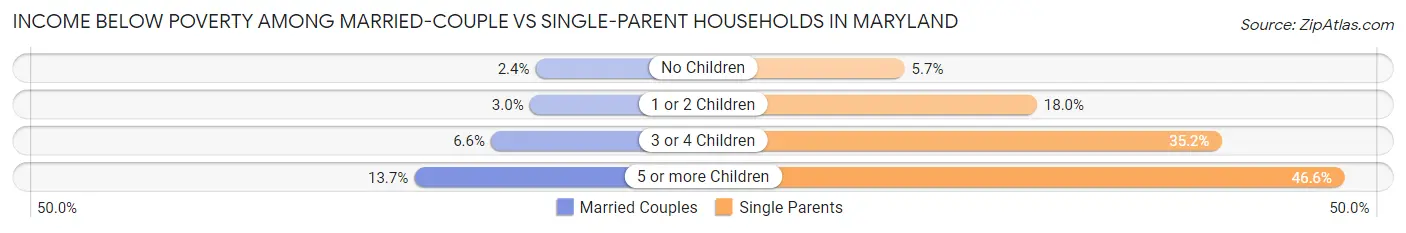
| Children | Married-Couple Families | Single-Parent Households |
| No Children | 15,176 (2.4%) | 10,661 (5.7%) |
| 1 or 2 Children | 11,168 (3.0%) | 37,003 (18.0%) |
| 3 or 4 Children | 5,777 (6.6%) | 12,643 (35.2%) |
| 5 or more Children | 983 (13.7%) | 1,368 (46.6%) |
| Total | 33,104 (3.0%) | 61,675 (14.3%) |
Largest Zip Codes by Population in Maryland
The largest zip codes in Maryland by population are 20906 (71,560), 21234 (66,095), 20878 (65,954), 21740 (62,760), and 20874 (61,922).
1.20906
71,560 (1.16%)
2.21234
66,095 (1.07%)
3.20878
65,954 (1.07%)
4.21740
62,760 (1.02%)
5.20874
61,922 (1.00%)
6.21122
61,444 (1.00%)
7.21222
60,013 (0.97%)
8.21117
58,516 (0.95%)
9.20904
56,532 (0.92%)
10.20744
55,820 (0.91%)
11.21061
55,172 (0.90%)
12.21215
53,674 (0.87%)
13.20902
53,308 (0.87%)
14.20772
52,596 (0.85%)
15.21207
51,765 (0.84%)
16.20850
51,072 (0.83%)
17.21206
51,020 (0.83%)
18.20774
51,010 (0.83%)
19.20783
50,387 (0.82%)
20.21228
50,268 (0.82%)
21.20854
49,320 (0.80%)
22.20852
48,379 (0.79%)
23.21043
47,309 (0.77%)
24.21702
46,596 (0.76%)
25.21218
46,548 (0.76%)
26.21044
45,100 (0.73%)
27.21921
45,081 (0.73%)
28.20910
45,072 (0.73%)
29.21224
44,915 (0.73%)
30.21229
44,332 (0.72%)
Largest Cities by Population in Maryland
The largest cities in Maryland by population are Baltimore (584,548), Columbia (106,600), Germantown (90,210), Silver Spring (81,808), and Waldorf (81,077).
584,548 (9.49%)
2.Columbia
106,600 (1.73%)
90,210 (1.46%)
81,808 (1.33%)
5.Waldorf
81,077 (1.32%)
78,390 (1.27%)
73,589 (1.19%)
71,427 (1.16%)
69,016 (1.12%)
10.Rockville
67,142 (1.09%)
11.Dundalk
66,321 (1.08%)
12.Bethesda
66,316 (1.08%)
13.Bowie
57,922 (0.94%)
14.Towson
57,617 (0.94%)
57,109 (0.93%)
16.Severn
56,438 (0.92%)
17.Aspen Hill
54,262 (0.88%)
18.Wheaton
52,775 (0.86%)
49,763 (0.81%)
20.Potomac
46,499 (0.75%)
21.Odenton
45,026 (0.73%)
22.Hagerstown
43,374 (0.70%)
23.Catonsville
42,767 (0.69%)
42,239 (0.69%)
25.Essex
40,842 (0.66%)
26.Annapolis
40,719 (0.66%)
27.Severna Park
40,452 (0.66%)
28.Clinton
40,224 (0.65%)
29.Randallstown
36,223 (0.59%)
30.Chillum
35,908 (0.58%)
Largest Counties by Population in Maryland
The largest counties in Maryland by population are Montgomery County (1,056,910), Prince George's County (957,189), Baltimore County (850,737), Anne Arundel County (588,109), and Baltimore city (584,548).
1,056,910 (17.15%)
957,189 (15.53%)
850,737 (13.81%)
588,109 (9.54%)
584,548 (9.49%)
332,011 (5.39%)
273,829 (4.44%)
261,059 (4.24%)
173,225 (2.81%)
167,035 (2.71%)
154,645 (2.51%)
113,814 (1.85%)
13.Cecil County
103,876 (1.69%)
103,815 (1.68%)
93,244 (1.51%)
68,161 (1.11%)
52,827 (0.86%)
50,316 (0.82%)
37,663 (0.61%)
33,320 (0.54%)
32,557 (0.53%)
28,856 (0.47%)
24,672 (0.40%)
24.Kent County
19,289 (0.31%)
Race in Maryland
The most populous races in Maryland are White / Caucasian (3,154,247 | 51.2%), Black / African American (1,841,926 | 29.9%), and Hispanic or Latino (672,905 | 10.9%).
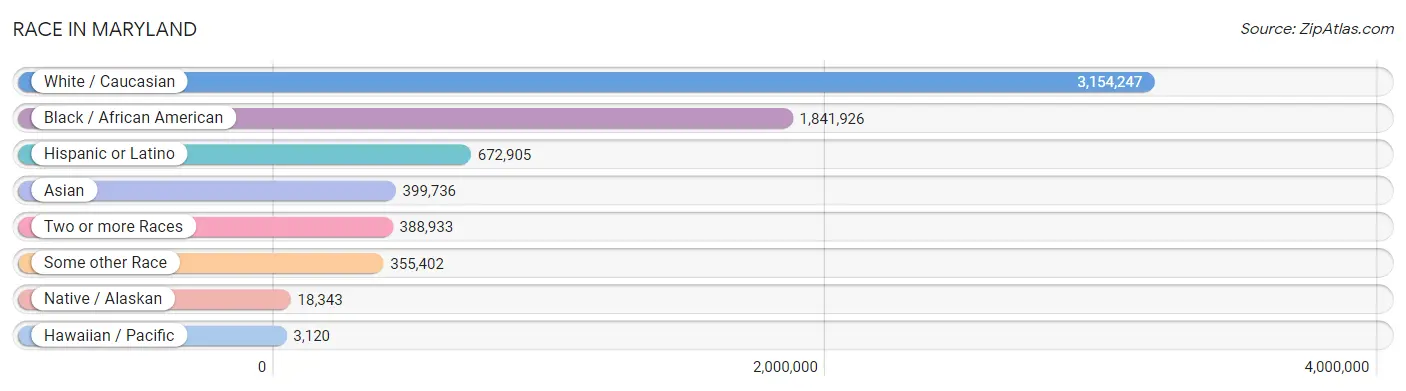
| Race | # Population | % Population |
| Asian | 399,736 | 6.5% |
| Black / African American | 1,841,926 | 29.9% |
| Hawaiian / Pacific | 3,120 | 0.1% |
| Hispanic or Latino | 672,905 | 10.9% |
| Native / Alaskan | 18,343 | 0.3% |
| White / Caucasian | 3,154,247 | 51.2% |
| Two or more Races | 388,933 | 6.3% |
| Some other Race | 355,402 | 5.8% |
| Total | 6,161,707 | 100.0% |
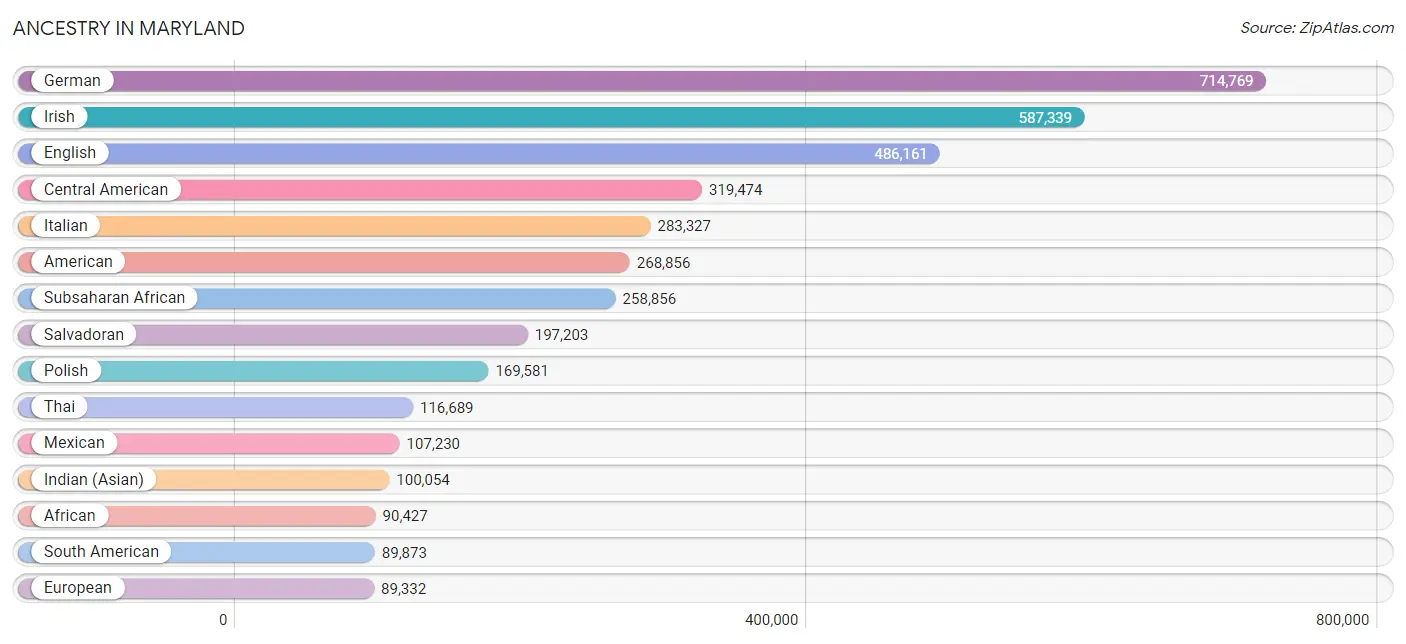
Ancestry in Maryland
The most populous ancestries reported in Maryland are German (714,769 | 11.6%), Irish (587,339 | 9.5%), English (486,161 | 7.9%), Central American (319,474 | 5.2%), and Italian (283,327 | 4.6%), together accounting for 38.8% of all Maryland residents.
| Ancestry | # Population | % Population |
| Afghan | 4,483 | 0.1% |
| African | 90,427 | 1.5% |
| Alaska Native | 95 | 0.0% |
| Albanian | 1,897 | 0.0% |
| Aleut | 156 | 0.0% |
| Alsatian | 172 | 0.0% |
| American | 268,856 | 4.4% |
| Apache | 789 | 0.0% |
| Arab | 36,973 | 0.6% |
| Arapaho | 75 | 0.0% |
| Argentinean | 7,221 | 0.1% |
| Armenian | 4,160 | 0.1% |
| Assyrian / Chaldean / Syriac | 143 | 0.0% |
| Australian | 1,574 | 0.0% |
| Austrian | 12,356 | 0.2% |
| Bahamian | 868 | 0.0% |
| Bangladeshi | 224 | 0.0% |
| Barbadian | 2,448 | 0.0% |
| Basque | 444 | 0.0% |
| Belgian | 3,525 | 0.1% |
| Belizean | 476 | 0.0% |
| Bermudan | 642 | 0.0% |
| Bhutanese | 19,493 | 0.3% |
| Blackfeet | 4,108 | 0.1% |
| Bolivian | 10,899 | 0.2% |
| Brazilian | 11,584 | 0.2% |
| British | 36,223 | 0.6% |
| British West Indian | 4,051 | 0.1% |
| Bulgarian | 2,417 | 0.0% |
| Burmese | 59,026 | 1.0% |
| Cajun | 637 | 0.0% |
| Cambodian | 842 | 0.0% |
| Canadian | 5,974 | 0.1% |
| Cape Verdean | 1,290 | 0.0% |
| Carpatho Rusyn | 243 | 0.0% |
| Celtic | 839 | 0.0% |
| Central American | 319,474 | 5.2% |
| Central American Indian | 8,187 | 0.1% |
| Cherokee | 13,940 | 0.2% |
| Cheyenne | 193 | 0.0% |
| Chickasaw | 124 | 0.0% |
| Chilean | 4,555 | 0.1% |
| Chinese | 130 | 0.0% |
| Chippewa | 379 | 0.0% |
| Choctaw | 877 | 0.0% |
| Colombian | 20,129 | 0.3% |
| Colville | 18 | 0.0% |
| Comanche | 74 | 0.0% |
| Costa Rican | 3,527 | 0.1% |
| Cree | 180 | 0.0% |
| Creek | 590 | 0.0% |
| Croatian | 4,240 | 0.1% |
| Crow | 24 | 0.0% |
| Cuban | 14,057 | 0.2% |
| Cypriot | 280 | 0.0% |
| Czech | 17,723 | 0.3% |
| Czechoslovakian | 4,721 | 0.1% |
| Danish | 9,348 | 0.2% |
| Delaware | 475 | 0.0% |
| Dominican | 28,246 | 0.5% |
| Dutch | 35,106 | 0.6% |
| Dutch West Indian | 82 | 0.0% |
| Eastern European | 34,084 | 0.5% |
| Ecuadorian | 10,475 | 0.2% |
| Egyptian | 6,846 | 0.1% |
| English | 486,161 | 7.9% |
| Estonian | 1,122 | 0.0% |
| Ethiopian | 38,066 | 0.6% |
| European | 89,332 | 1.5% |
| Fijian | 15 | 0.0% |
| Filipino | 6,209 | 0.1% |
| Finnish | 6,293 | 0.1% |
| French | 80,327 | 1.3% |
| French American Indian | 264 | 0.0% |
| French Canadian | 15,422 | 0.3% |
| German | 714,769 | 11.6% |
| German Russian | 657 | 0.0% |
| Ghanaian | 15,933 | 0.3% |
| Greek | 30,396 | 0.5% |
| Guamanian / Chamorro | 1,593 | 0.0% |
| Guatemalan | 64,033 | 1.0% |
| Guyanese | 8,441 | 0.1% |
| Haitian | 17,432 | 0.3% |
| Hmong | 51 | 0.0% |
| Honduran | 36,860 | 0.6% |
| Hopi | 44 | 0.0% |
| Houma | 24 | 0.0% |
| Hungarian | 20,667 | 0.3% |
| Icelander | 851 | 0.0% |
| Indian (Asian) | 100,054 | 1.6% |
| Indonesian | 6,337 | 0.1% |
| Inupiat | 135 | 0.0% |
| Iranian | 16,710 | 0.3% |
| Iraqi | 1,385 | 0.0% |
| Irish | 587,339 | 9.5% |
| Iroquois | 1,072 | 0.0% |
| Israeli | 3,934 | 0.1% |
| Italian | 283,327 | 4.6% |
| Jamaican | 46,141 | 0.7% |
| Japanese | 3,732 | 0.1% |
| Jordanian | 1,020 | 0.0% |
| Kenyan | 5,937 | 0.1% |
| Kiowa | 31 | 0.0% |
| Korean | 72,780 | 1.2% |
| Laotian | 4,341 | 0.1% |
| Latvian | 2,478 | 0.0% |
| Lebanese | 7,429 | 0.1% |
| Liberian | 4,304 | 0.1% |
| Lithuanian | 15,806 | 0.3% |
| Lumbee | 1,889 | 0.0% |
| Luxembourger | 263 | 0.0% |
| Macedonian | 321 | 0.0% |
| Malaysian | 1,372 | 0.0% |
| Maltese | 430 | 0.0% |
| Menominee | 6 | 0.0% |
| Mexican | 107,230 | 1.7% |
| Mexican American Indian | 2,853 | 0.1% |
| Mongolian | 740 | 0.0% |
| Moroccan | 3,364 | 0.1% |
| Native Hawaiian | 4,486 | 0.1% |
| Navajo | 867 | 0.0% |
| Nepalese | 56 | 0.0% |
| New Zealander | 293 | 0.0% |
| Nicaraguan | 10,453 | 0.2% |
| Nigerian | 56,370 | 0.9% |
| Northern European | 8,072 | 0.1% |
| Norwegian | 28,427 | 0.5% |
| Okinawan | 178 | 0.0% |
| Osage | 223 | 0.0% |
| Ottawa | 46 | 0.0% |
| Paiute | 54 | 0.0% |
| Pakistani | 7,445 | 0.1% |
| Palestinian | 2,851 | 0.1% |
| Panamanian | 6,873 | 0.1% |
| Paraguayan | 1,160 | 0.0% |
| Pennsylvania German | 2,970 | 0.1% |
| Peruvian | 26,284 | 0.4% |
| Pima | 10 | 0.0% |
| Polish | 169,581 | 2.8% |
| Portuguese | 11,563 | 0.2% |
| Potawatomi | 42 | 0.0% |
| Pueblo | 176 | 0.0% |
| Puerto Rican | 62,339 | 1.0% |
| Puget Sound Salish | 87 | 0.0% |
| Romanian | 7,004 | 0.1% |
| Russian | 60,101 | 1.0% |
| Salvadoran | 197,203 | 3.2% |
| Samoan | 1,016 | 0.0% |
| Scandinavian | 11,168 | 0.2% |
| Scotch-Irish | 38,348 | 0.6% |
| Scottish | 83,199 | 1.3% |
| Seminole | 446 | 0.0% |
| Senegalese | 1,835 | 0.0% |
| Serbian | 3,012 | 0.1% |
| Shoshone | 48 | 0.0% |
| Sierra Leonean | 6,354 | 0.1% |
| Sioux | 1,107 | 0.0% |
| Slavic | 2,420 | 0.0% |
| Slovak | 11,827 | 0.2% |
| Slovene | 2,334 | 0.0% |
| Somali | 455 | 0.0% |
| South African | 2,250 | 0.0% |
| South American | 89,873 | 1.5% |
| South American Indian | 2,305 | 0.0% |
| Soviet Union | 135 | 0.0% |
| Spaniard | 10,277 | 0.2% |
| Spanish | 9,509 | 0.2% |
| Spanish American | 133 | 0.0% |
| Spanish American Indian | 102 | 0.0% |
| Sri Lankan | 33,588 | 0.5% |
| Subsaharan African | 258,856 | 4.2% |
| Sudanese | 2,226 | 0.0% |
| Swedish | 30,339 | 0.5% |
| Swiss | 11,354 | 0.2% |
| Syrian | 3,325 | 0.1% |
| Taiwanese | 74 | 0.0% |
| Thai | 116,689 | 1.9% |
| Tlingit-Haida | 7 | 0.0% |
| Tongan | 203 | 0.0% |
| Trinidadian and Tobagonian | 13,163 | 0.2% |
| Turkish | 6,510 | 0.1% |
| U.S. Virgin Islander | 709 | 0.0% |
| Ugandan | 1,172 | 0.0% |
| Ukrainian | 21,075 | 0.3% |
| Uruguayan | 1,362 | 0.0% |
| Ute | 23 | 0.0% |
| Venezuelan | 6,704 | 0.1% |
| Vietnamese | 6,036 | 0.1% |
| Welsh | 32,616 | 0.5% |
| West Indian | 10,755 | 0.2% |
| Yaqui | 75 | 0.0% |
| Yugoslavian | 1,443 | 0.0% |
| Yuman | 217 | 0.0% |
| Yup'ik | 23 | 0.0% |
| Zimbabwean | 1,160 | 0.0% | View All 195 Rows |
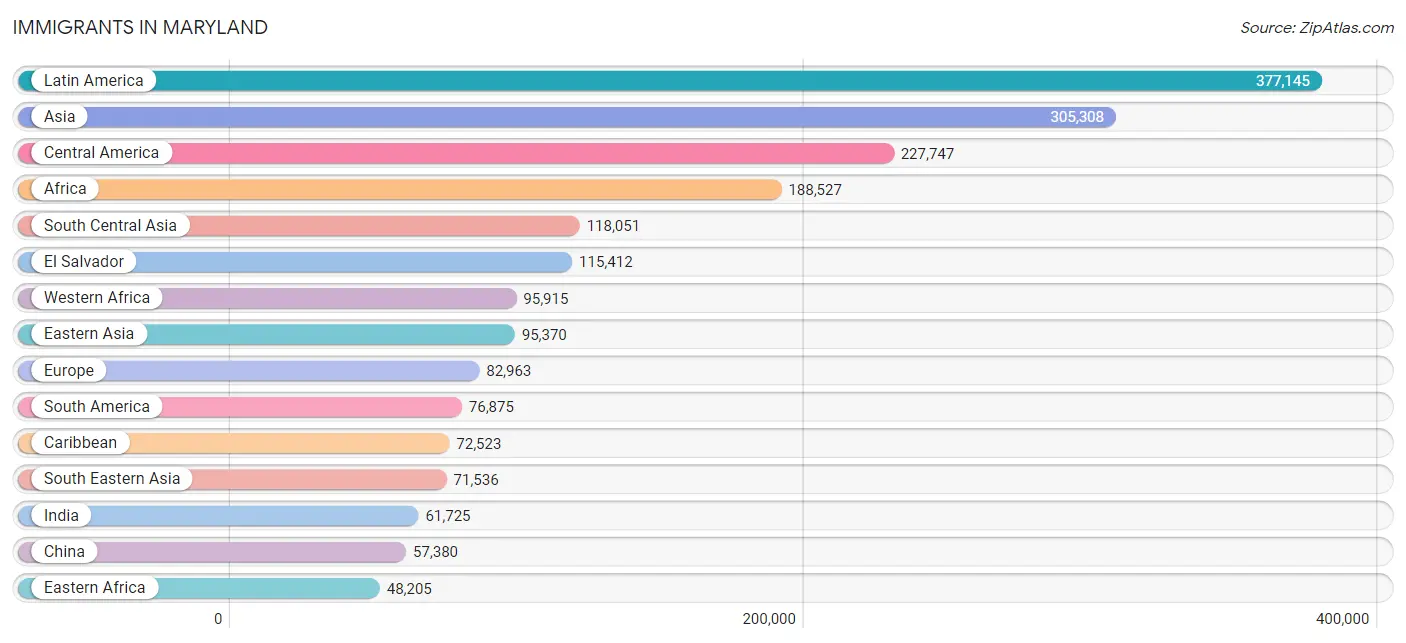
Immigrants in Maryland
The most numerous immigrant groups reported in Maryland came from Latin America (377,145 | 6.1%), Asia (305,308 | 5.0%), Central America (227,747 | 3.7%), Africa (188,527 | 3.1%), and South Central Asia (118,051 | 1.9%), together accounting for 19.7% of all Maryland residents.
| Immigration Origin | # Population | % Population |
| Afghanistan | 3,905 | 0.1% |
| Africa | 188,527 | 3.1% |
| Albania | 617 | 0.0% |
| Argentina | 4,282 | 0.1% |
| Armenia | 442 | 0.0% |
| Asia | 305,308 | 5.0% |
| Australia | 1,764 | 0.0% |
| Austria | 626 | 0.0% |
| Azores | 73 | 0.0% |
| Bahamas | 699 | 0.0% |
| Bangladesh | 7,124 | 0.1% |
| Barbados | 1,625 | 0.0% |
| Belarus | 1,273 | 0.0% |
| Belgium | 1,098 | 0.0% |
| Belize | 476 | 0.0% |
| Bolivia | 7,000 | 0.1% |
| Bosnia and Herzegovina | 590 | 0.0% |
| Brazil | 11,980 | 0.2% |
| Bulgaria | 1,767 | 0.0% |
| Cabo Verde | 135 | 0.0% |
| Cambodia | 1,581 | 0.0% |
| Cameroon | 23,969 | 0.4% |
| Canada | 8,603 | 0.1% |
| Caribbean | 72,523 | 1.2% |
| Central America | 227,747 | 3.7% |
| Chile | 2,475 | 0.0% |
| China | 57,380 | 0.9% |
| Colombia | 12,898 | 0.2% |
| Congo | 494 | 0.0% |
| Costa Rica | 2,452 | 0.0% |
| Croatia | 236 | 0.0% |
| Cuba | 3,238 | 0.1% |
| Czechoslovakia | 1,473 | 0.0% |
| Denmark | 462 | 0.0% |
| Dominica | 403 | 0.0% |
| Dominican Republic | 13,947 | 0.2% |
| Eastern Africa | 48,205 | 0.8% |
| Eastern Asia | 95,370 | 1.5% |
| Eastern Europe | 34,645 | 0.6% |
| Ecuador | 6,211 | 0.1% |
| Egypt | 4,414 | 0.1% |
| El Salvador | 115,412 | 1.9% |
| England | 5,828 | 0.1% |
| Eritrea | 2,915 | 0.1% |
| Ethiopia | 30,870 | 0.5% |
| Europe | 82,963 | 1.3% |
| Fiji | 228 | 0.0% |
| France | 4,217 | 0.1% |
| Germany | 11,265 | 0.2% |
| Ghana | 17,774 | 0.3% |
| Greece | 2,415 | 0.0% |
| Grenada | 916 | 0.0% |
| Guatemala | 42,350 | 0.7% |
| Guyana | 8,109 | 0.1% |
| Haiti | 9,100 | 0.2% |
| Honduras | 24,026 | 0.4% |
| Hong Kong | 4,118 | 0.1% |
| Hungary | 904 | 0.0% |
| India | 61,725 | 1.0% |
| Indonesia | 2,631 | 0.0% |
| Iran | 12,074 | 0.2% |
| Iraq | 1,697 | 0.0% |
| Ireland | 1,714 | 0.0% |
| Israel | 3,756 | 0.1% |
| Italy | 4,596 | 0.1% |
| Jamaica | 27,444 | 0.4% |
| Japan | 4,995 | 0.1% |
| Jordan | 1,277 | 0.0% |
| Kazakhstan | 618 | 0.0% |
| Kenya | 7,497 | 0.1% |
| Korea | 32,635 | 0.5% |
| Kuwait | 765 | 0.0% |
| Laos | 1,211 | 0.0% |
| Latin America | 377,145 | 6.1% |
| Latvia | 805 | 0.0% |
| Lebanon | 1,454 | 0.0% |
| Liberia | 5,959 | 0.1% |
| Lithuania | 310 | 0.0% |
| Malaysia | 1,206 | 0.0% |
| Mexico | 34,065 | 0.5% |
| Micronesia | 6 | 0.0% |
| Middle Africa | 27,057 | 0.4% |
| Moldova | 767 | 0.0% |
| Morocco | 2,063 | 0.0% |
| Nepal | 10,205 | 0.2% |
| Netherlands | 1,463 | 0.0% |
| Nicaragua | 5,899 | 0.1% |
| Nigeria | 44,825 | 0.7% |
| North Macedonia | 152 | 0.0% |
| Northern Africa | 9,113 | 0.2% |
| Northern Europe | 17,549 | 0.3% |
| Norway | 581 | 0.0% |
| Oceania | 2,500 | 0.0% |
| Pakistan | 17,037 | 0.3% |
| Panama | 2,848 | 0.1% |
| Peru | 17,161 | 0.3% |
| Philippines | 36,698 | 0.6% |
| Poland | 3,418 | 0.1% |
| Portugal | 1,431 | 0.0% |
| Romania | 2,576 | 0.0% |
| Russia | 9,481 | 0.2% |
| Saudi Arabia | 1,053 | 0.0% |
| Scotland | 738 | 0.0% |
| Senegal | 2,822 | 0.1% |
| Serbia | 751 | 0.0% |
| Sierra Leone | 10,233 | 0.2% |
| Singapore | 704 | 0.0% |
| Somalia | 448 | 0.0% |
| South Africa | 3,203 | 0.1% |
| South America | 76,875 | 1.3% |
| South Central Asia | 118,051 | 1.9% |
| South Eastern Asia | 71,536 | 1.2% |
| Southern Europe | 11,082 | 0.2% |
| Spain | 2,547 | 0.0% |
| Sri Lanka | 3,410 | 0.1% |
| St. Vincent and the Grenadines | 529 | 0.0% |
| Sudan | 1,757 | 0.0% |
| Sweden | 789 | 0.0% |
| Switzerland | 778 | 0.0% |
| Syria | 2,145 | 0.0% |
| Taiwan | 8,520 | 0.1% |
| Thailand | 3,874 | 0.1% |
| Trinidad and Tobago | 11,481 | 0.2% |
| Turkey | 3,850 | 0.1% |
| Uganda | 1,672 | 0.0% |
| Ukraine | 6,326 | 0.1% |
| Uruguay | 667 | 0.0% |
| Uzbekistan | 1,262 | 0.0% |
| Venezuela | 4,901 | 0.1% |
| Vietnam | 18,716 | 0.3% |
| West Indies | 920 | 0.0% |
| Western Africa | 95,915 | 1.6% |
| Western Asia | 19,614 | 0.3% |
| Western Europe | 19,607 | 0.3% |
| Yemen | 512 | 0.0% |
| Zaire | 1,861 | 0.0% |
| Zimbabwe | 1,254 | 0.0% | View All 137 Rows |
Sex and Age in Maryland
Sex and Age in Maryland
The most populous age groups in Maryland are 35 to 39 Years (211,066 | 7.0%) for men and 55 to 59 Years (220,831 | 7.0%) for women.
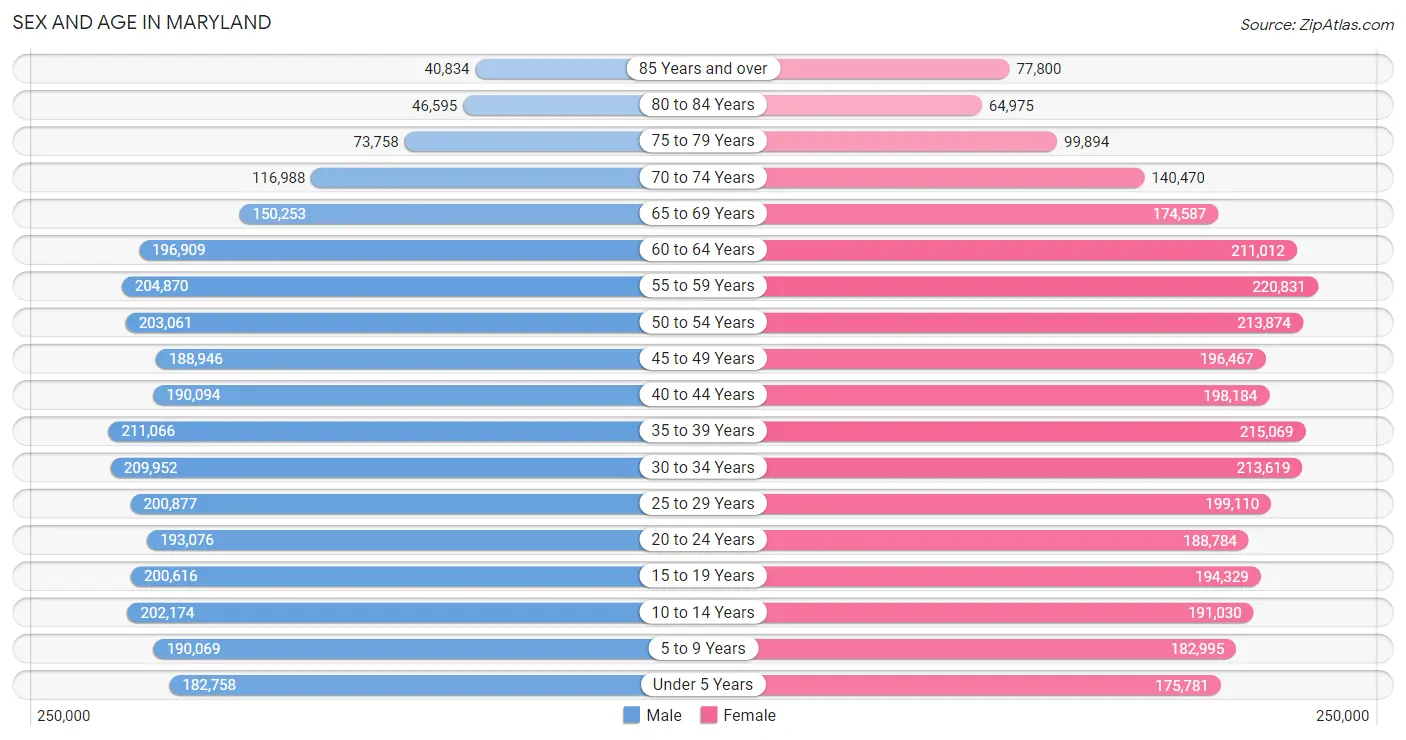
| Age Bracket | Male | Female |
| Under 5 Years | 182,758 (6.1%) | 175,781 (5.6%) |
| 5 to 9 Years | 190,069 (6.3%) | 182,995 (5.8%) |
| 10 to 14 Years | 202,174 (6.7%) | 191,030 (6.0%) |
| 15 to 19 Years | 200,616 (6.7%) | 194,329 (6.1%) |
| 20 to 24 Years | 193,076 (6.4%) | 188,784 (6.0%) |
| 25 to 29 Years | 200,877 (6.7%) | 199,110 (6.3%) |
| 30 to 34 Years | 209,952 (7.0%) | 213,619 (6.8%) |
| 35 to 39 Years | 211,066 (7.0%) | 215,069 (6.8%) |
| 40 to 44 Years | 190,094 (6.3%) | 198,184 (6.3%) |
| 45 to 49 Years | 188,946 (6.3%) | 196,467 (6.2%) |
| 50 to 54 Years | 203,061 (6.8%) | 213,874 (6.8%) |
| 55 to 59 Years | 204,870 (6.8%) | 220,831 (7.0%) |
| 60 to 64 Years | 196,909 (6.6%) | 211,012 (6.7%) |
| 65 to 69 Years | 150,253 (5.0%) | 174,587 (5.5%) |
| 70 to 74 Years | 116,988 (3.9%) | 140,470 (4.4%) |
| 75 to 79 Years | 73,758 (2.5%) | 99,894 (3.2%) |
| 80 to 84 Years | 46,595 (1.5%) | 64,975 (2.1%) |
| 85 Years and over | 40,834 (1.4%) | 77,800 (2.5%) |
| Total | 3,002,896 (100.0%) | 3,158,811 (100.0%) |
Families and Households in Maryland
Median Family Size in Maryland
The median family size in Maryland is 3.21 persons per family, with married-couple families (1,092,896 | 71.7%) accounting for the largest median family size of 3.26 persons per family. On the other hand, single male/father families (112,991 | 7.4%) represent the smallest median family size with 2.90 persons per family.
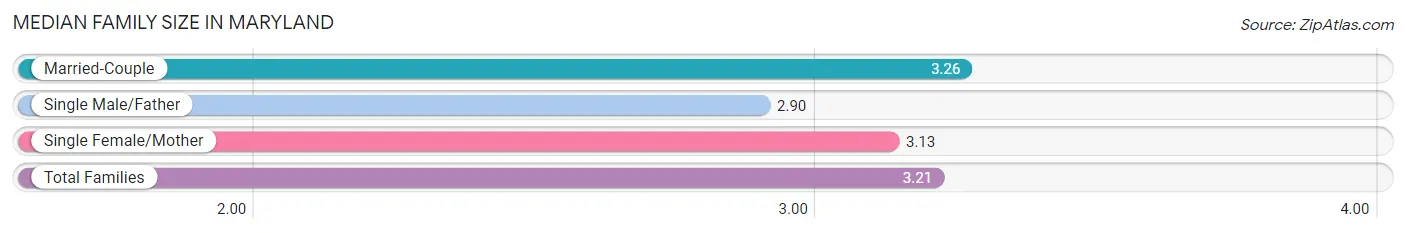
| Family Type | # Families | Family Size |
| Married-Couple | 1,092,896 (71.7%) | 3.26 |
| Single Male/Father | 112,991 (7.4%) | 2.90 |
| Single Female/Mother | 319,179 (20.9%) | 3.13 |
| Total Families | 1,525,066 (100.0%) | 3.21 |
Median Household Size in Maryland
The median household size in Maryland is 2.60 persons per household, with single female/mother households (319,179 | 13.8%) accounting for the largest median household size of 3.33 persons per household. non-family households (793,058 | 34.2%) represent the smallest median household size with 1.26 persons per household.
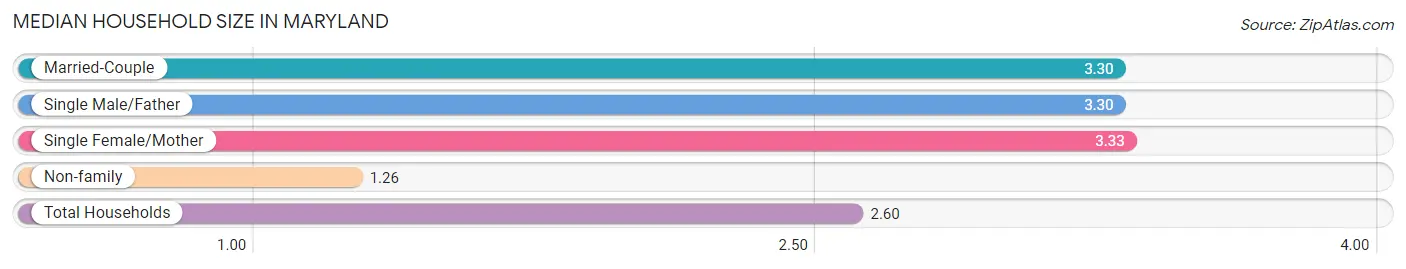
| Household Type | # Households | Household Size |
| Married-Couple | 1,092,896 (47.1%) | 3.30 |
| Single Male/Father | 112,991 (4.9%) | 3.30 |
| Single Female/Mother | 319,179 (13.8%) | 3.33 |
| Non-family | 793,058 (34.2%) | 1.26 |
| Total Households | 2,318,124 (100.0%) | 2.60 |
Household Size by Marriage Status in Maryland
Out of a total of 2,318,124 households in Maryland, 1,525,066 (65.8%) are family households, while 793,058 (34.2%) are nonfamily households. The most numerous type of family households are 2-person households, comprising 626,339, and the most common type of nonfamily households are 1-person households, comprising 647,255.
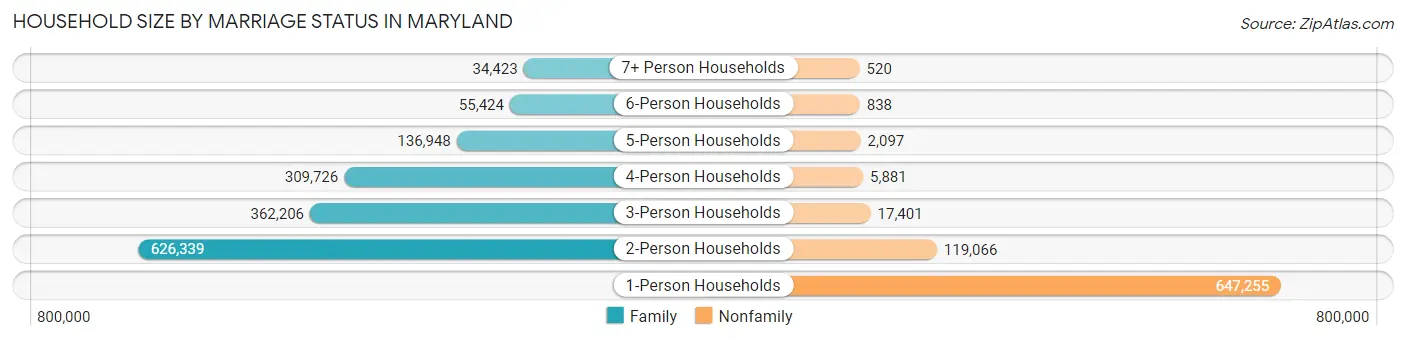
| Household Size | Family Households | Nonfamily Households |
| 1-Person Households | - | 647,255 (27.9%) |
| 2-Person Households | 626,339 (27.0%) | 119,066 (5.1%) |
| 3-Person Households | 362,206 (15.6%) | 17,401 (0.7%) |
| 4-Person Households | 309,726 (13.4%) | 5,881 (0.3%) |
| 5-Person Households | 136,948 (5.9%) | 2,097 (0.1%) |
| 6-Person Households | 55,424 (2.4%) | 838 (0.0%) |
| 7+ Person Households | 34,423 (1.5%) | 520 (0.0%) |
| Total | 1,525,066 (65.8%) | 793,058 (34.2%) |
Female Fertility in Maryland
Fertility by Age in Maryland
Average fertility rate in Maryland is 51.0 births per 1,000 women. Women in the age bracket of 20 to 34 years have the highest fertility rate with 80.0 births per 1,000 women. Women in the age bracket of 20 to 34 years acount for 65.1% of all women with births.
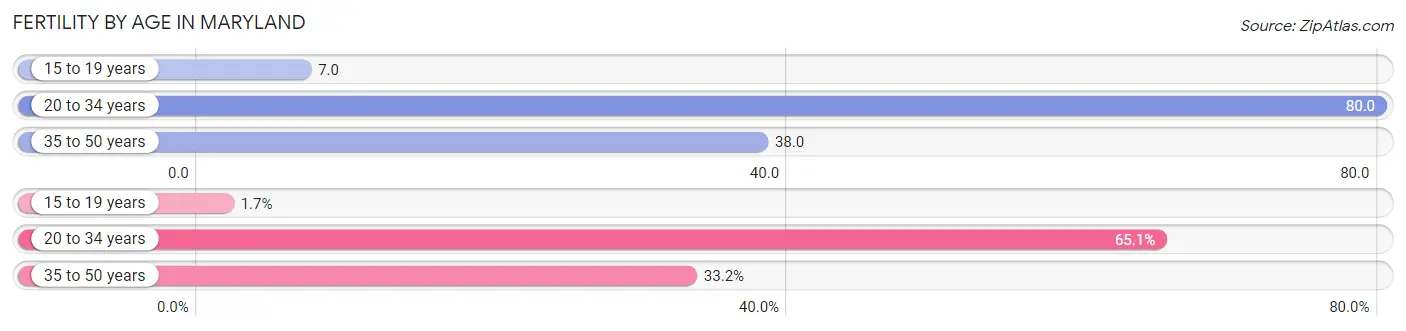
| Age Bracket | Women with Births | Births / 1,000 Women |
| 15 to 19 years | 1,288 (1.7%) | 7.0 |
| 20 to 34 years | 48,222 (65.1%) | 80.0 |
| 35 to 50 years | 24,581 (33.2%) | 38.0 |
| Total | 74,091 (100.0%) | 51.0 |
Fertility by Age by Marriage Status in Maryland
68.1% of women with births (74,091) in Maryland are married. The highest percentage of unmarried women with births falls into 15 to 19 years age bracket with 93.9% of them unmarried at the time of birth, while the lowest percentage of unmarried women with births belong to 35 to 50 years age bracket with 19.5% of them unmarried.
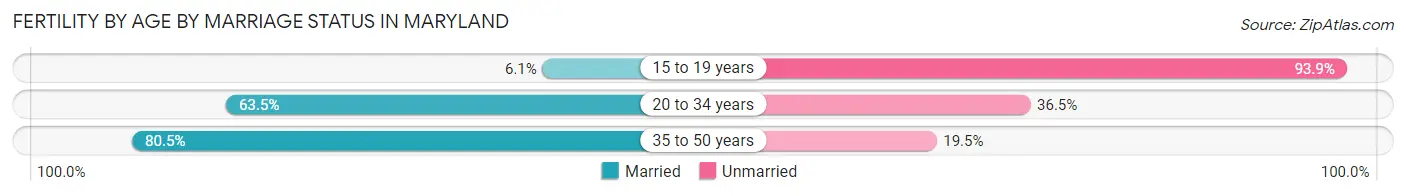
| Age Bracket | Married | Unmarried |
| 15 to 19 years | 79 (6.1%) | 1,209 (93.9%) |
| 20 to 34 years | 30,621 (63.5%) | 17,601 (36.5%) |
| 35 to 50 years | 19,788 (80.5%) | 4,793 (19.5%) |
| Total | 50,456 (68.1%) | 23,635 (31.9%) |
Fertility by Education in Maryland
Average fertility rate in Maryland is 51.0 births per 1,000 women. Women with the education attainment of graduate degree have the highest fertility rate of 69.0 births per 1,000 women, while women with the education attainment of less than high school have the lowest fertility at 32.0 births per 1,000 women. Women with the education attainment of graduate degree represent 23.9% of all women with births.
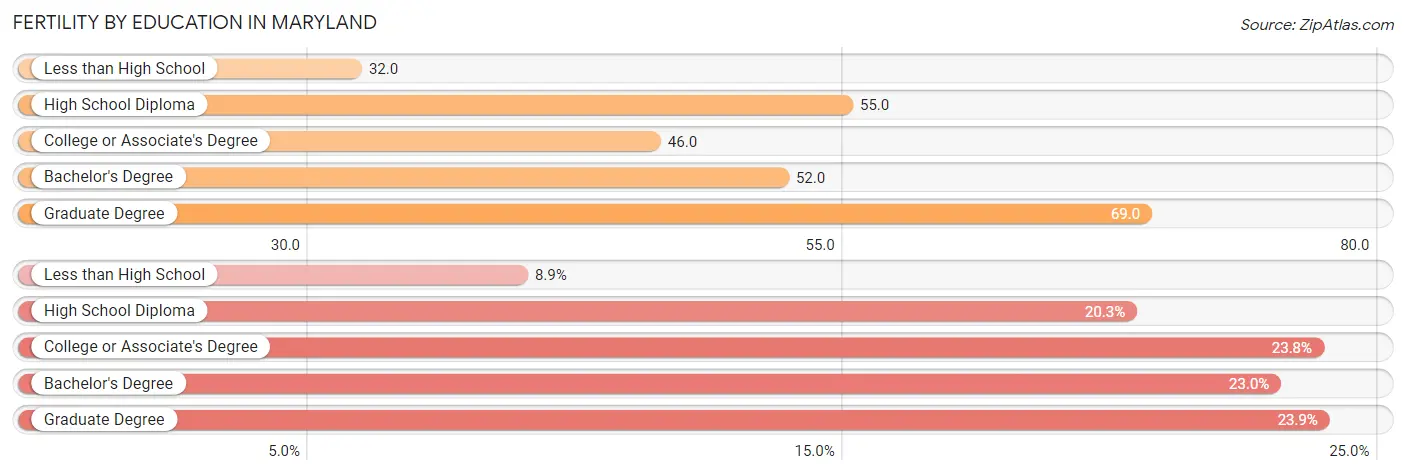
| Educational Attainment | Women with Births | Births / 1,000 Women |
| Less than High School | 6,600 (8.9%) | 32.0 |
| High School Diploma | 15,052 (20.3%) | 55.0 |
| College or Associate's Degree | 17,651 (23.8%) | 46.0 |
| Bachelor's Degree | 17,059 (23.0%) | 52.0 |
| Graduate Degree | 17,729 (23.9%) | 69.0 |
| Total | 74,091 (100.0%) | 51.0 |
Fertility by Education by Marriage Status in Maryland
31.9% of women with births in Maryland are unmarried. Women with the educational attainment of graduate degree are most likely to be married with 90.3% of them married at childbirth, while women with the educational attainment of less than high school are least likely to be married with 56.4% of them unmarried at childbirth.
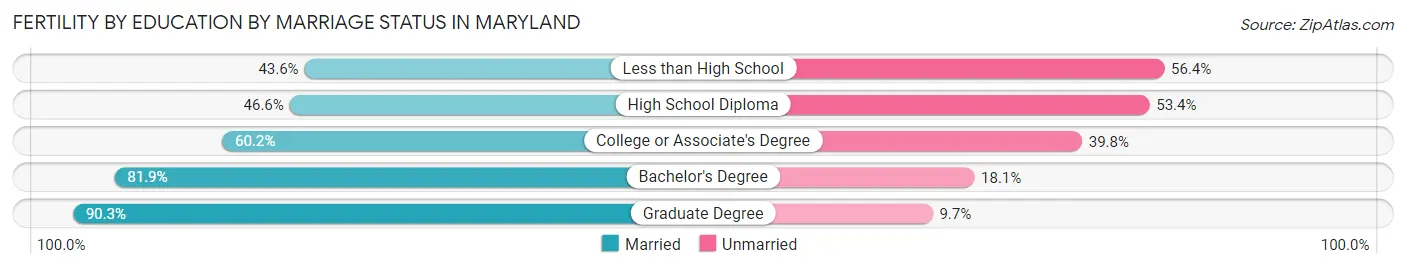
| Educational Attainment | Married | Unmarried |
| Less than High School | 2,878 (43.6%) | 3,722 (56.4%) |
| High School Diploma | 7,014 (46.6%) | 8,038 (53.4%) |
| College or Associate's Degree | 10,626 (60.2%) | 7,025 (39.8%) |
| Bachelor's Degree | 13,971 (81.9%) | 3,088 (18.1%) |
| Graduate Degree | 16,009 (90.3%) | 1,720 (9.7%) |
| Total | 50,456 (68.1%) | 23,635 (31.9%) |
Employment Characteristics in Maryland
Employment by Class of Employer in Maryland
Among the 3,101,081 employed individuals in Maryland, private company employees (1,806,333 | 58.3%), federal government employees (349,498 | 11.3%), and not-for-profit organizations (314,742 | 10.2%) make up the most common classes of employment.
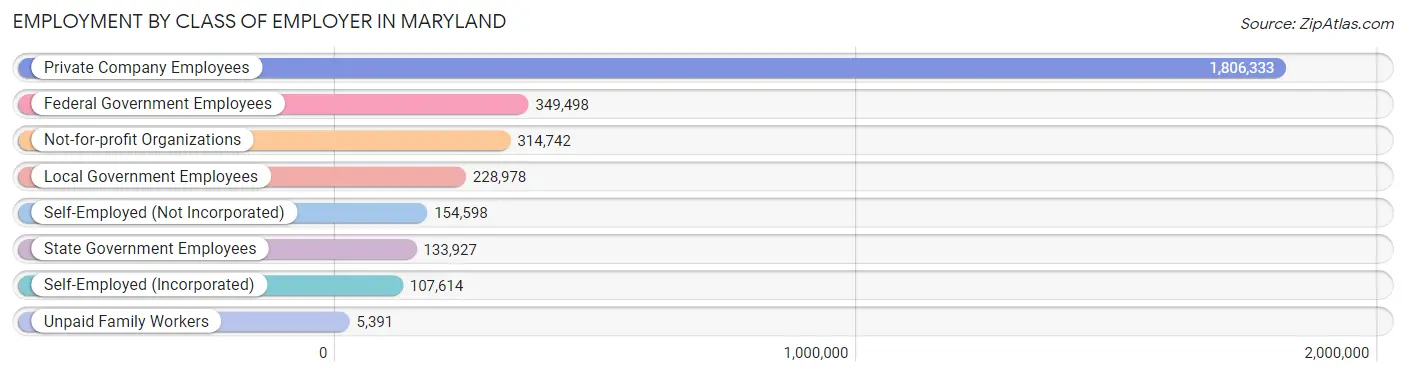
| Employer Class | # Employees | % Employees |
| Private Company Employees | 1,806,333 | 58.3% |
| Self-Employed (Incorporated) | 107,614 | 3.5% |
| Self-Employed (Not Incorporated) | 154,598 | 5.0% |
| Not-for-profit Organizations | 314,742 | 10.2% |
| Local Government Employees | 228,978 | 7.4% |
| State Government Employees | 133,927 | 4.3% |
| Federal Government Employees | 349,498 | 11.3% |
| Unpaid Family Workers | 5,391 | 0.2% |
| Total | 3,101,081 | 100.0% |
Employment Status by Age in Maryland
According to the labor force statistics for Maryland, out of the total population over 16 years of age (4,957,297), 67.2% or 3,331,304 individuals are in the labor force, with 5.1% or 169,897 of them unemployed. The age group with the highest labor force participation rate is 35 to 44 years, with 86.7% or 706,096 individuals in the labor force. Within the labor force, the 16 to 19 years age range has the highest percentage of unemployed individuals, with 16.3% or 19,121 of them being unemployed.
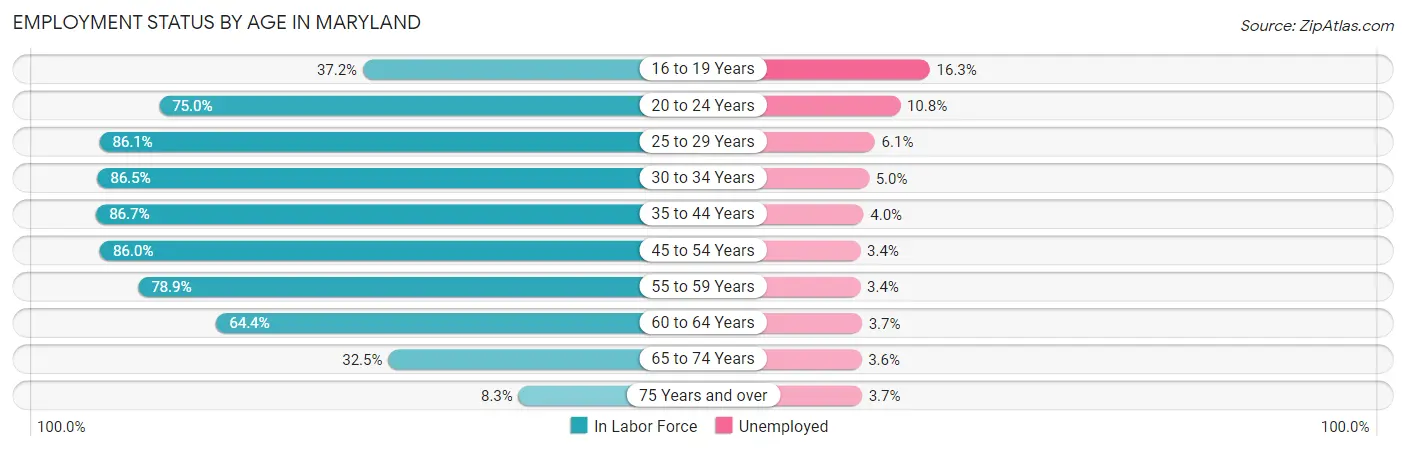
| Age Bracket | In Labor Force | Unemployed |
| 16 to 19 Years | 117,307 (37.2%) | 19,121 (16.3%) |
| 20 to 24 Years | 286,395 (75.0%) | 30,931 (10.8%) |
| 25 to 29 Years | 344,389 (86.1%) | 21,008 (6.1%) |
| 30 to 34 Years | 366,389 (86.5%) | 18,319 (5.0%) |
| 35 to 44 Years | 706,096 (86.7%) | 28,244 (4.0%) |
| 45 to 54 Years | 690,019 (86.0%) | 23,461 (3.4%) |
| 55 to 59 Years | 335,878 (78.9%) | 11,420 (3.4%) |
| 60 to 64 Years | 262,701 (64.4%) | 9,720 (3.7%) |
| 65 to 74 Years | 189,247 (32.5%) | 6,813 (3.6%) |
| 75 Years and over | 33,520 (8.3%) | 1,240 (3.7%) |
| Total | 3,331,304 (67.2%) | 169,897 (5.1%) |
Employment Status by Educational Attainment in Maryland
According to labor force statistics for Maryland, 82.6% of individuals (2,704,275) out of the total population between 25 and 64 years of age (3,273,941) are in the labor force, with 4.2% or 113,580 of them being unemployed. The group with the highest labor force participation rate are those with the educational attainment of bachelor's degree or higher, with 89.6% or 1,283,762 individuals in the labor force. Within the labor force, individuals with less than high school education have the highest percentage of unemployment, with 7.4% or 12,992 of them being unemployed.
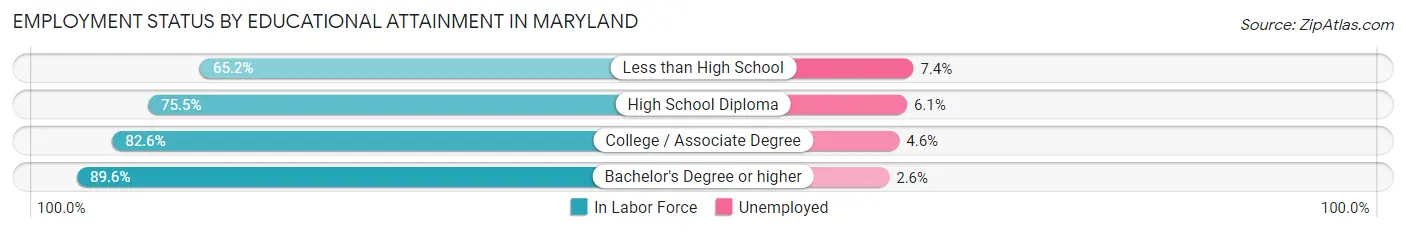
| Educational Attainment | In Labor Force | Unemployed |
| Less than High School | 175,571 (65.2%) | 19,927 (7.4%) |
| High School Diploma | 560,826 (75.5%) | 45,312 (6.1%) |
| College / Associate Degree | 684,816 (82.6%) | 38,137 (4.6%) |
| Bachelor's Degree or higher | 1,283,762 (89.6%) | 37,252 (2.6%) |
| Total | 2,704,275 (82.6%) | 137,506 (4.2%) |
Employment Occupations by Sex in Maryland
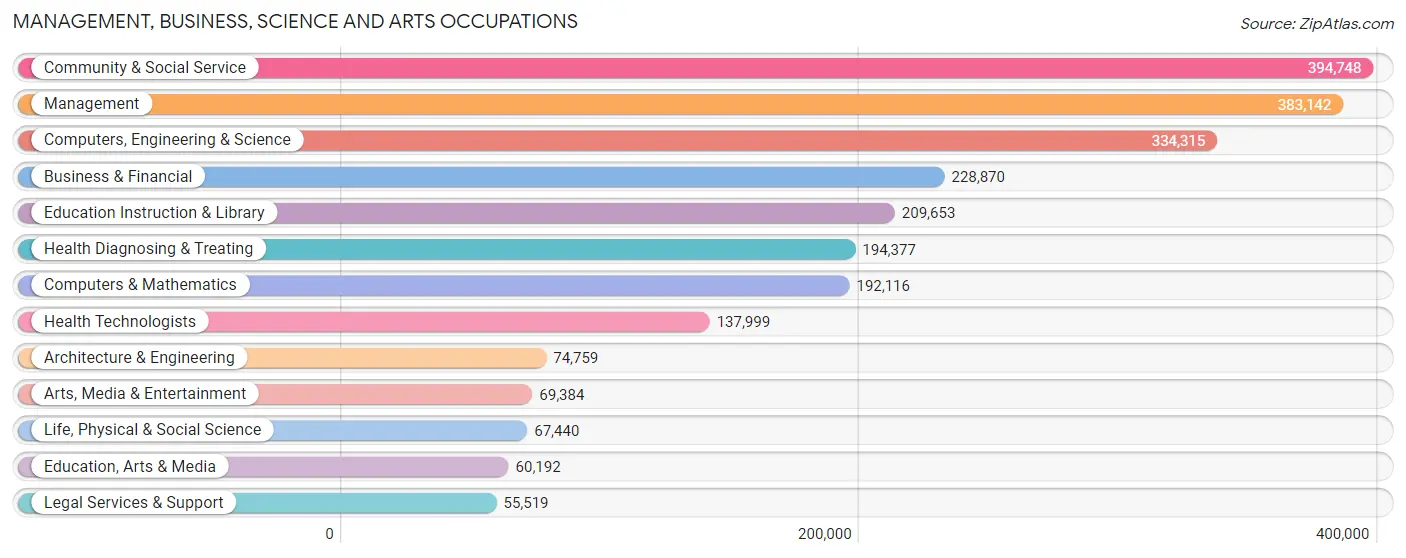
Management, Business, Science and Arts Occupations
The most common Management, Business, Science and Arts occupations in Maryland are Community & Social Service (394,748 | 12.6%), Management (383,142 | 12.2%), Computers, Engineering & Science (334,315 | 10.7%), Business & Financial (228,870 | 7.3%), and Education Instruction & Library (209,653 | 6.7%).
Management, Business, Science and Arts Occupations by Sex
Within the Management, Business, Science and Arts occupations in Maryland, the most male-oriented occupations are Architecture & Engineering (82.4%), Computers & Mathematics (69.7%), and Computers, Engineering & Science (69.1%), while the most female-oriented occupations are Health Diagnosing & Treating (75.7%), Health Technologists (75.4%), and Education Instruction & Library (73.7%).
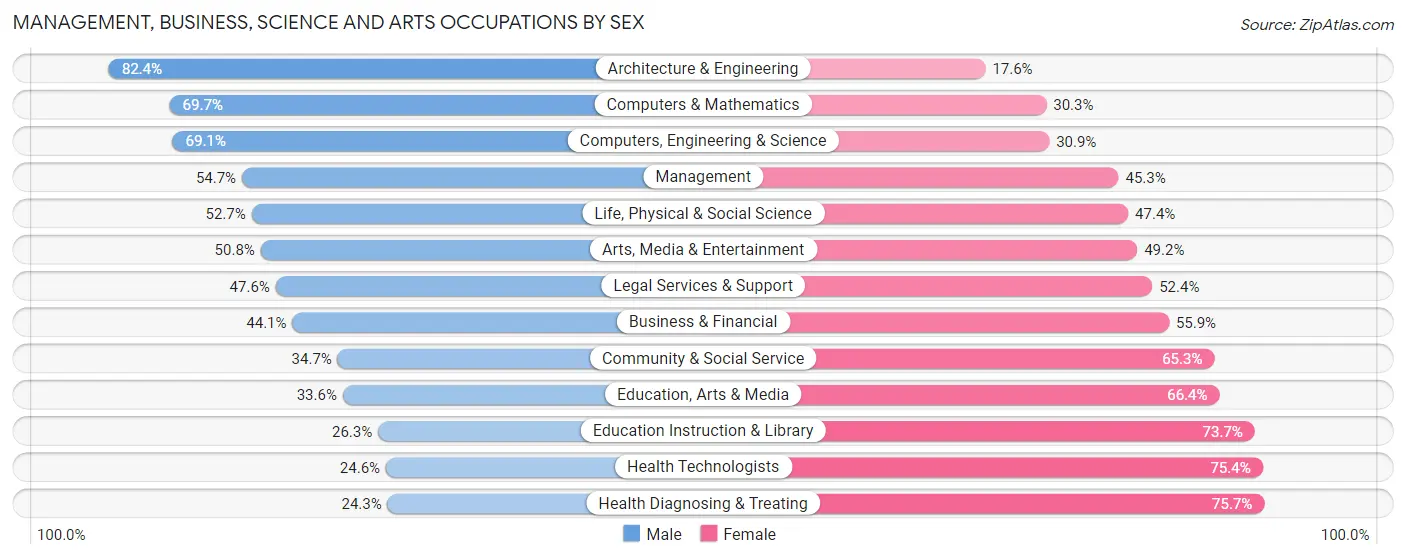
| Occupation | Male | Female |
| Management | 209,439 (54.7%) | 173,703 (45.3%) |
| Business & Financial | 101,013 (44.1%) | 127,857 (55.9%) |
| Computers, Engineering & Science | 231,094 (69.1%) | 103,221 (30.9%) |
| Computers & Mathematics | 133,968 (69.7%) | 58,148 (30.3%) |
| Architecture & Engineering | 61,620 (82.4%) | 13,139 (17.6%) |
| Life, Physical & Social Science | 35,506 (52.6%) | 31,934 (47.3%) |
| Community & Social Service | 136,995 (34.7%) | 257,753 (65.3%) |
| Education, Arts & Media | 20,249 (33.6%) | 39,943 (66.4%) |
| Legal Services & Support | 26,441 (47.6%) | 29,078 (52.4%) |
| Education Instruction & Library | 55,086 (26.3%) | 154,567 (73.7%) |
| Arts, Media & Entertainment | 35,219 (50.8%) | 34,165 (49.2%) |
| Health Diagnosing & Treating | 47,219 (24.3%) | 147,158 (75.7%) |
| Health Technologists | 33,990 (24.6%) | 104,009 (75.4%) |
| Total (Category) | 725,760 (47.3%) | 809,692 (52.7%) |
| Total (Overall) | 1,602,531 (51.2%) | 1,528,882 (48.8%) |
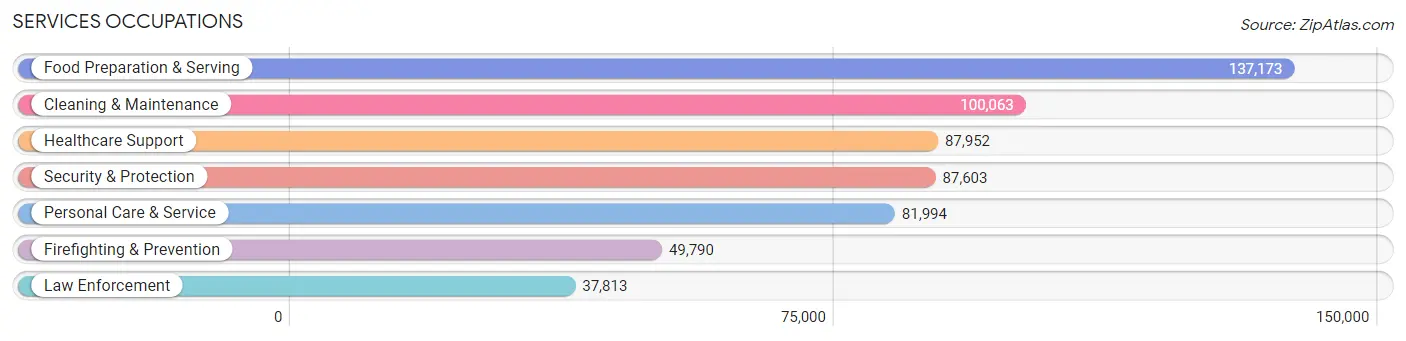
Services Occupations
The most common Services occupations in Maryland are Food Preparation & Serving (137,173 | 4.4%), Cleaning & Maintenance (100,063 | 3.2%), Healthcare Support (87,952 | 2.8%), Security & Protection (87,603 | 2.8%), and Personal Care & Service (81,994 | 2.6%).
Services Occupations by Sex
Within the Services occupations in Maryland, the most male-oriented occupations are Law Enforcement (76.6%), Security & Protection (72.7%), and Firefighting & Prevention (69.8%), while the most female-oriented occupations are Healthcare Support (84.0%), Personal Care & Service (75.0%), and Food Preparation & Serving (54.5%).
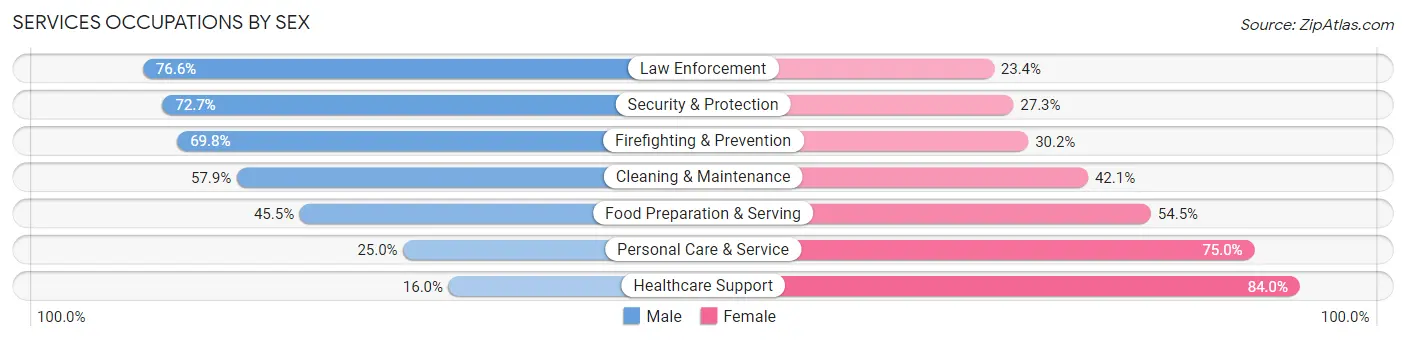
| Occupation | Male | Female |
| Healthcare Support | 14,066 (16.0%) | 73,886 (84.0%) |
| Security & Protection | 63,693 (72.7%) | 23,910 (27.3%) |
| Firefighting & Prevention | 34,740 (69.8%) | 15,050 (30.2%) |
| Law Enforcement | 28,953 (76.6%) | 8,860 (23.4%) |
| Food Preparation & Serving | 62,367 (45.5%) | 74,806 (54.5%) |
| Cleaning & Maintenance | 57,968 (57.9%) | 42,095 (42.1%) |
| Personal Care & Service | 20,481 (25.0%) | 61,513 (75.0%) |
| Total (Category) | 218,575 (44.2%) | 276,210 (55.8%) |
| Total (Overall) | 1,602,531 (51.2%) | 1,528,882 (48.8%) |
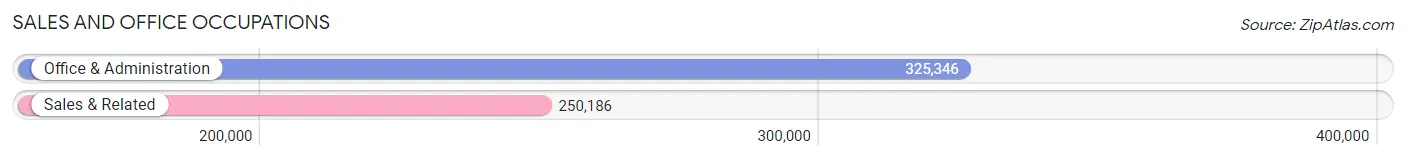
Sales and Office Occupations
The most common Sales and Office occupations in Maryland are Office & Administration (325,346 | 10.4%), and Sales & Related (250,186 | 8.0%).
Sales and Office Occupations by Sex
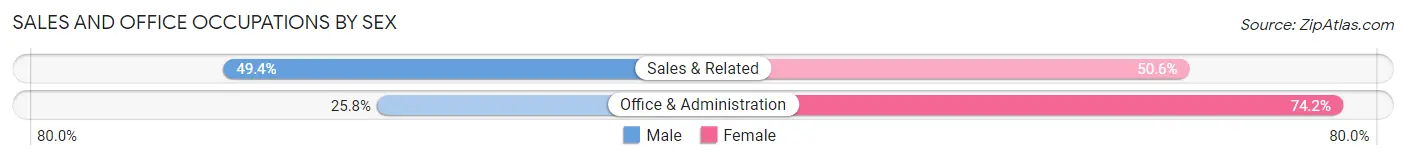
| Occupation | Male | Female |
| Sales & Related | 123,631 (49.4%) | 126,555 (50.6%) |
| Office & Administration | 83,979 (25.8%) | 241,367 (74.2%) |
| Total (Category) | 207,610 (36.1%) | 367,922 (63.9%) |
| Total (Overall) | 1,602,531 (51.2%) | 1,528,882 (48.8%) |
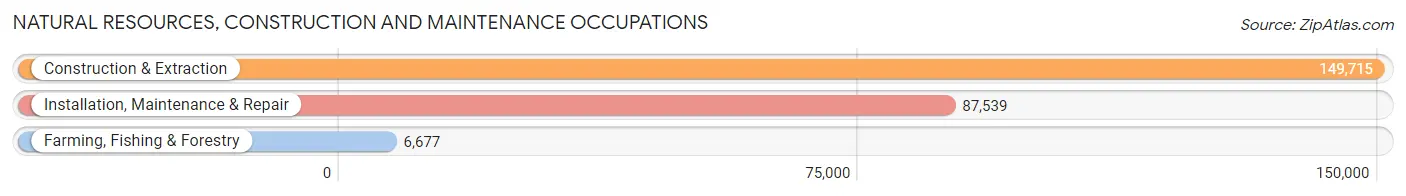
Natural Resources, Construction and Maintenance Occupations
The most common Natural Resources, Construction and Maintenance occupations in Maryland are Construction & Extraction (149,715 | 4.8%), Installation, Maintenance & Repair (87,539 | 2.8%), and Farming, Fishing & Forestry (6,677 | 0.2%).
Natural Resources, Construction and Maintenance Occupations by Sex
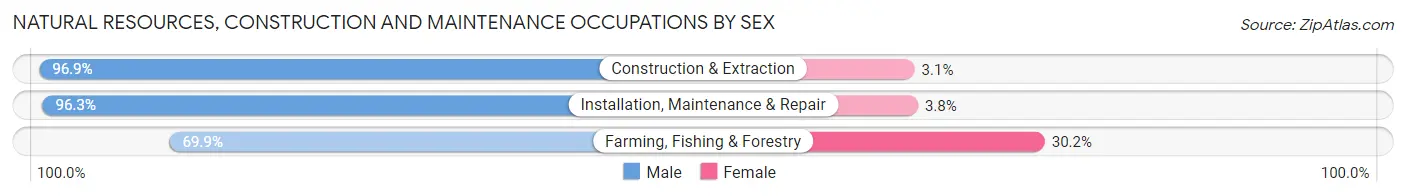
| Occupation | Male | Female |
| Farming, Fishing & Forestry | 4,664 (69.9%) | 2,013 (30.1%) |
| Construction & Extraction | 145,115 (96.9%) | 4,600 (3.1%) |
| Installation, Maintenance & Repair | 84,254 (96.3%) | 3,285 (3.7%) |
| Total (Category) | 234,033 (95.9%) | 9,898 (4.1%) |
| Total (Overall) | 1,602,531 (51.2%) | 1,528,882 (48.8%) |
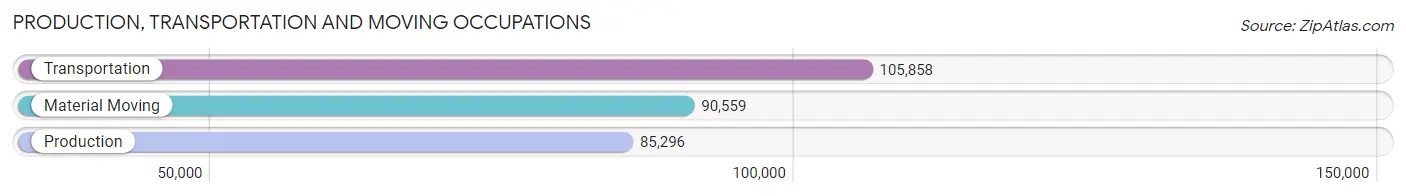
Production, Transportation and Moving Occupations
The most common Production, Transportation and Moving occupations in Maryland are Transportation (105,858 | 3.4%), Material Moving (90,559 | 2.9%), and Production (85,296 | 2.7%).
Production, Transportation and Moving Occupations by Sex
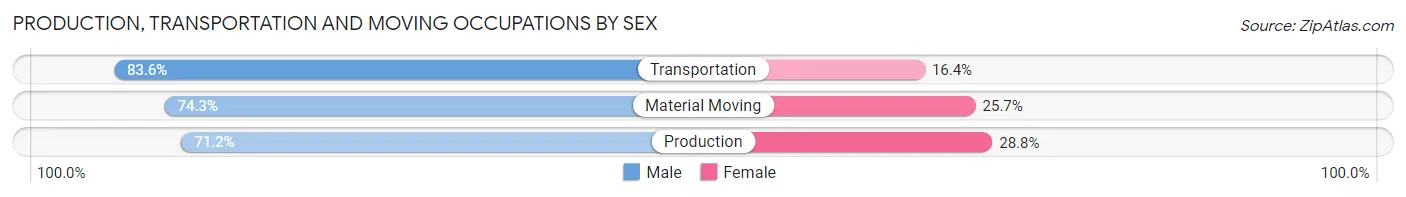
| Occupation | Male | Female |
| Production | 60,766 (71.2%) | 24,530 (28.8%) |
| Transportation | 88,501 (83.6%) | 17,357 (16.4%) |
| Material Moving | 67,286 (74.3%) | 23,273 (25.7%) |
| Total (Category) | 216,553 (76.9%) | 65,160 (23.1%) |
| Total (Overall) | 1,602,531 (51.2%) | 1,528,882 (48.8%) |
Employment Industries by Sex in Maryland
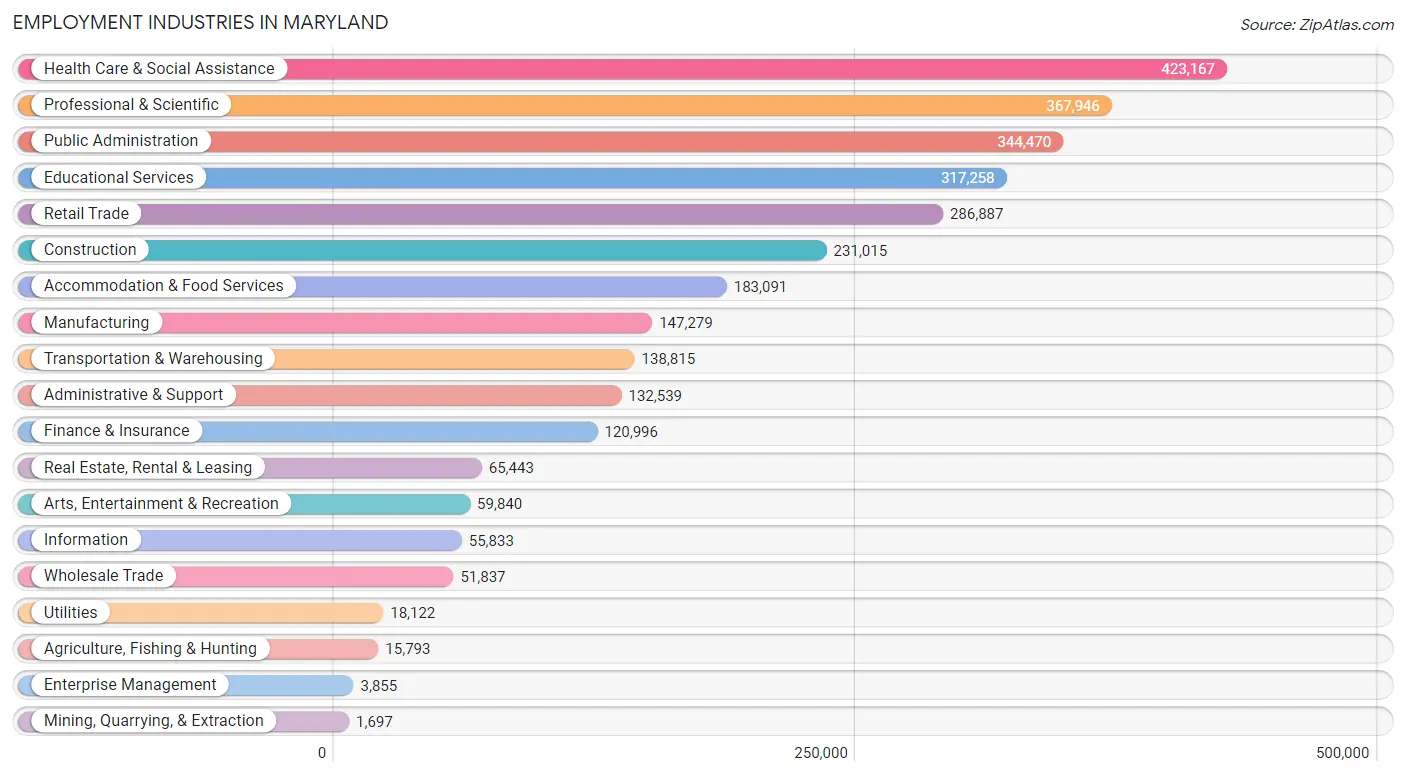
Employment Industries in Maryland
The major employment industries in Maryland include Health Care & Social Assistance (423,167 | 13.5%), Professional & Scientific (367,946 | 11.7%), Public Administration (344,470 | 11.0%), Educational Services (317,258 | 10.1%), and Retail Trade (286,887 | 9.2%).
Employment Industries by Sex in Maryland
The Maryland industries that see more men than women are Mining, Quarrying, & Extraction (89.7%), Construction (87.9%), and Utilities (75.6%), whereas the industries that tend to have a higher number of women are Health Care & Social Assistance (77.5%), Educational Services (67.9%), and Finance & Insurance (55.6%).
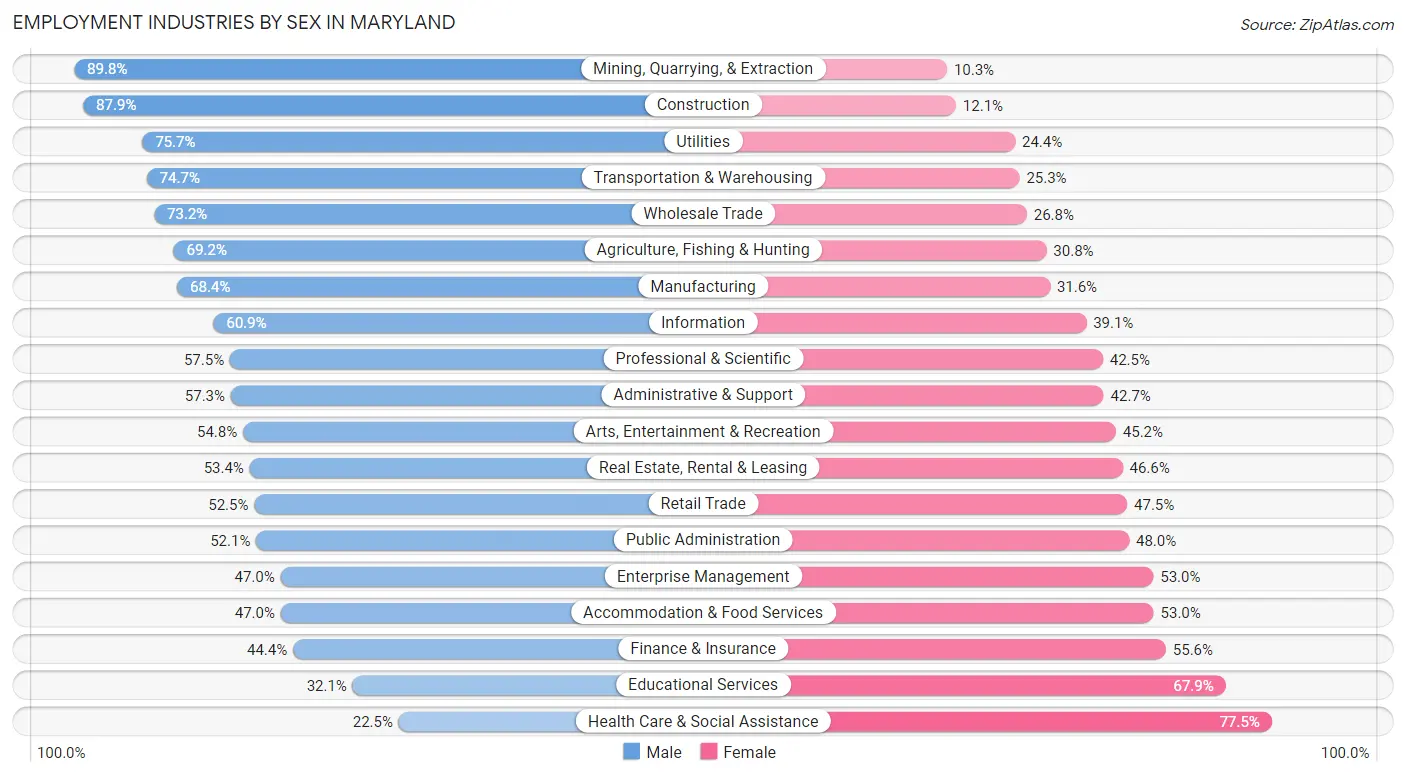
| Industry | Male | Female |
| Agriculture, Fishing & Hunting | 10,922 (69.2%) | 4,871 (30.8%) |
| Mining, Quarrying, & Extraction | 1,523 (89.7%) | 174 (10.2%) |
| Construction | 203,073 (87.9%) | 27,942 (12.1%) |
| Manufacturing | 100,782 (68.4%) | 46,497 (31.6%) |
| Wholesale Trade | 37,954 (73.2%) | 13,883 (26.8%) |
| Retail Trade | 150,495 (52.5%) | 136,392 (47.5%) |
| Transportation & Warehousing | 103,753 (74.7%) | 35,062 (25.3%) |
| Utilities | 13,710 (75.6%) | 4,412 (24.3%) |
| Information | 34,020 (60.9%) | 21,813 (39.1%) |
| Finance & Insurance | 53,775 (44.4%) | 67,221 (55.6%) |
| Real Estate, Rental & Leasing | 34,950 (53.4%) | 30,493 (46.6%) |
| Professional & Scientific | 211,539 (57.5%) | 156,407 (42.5%) |
| Enterprise Management | 1,813 (47.0%) | 2,042 (53.0%) |
| Administrative & Support | 75,962 (57.3%) | 56,577 (42.7%) |
| Educational Services | 101,802 (32.1%) | 215,456 (67.9%) |
| Health Care & Social Assistance | 95,361 (22.5%) | 327,806 (77.5%) |
| Arts, Entertainment & Recreation | 32,787 (54.8%) | 27,053 (45.2%) |
| Accommodation & Food Services | 86,002 (47.0%) | 97,089 (53.0%) |
| Public Administration | 179,282 (52.0%) | 165,188 (47.9%) |
| Total | 1,602,531 (51.2%) | 1,528,882 (48.8%) |
Education in Maryland
School Enrollment in Maryland
The most common levels of schooling among the 1,535,684 students in Maryland are college / undergraduate (328,928 | 21.4%), high school (320,549 | 20.9%), and middle school (311,988 | 20.3%).
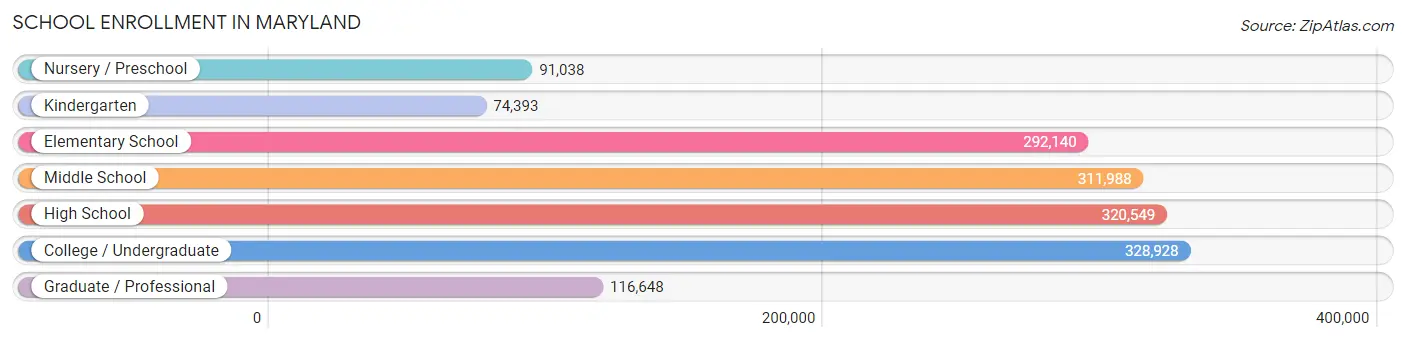
| School Level | # Students | % Students |
| Nursery / Preschool | 91,038 | 5.9% |
| Kindergarten | 74,393 | 4.8% |
| Elementary School | 292,140 | 19.0% |
| Middle School | 311,988 | 20.3% |
| High School | 320,549 | 20.9% |
| College / Undergraduate | 328,928 | 21.4% |
| Graduate / Professional | 116,648 | 7.6% |
| Total | 1,535,684 | 100.0% |
School Enrollment by Age by Funding Source in Maryland
Out of a total of 1,535,684 students who are enrolled in schools in Maryland, 308,672 (20.1%) attend a private institution, while the remaining 1,227,012 (79.9%) are enrolled in public schools. The age group of 3 to 4 year olds has the highest likelihood of being enrolled in private schools, with 35,470 (50.7% in the age bracket) enrolled. Conversely, the age group of 15 to 17 year olds has the lowest likelihood of being enrolled in a private school, with 194,573 (85.2% in the age bracket) attending a public institution.
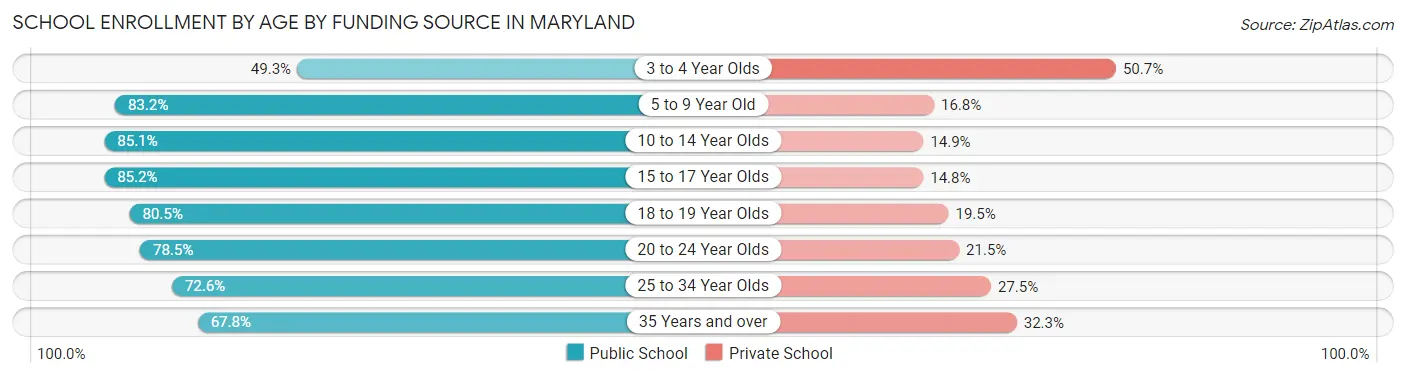
| Age Bracket | Public School | Private School |
| 3 to 4 Year Olds | 34,463 (49.3%) | 35,470 (50.7%) |
| 5 to 9 Year Old | 292,785 (83.2%) | 59,305 (16.8%) |
| 10 to 14 Year Olds | 326,369 (85.1%) | 56,947 (14.9%) |
| 15 to 17 Year Olds | 194,573 (85.2%) | 33,885 (14.8%) |
| 18 to 19 Year Olds | 100,413 (80.5%) | 24,382 (19.5%) |
| 20 to 24 Year Olds | 126,310 (78.5%) | 34,607 (21.5%) |
| 25 to 34 Year Olds | 79,701 (72.6%) | 30,155 (27.5%) |
| 35 Years and over | 72,026 (67.7%) | 34,293 (32.3%) |
| Total | 1,227,012 (79.9%) | 308,672 (20.1%) |
Educational Attainment by Field of Study in Maryland
Business (337,234 | 17.3%), social sciences (207,773 | 10.7%), science & technology (171,629 | 8.8%), education (169,678 | 8.7%), and engineering (149,326 | 7.7%) are the most common fields of study among 1,948,579 individuals in Maryland who have obtained a bachelor's degree or higher.
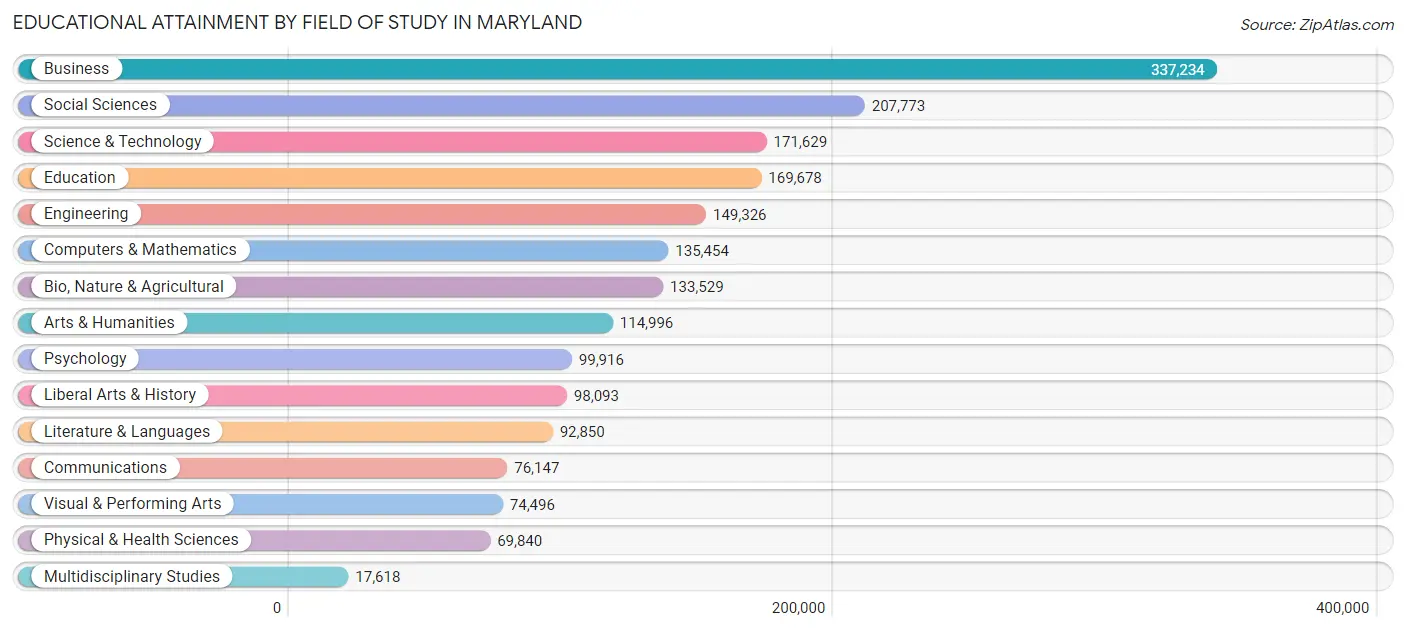
| Field of Study | # Graduates | % Graduates |
| Computers & Mathematics | 135,454 | 7.0% |
| Bio, Nature & Agricultural | 133,529 | 6.9% |
| Physical & Health Sciences | 69,840 | 3.6% |
| Psychology | 99,916 | 5.1% |
| Social Sciences | 207,773 | 10.7% |
| Engineering | 149,326 | 7.7% |
| Multidisciplinary Studies | 17,618 | 0.9% |
| Science & Technology | 171,629 | 8.8% |
| Business | 337,234 | 17.3% |
| Education | 169,678 | 8.7% |
| Literature & Languages | 92,850 | 4.8% |
| Liberal Arts & History | 98,093 | 5.0% |
| Visual & Performing Arts | 74,496 | 3.8% |
| Communications | 76,147 | 3.9% |
| Arts & Humanities | 114,996 | 5.9% |
| Total | 1,948,579 | 100.0% |
Transportation & Commute in Maryland
Vehicle Availability by Sex in Maryland
The most prevalent vehicle ownership categories in Maryland are males with 2 vehicles (653,756, accounting for 41.1%) and females with 2 vehicles (576,488, making up 43.9%).
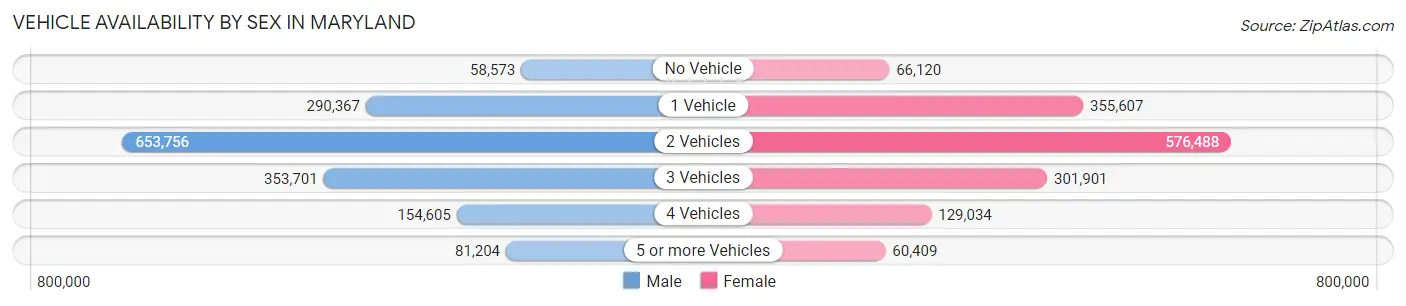
| Vehicles Available | Male | Female |
| No Vehicle | 58,573 (3.7%) | 66,120 (4.4%) |
| 1 Vehicle | 290,367 (18.2%) | 355,607 (23.9%) |
| 2 Vehicles | 653,756 (41.1%) | 576,488 (38.7%) |
| 3 Vehicles | 353,701 (22.2%) | 301,901 (20.3%) |
| 4 Vehicles | 154,605 (9.7%) | 129,034 (8.7%) |
| 5 or more Vehicles | 81,204 (5.1%) | 60,409 (4.1%) |
| Total | 1,592,206 (100.0%) | 1,489,559 (100.0%) |
Commute Time in Maryland
The most frequently occuring commute durations in Maryland are 30 to 34 minutes (400,919 commuters, 15.1%), 20 to 24 minutes (342,189 commuters, 12.9%), and 15 to 19 minutes (333,717 commuters, 12.6%).
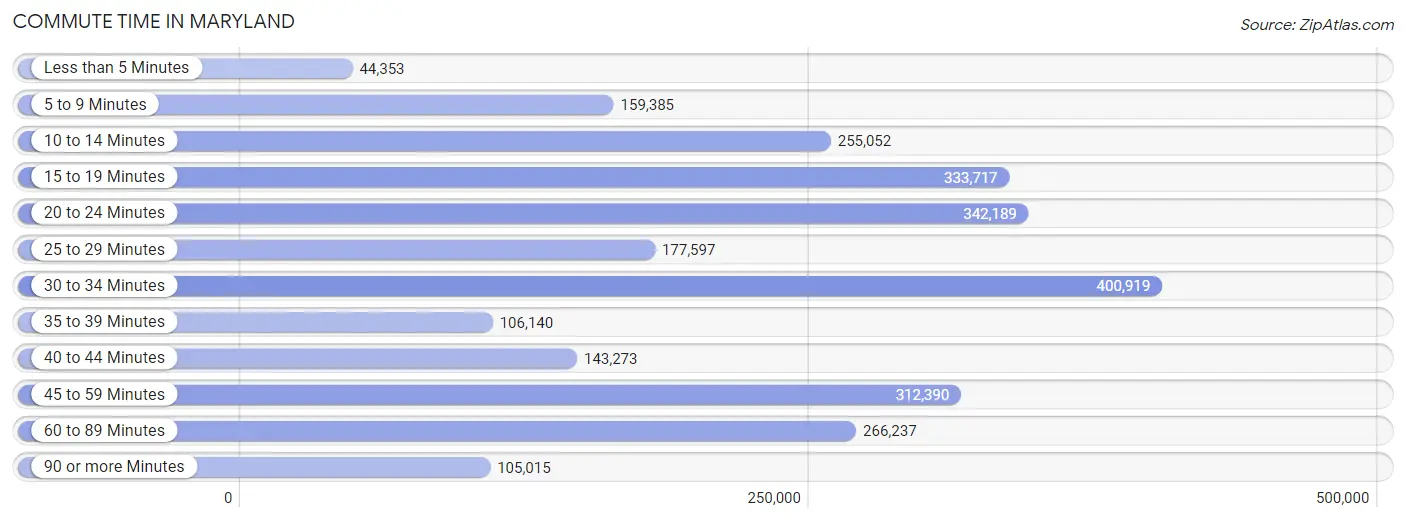
| Commute Time | # Commuters | % Commuters |
| Less than 5 Minutes | 44,353 | 1.7% |
| 5 to 9 Minutes | 159,385 | 6.0% |
| 10 to 14 Minutes | 255,052 | 9.6% |
| 15 to 19 Minutes | 333,717 | 12.6% |
| 20 to 24 Minutes | 342,189 | 12.9% |
| 25 to 29 Minutes | 177,597 | 6.7% |
| 30 to 34 Minutes | 400,919 | 15.1% |
| 35 to 39 Minutes | 106,140 | 4.0% |
| 40 to 44 Minutes | 143,273 | 5.4% |
| 45 to 59 Minutes | 312,390 | 11.8% |
| 60 to 89 Minutes | 266,237 | 10.1% |
| 90 or more Minutes | 105,015 | 4.0% |
Commute Time by Sex in Maryland
The most common commute times in Maryland are 30 to 34 minutes (215,287 commuters, 15.5%) for males and 30 to 34 minutes (185,632 commuters, 14.8%) for females.
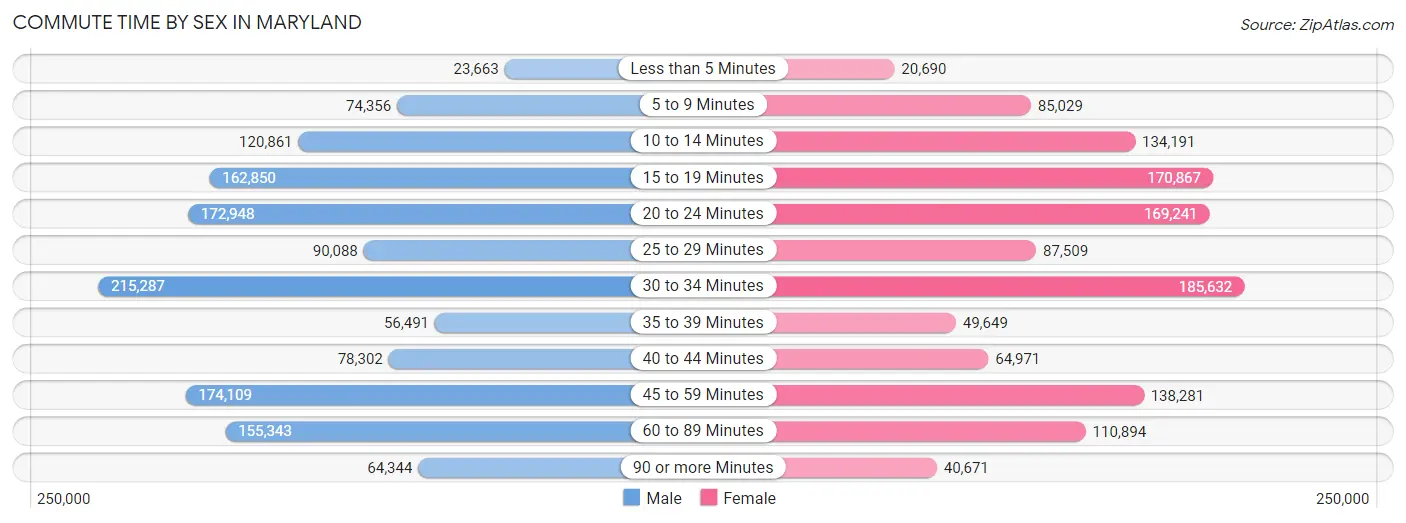
| Commute Time | Male | Female |
| Less than 5 Minutes | 23,663 (1.7%) | 20,690 (1.7%) |
| 5 to 9 Minutes | 74,356 (5.3%) | 85,029 (6.8%) |
| 10 to 14 Minutes | 120,861 (8.7%) | 134,191 (10.7%) |
| 15 to 19 Minutes | 162,850 (11.7%) | 170,867 (13.6%) |
| 20 to 24 Minutes | 172,948 (12.4%) | 169,241 (13.5%) |
| 25 to 29 Minutes | 90,088 (6.5%) | 87,509 (7.0%) |
| 30 to 34 Minutes | 215,287 (15.5%) | 185,632 (14.8%) |
| 35 to 39 Minutes | 56,491 (4.1%) | 49,649 (4.0%) |
| 40 to 44 Minutes | 78,302 (5.6%) | 64,971 (5.2%) |
| 45 to 59 Minutes | 174,109 (12.5%) | 138,281 (11.0%) |
| 60 to 89 Minutes | 155,343 (11.2%) | 110,894 (8.8%) |
| 90 or more Minutes | 64,344 (4.6%) | 40,671 (3.2%) |
Time of Departure to Work by Sex in Maryland
The most frequent times of departure to work in Maryland are 7:00 AM to 7:29 AM (179,423, 12.9%) for males and 7:00 AM to 7:29 AM (187,720, 14.9%) for females.
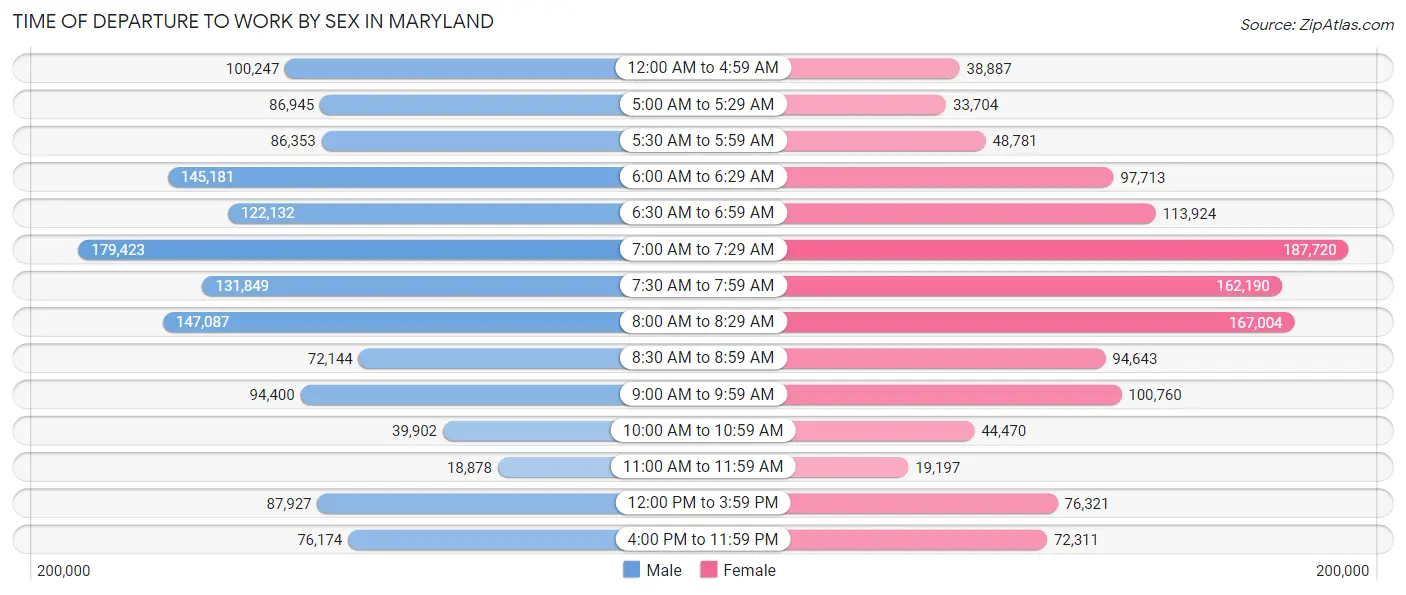
| Time of Departure | Male | Female |
| 12:00 AM to 4:59 AM | 100,247 (7.2%) | 38,887 (3.1%) |
| 5:00 AM to 5:29 AM | 86,945 (6.3%) | 33,704 (2.7%) |
| 5:30 AM to 5:59 AM | 86,353 (6.2%) | 48,781 (3.9%) |
| 6:00 AM to 6:29 AM | 145,181 (10.4%) | 97,713 (7.8%) |
| 6:30 AM to 6:59 AM | 122,132 (8.8%) | 113,924 (9.1%) |
| 7:00 AM to 7:29 AM | 179,423 (12.9%) | 187,720 (14.9%) |
| 7:30 AM to 7:59 AM | 131,849 (9.5%) | 162,190 (12.9%) |
| 8:00 AM to 8:29 AM | 147,087 (10.6%) | 167,004 (13.3%) |
| 8:30 AM to 8:59 AM | 72,144 (5.2%) | 94,643 (7.5%) |
| 9:00 AM to 9:59 AM | 94,400 (6.8%) | 100,760 (8.0%) |
| 10:00 AM to 10:59 AM | 39,902 (2.9%) | 44,470 (3.5%) |
| 11:00 AM to 11:59 AM | 18,878 (1.4%) | 19,197 (1.5%) |
| 12:00 PM to 3:59 PM | 87,927 (6.3%) | 76,321 (6.1%) |
| 4:00 PM to 11:59 PM | 76,174 (5.5%) | 72,311 (5.8%) |
| Total | 1,388,642 (100.0%) | 1,257,625 (100.0%) |
Housing Occupancy in Maryland
Occupancy by Ownership in Maryland
Of the total 2,318,124 dwellings in Maryland, owner-occupied units account for 1,564,056 (67.5%), while renter-occupied units make up 754,068 (32.5%).
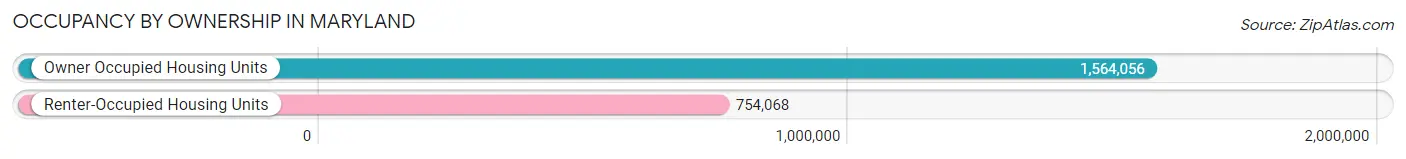
| Occupancy | # Housing Units | % Housing Units |
| Owner Occupied Housing Units | 1,564,056 | 67.5% |
| Renter-Occupied Housing Units | 754,068 | 32.5% |
| Total Occupied Housing Units | 2,318,124 | 100.0% |
Occupancy by Household Size in Maryland
| Household Size | # Housing Units | % Housing Units |
| 1-Person Household | 647,255 | 27.9% |
| 2-Person Household | 745,405 | 32.2% |
| 3-Person Household | 379,607 | 16.4% |
| 4+ Person Household | 545,857 | 23.5% |
| Total Housing Units | 2,318,124 | 100.0% |
Occupancy by Ownership by Household Size in Maryland
| Household Size | Owner-occupied | Renter-occupied |
| 1-Person Household | 349,567 (54.0%) | 297,688 (46.0%) |
| 2-Person Household | 542,011 (72.7%) | 203,394 (27.3%) |
| 3-Person Household | 269,011 (70.9%) | 110,596 (29.1%) |
| 4+ Person Household | 403,467 (73.9%) | 142,390 (26.1%) |
| Total Housing Units | 1,564,056 (67.5%) | 754,068 (32.5%) |
Occupancy by Educational Attainment in Maryland
| Household Size | Owner-occupied | Renter-occupied |
| Less than High School | 81,326 (49.4%) | 83,127 (50.5%) |
| High School Diploma | 286,089 (60.3%) | 188,357 (39.7%) |
| College/Associate Degree | 392,062 (64.1%) | 219,219 (35.9%) |
| Bachelor's Degree or higher | 804,579 (75.3%) | 263,365 (24.7%) |
Occupancy by Age of Householder in Maryland
| Age Bracket | # Households | % Households |
| Under 35 Years | 387,957 | 16.7% |
| 35 to 44 Years | 415,027 | 17.9% |
| 45 to 54 Years | 438,183 | 18.9% |
| 55 to 64 Years | 476,911 | 20.6% |
| 65 to 74 Years | 352,060 | 15.2% |
| 75 to 84 Years | 174,503 | 7.5% |
| 85 Years and Over | 73,483 | 3.2% |
| Total | 2,318,124 | 100.0% |
Housing Finances in Maryland
Median Income by Occupancy in Maryland
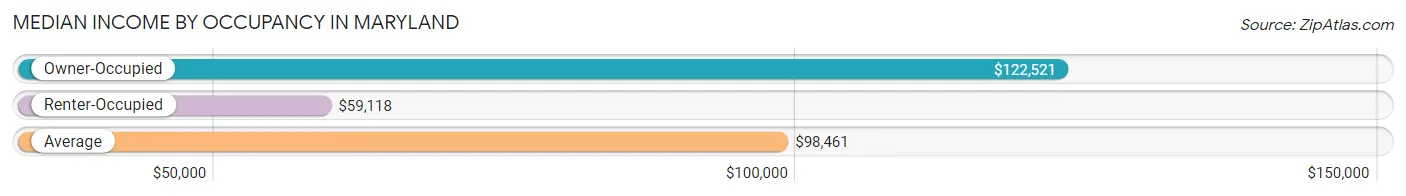
| Occupancy Type | # Households | Median Income |
| Owner-Occupied | 1,564,056 (67.5%) | $122,521 |
| Renter-Occupied | 754,068 (32.5%) | $59,118 |
| Average | 2,318,124 (100.0%) | $98,461 |
Occupancy by Householder Income Bracket in Maryland
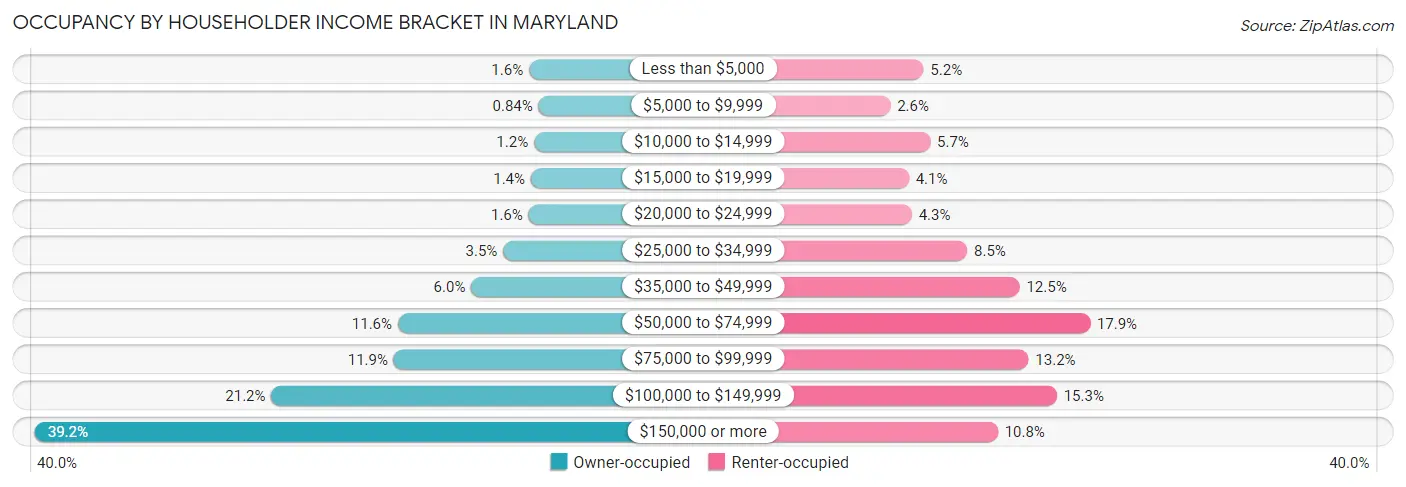
| Income Bracket | Owner-occupied | Renter-occupied |
| Less than $5,000 | 24,546 (1.6%) | 38,989 (5.2%) |
| $5,000 to $9,999 | 13,132 (0.8%) | 19,929 (2.6%) |
| $10,000 to $14,999 | 18,605 (1.2%) | 42,808 (5.7%) |
| $15,000 to $19,999 | 22,415 (1.4%) | 30,511 (4.1%) |
| $20,000 to $24,999 | 25,098 (1.6%) | 32,300 (4.3%) |
| $25,000 to $34,999 | 55,368 (3.5%) | 64,101 (8.5%) |
| $35,000 to $49,999 | 93,377 (6.0%) | 94,220 (12.5%) |
| $50,000 to $74,999 | 180,835 (11.6%) | 134,703 (17.9%) |
| $75,000 to $99,999 | 185,689 (11.9%) | 99,315 (13.2%) |
| $100,000 to $149,999 | 331,544 (21.2%) | 115,563 (15.3%) |
| $150,000 or more | 613,447 (39.2%) | 81,629 (10.8%) |
| Total | 1,564,056 (100.0%) | 754,068 (100.0%) |
Monthly Housing Cost Tiers in Maryland
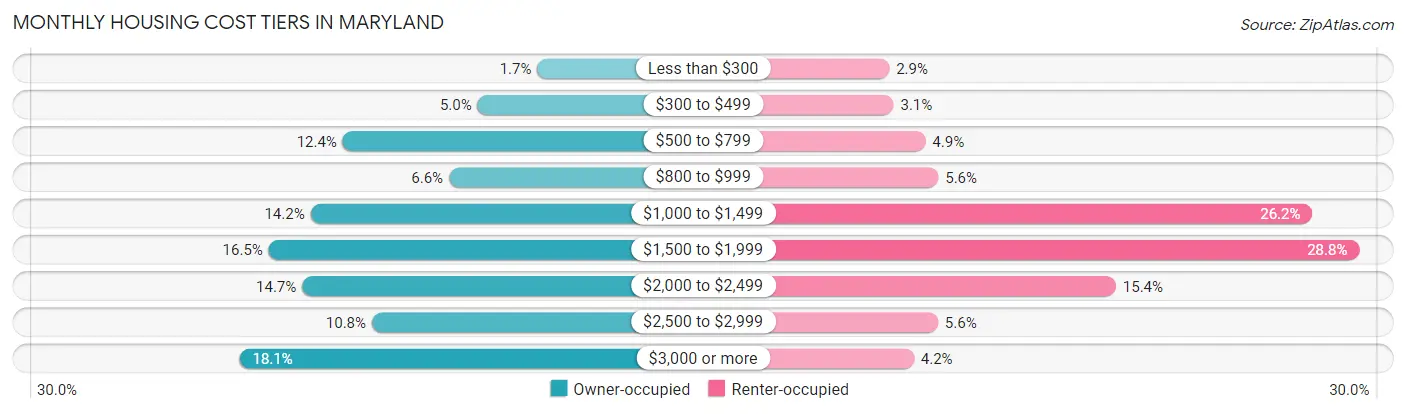
| Monthly Cost | Owner-occupied | Renter-occupied |
| Less than $300 | 26,232 (1.7%) | 21,603 (2.9%) |
| $300 to $499 | 77,867 (5.0%) | 23,362 (3.1%) |
| $500 to $799 | 194,444 (12.4%) | 36,632 (4.9%) |
| $800 to $999 | 102,554 (6.6%) | 42,016 (5.6%) |
| $1,000 to $1,499 | 222,239 (14.2%) | 197,815 (26.2%) |
| $1,500 to $1,999 | 258,444 (16.5%) | 217,302 (28.8%) |
| $2,000 to $2,499 | 229,454 (14.7%) | 115,965 (15.4%) |
| $2,500 to $2,999 | 169,181 (10.8%) | 41,838 (5.6%) |
| $3,000 or more | 283,641 (18.1%) | 31,805 (4.2%) |
| Total | 1,564,056 (100.0%) | 754,068 (100.0%) |
Physical Housing Characteristics in Maryland
Housing Structures in Maryland
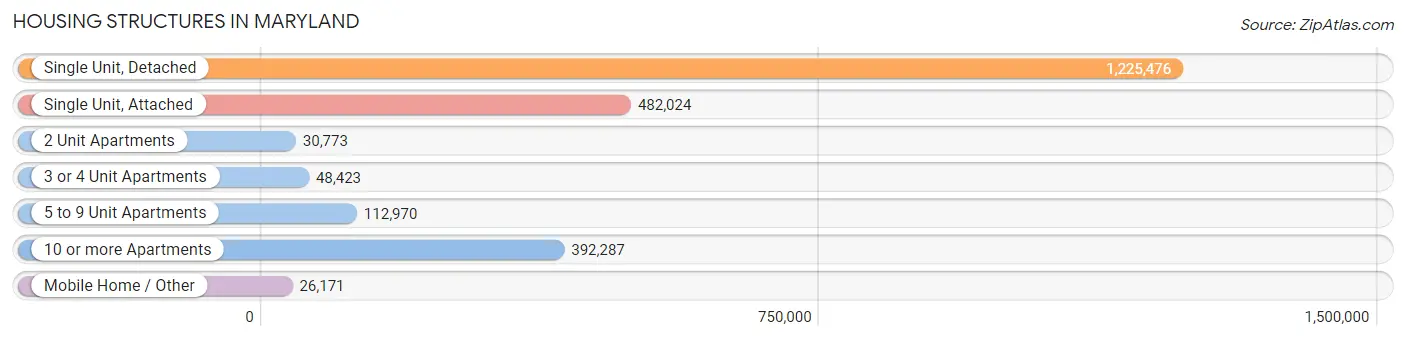
| Structure Type | # Housing Units | % Housing Units |
| Single Unit, Detached | 1,225,476 | 52.9% |
| Single Unit, Attached | 482,024 | 20.8% |
| 2 Unit Apartments | 30,773 | 1.3% |
| 3 or 4 Unit Apartments | 48,423 | 2.1% |
| 5 to 9 Unit Apartments | 112,970 | 4.9% |
| 10 or more Apartments | 392,287 | 16.9% |
| Mobile Home / Other | 26,171 | 1.1% |
| Total | 2,318,124 | 100.0% |
Housing Structures by Occupancy in Maryland
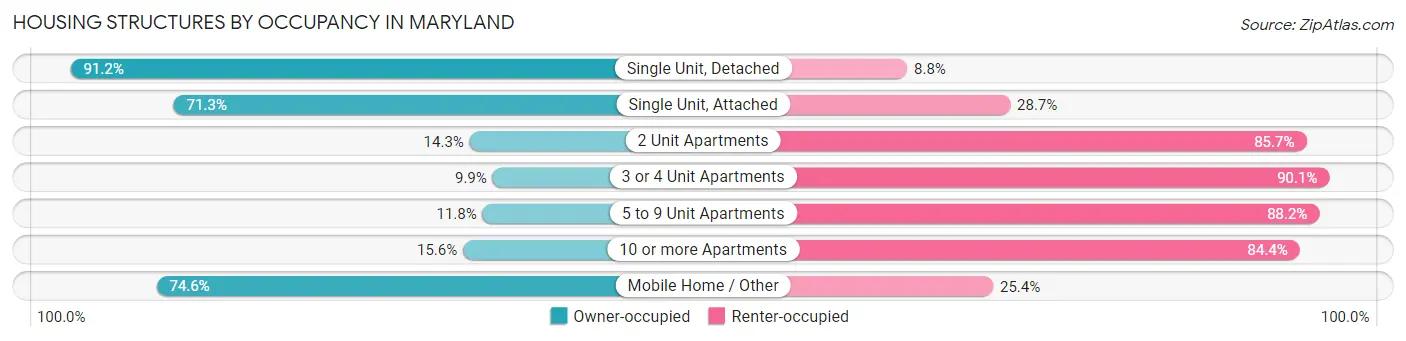
| Structure Type | Owner-occupied | Renter-occupied |
| Single Unit, Detached | 1,117,092 (91.2%) | 108,384 (8.8%) |
| Single Unit, Attached | 343,765 (71.3%) | 138,259 (28.7%) |
| 2 Unit Apartments | 4,403 (14.3%) | 26,370 (85.7%) |
| 3 or 4 Unit Apartments | 4,790 (9.9%) | 43,633 (90.1%) |
| 5 to 9 Unit Apartments | 13,356 (11.8%) | 99,614 (88.2%) |
| 10 or more Apartments | 61,123 (15.6%) | 331,164 (84.4%) |
| Mobile Home / Other | 19,527 (74.6%) | 6,644 (25.4%) |
| Total | 1,564,056 (67.5%) | 754,068 (32.5%) |
Housing Structures by Number of Rooms in Maryland
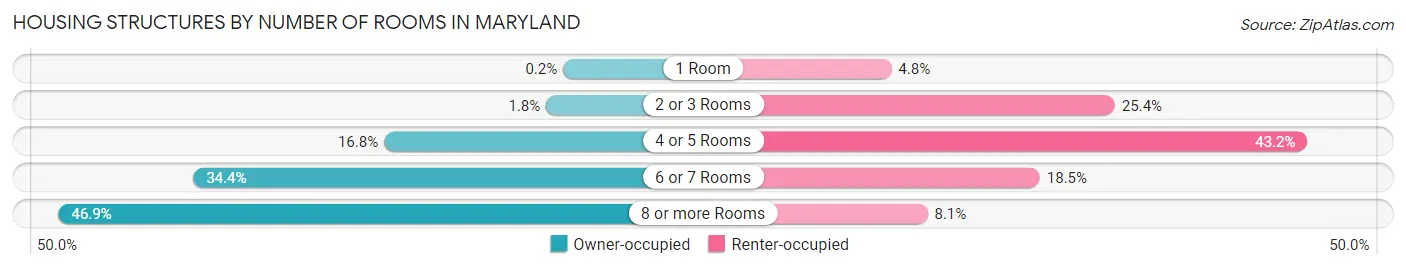
| Number of Rooms | Owner-occupied | Renter-occupied |
| 1 Room | 3,118 (0.2%) | 35,912 (4.8%) |
| 2 or 3 Rooms | 27,710 (1.8%) | 191,729 (25.4%) |
| 4 or 5 Rooms | 262,089 (16.8%) | 325,921 (43.2%) |
| 6 or 7 Rooms | 537,995 (34.4%) | 139,451 (18.5%) |
| 8 or more Rooms | 733,144 (46.9%) | 61,055 (8.1%) |
| Total | 1,564,056 (100.0%) | 754,068 (100.0%) |
Housing Structure by Heating Type in Maryland
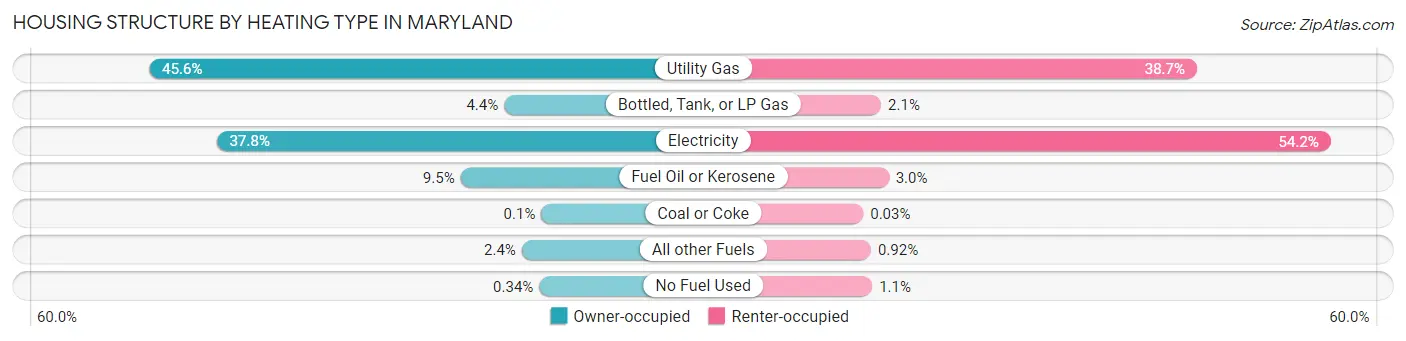
| Heating Type | Owner-occupied | Renter-occupied |
| Utility Gas | 712,740 (45.6%) | 291,769 (38.7%) |
| Bottled, Tank, or LP Gas | 68,936 (4.4%) | 15,848 (2.1%) |
| Electricity | 590,376 (37.8%) | 408,777 (54.2%) |
| Fuel Oil or Kerosene | 148,034 (9.5%) | 22,505 (3.0%) |
| Coal or Coke | 1,490 (0.1%) | 233 (0.0%) |
| All other Fuels | 37,102 (2.4%) | 6,969 (0.9%) |
| No Fuel Used | 5,378 (0.3%) | 7,967 (1.1%) |
| Total | 1,564,056 (100.0%) | 754,068 (100.0%) |
Household Vehicle Usage in Maryland
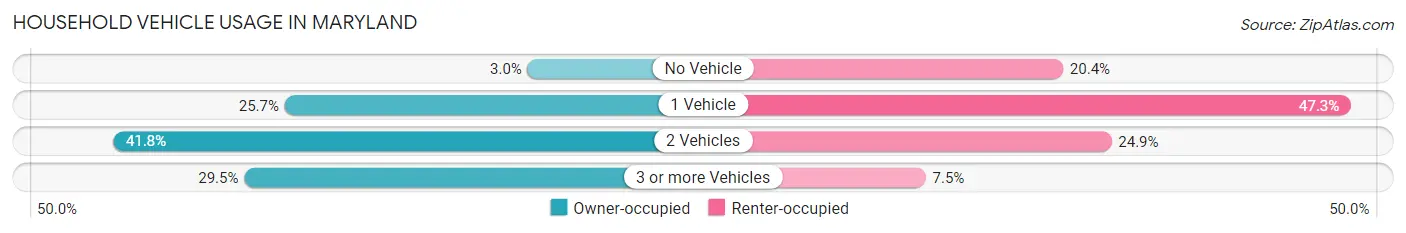
| Vehicles per Household | Owner-occupied | Renter-occupied |
| No Vehicle | 47,517 (3.0%) | 153,485 (20.3%) |
| 1 Vehicle | 402,164 (25.7%) | 356,304 (47.2%) |
| 2 Vehicles | 653,176 (41.8%) | 187,501 (24.9%) |
| 3 or more Vehicles | 461,199 (29.5%) | 56,778 (7.5%) |
| Total | 1,564,056 (100.0%) | 754,068 (100.0%) |
Real Estate & Mortgages in Maryland
Real Estate and Mortgage Overview in Maryland
| Characteristic | Without Mortgage | With Mortgage |
| Housing Units | 441,706 | 1,122,350 |
| Median Property Value | $353,100 | $389,700 |
| Median Household Income | $88,218 | $493,514 |
| Monthly Housing Costs | $703 | $280,265 |
| Real Estate Taxes | $3,666 | $25,021 |
Property Value by Mortgage Status in Maryland
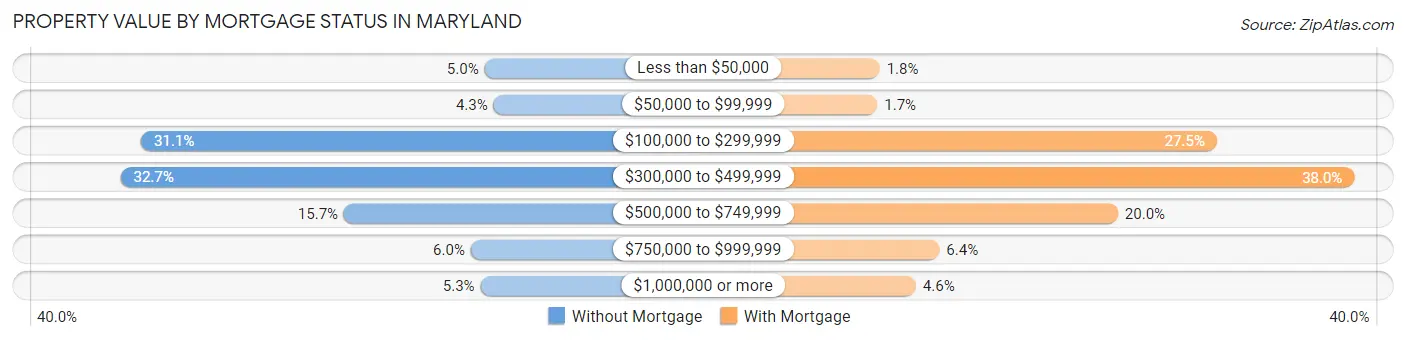
| Property Value | Without Mortgage | With Mortgage |
| Less than $50,000 | 21,915 (5.0%) | 20,652 (1.8%) |
| $50,000 to $99,999 | 18,873 (4.3%) | 18,634 (1.7%) |
| $100,000 to $299,999 | 137,449 (31.1%) | 308,919 (27.5%) |
| $300,000 to $499,999 | 144,414 (32.7%) | 426,375 (38.0%) |
| $500,000 to $749,999 | 69,217 (15.7%) | 224,386 (20.0%) |
| $750,000 to $999,999 | 26,541 (6.0%) | 71,729 (6.4%) |
| $1,000,000 or more | 23,297 (5.3%) | 51,655 (4.6%) |
| Total | 441,706 (100.0%) | 1,122,350 (100.0%) |
Household Income by Mortgage Status in Maryland
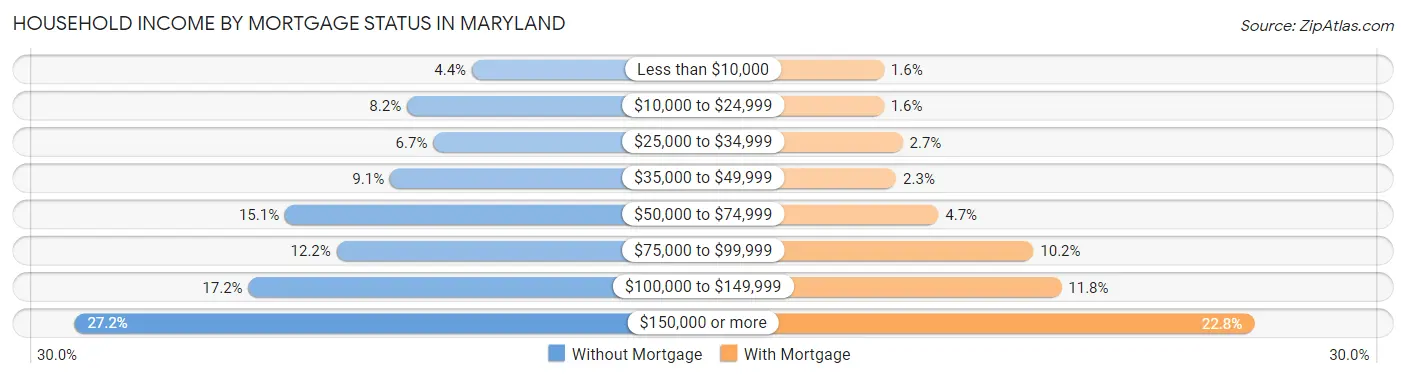
| Household Income | Without Mortgage | With Mortgage |
| Less than $10,000 | 19,633 (4.4%) | 18,190 (1.6%) |
| $10,000 to $24,999 | 35,978 (8.2%) | 18,045 (1.6%) |
| $25,000 to $34,999 | 29,352 (6.7%) | 30,140 (2.7%) |
| $35,000 to $49,999 | 40,289 (9.1%) | 26,016 (2.3%) |
| $50,000 to $74,999 | 66,768 (15.1%) | 53,088 (4.7%) |
| $75,000 to $99,999 | 53,746 (12.2%) | 114,067 (10.2%) |
| $100,000 to $149,999 | 76,007 (17.2%) | 131,943 (11.8%) |
| $150,000 or more | 119,933 (27.2%) | 255,537 (22.8%) |
| Total | 441,706 (100.0%) | 1,122,350 (100.0%) |
Property Value to Household Income Ratio in Maryland
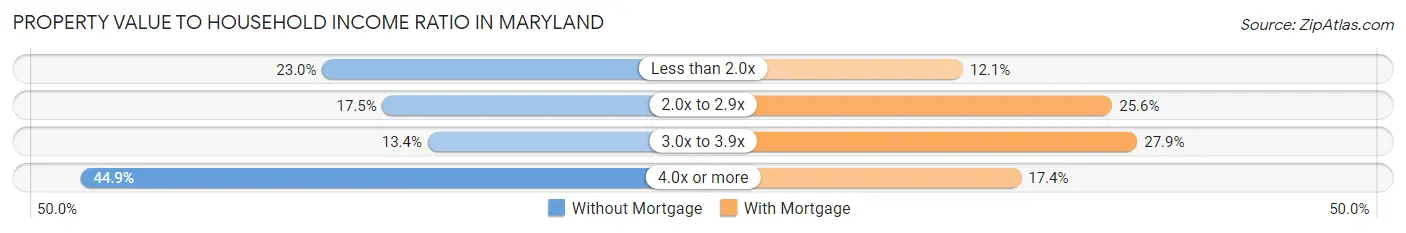
| Value-to-Income Ratio | Without Mortgage | With Mortgage |
| Less than 2.0x | 101,407 (23.0%) | 135,723 (12.1%) |
| 2.0x to 2.9x | 77,261 (17.5%) | 287,772 (25.6%) |
| 3.0x to 3.9x | 59,136 (13.4%) | 313,264 (27.9%) |
| 4.0x or more | 198,392 (44.9%) | 195,076 (17.4%) |
| Total | 441,706 (100.0%) | 1,122,350 (100.0%) |
Real Estate Taxes by Mortgage Status in Maryland
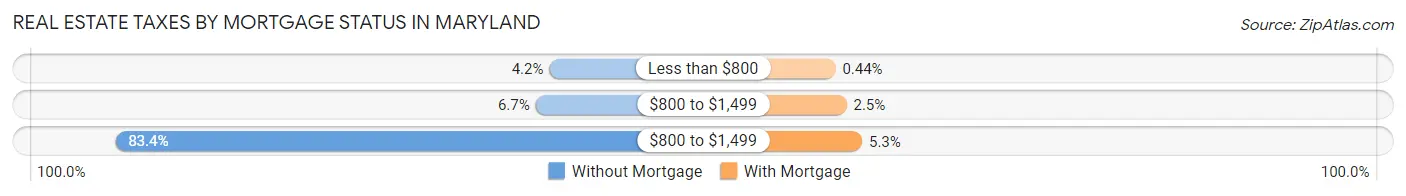
| Property Taxes | Without Mortgage | With Mortgage |
| Less than $800 | 18,377 (4.2%) | 4,964 (0.4%) |
| $800 to $1,499 | 29,472 (6.7%) | 27,599 (2.5%) |
| $800 to $1,499 | 368,572 (83.4%) | 59,442 (5.3%) |
| Total | 441,706 (100.0%) | 1,122,350 (100.0%) |
Health & Disability in Maryland
Health Insurance Coverage by Age in Maryland
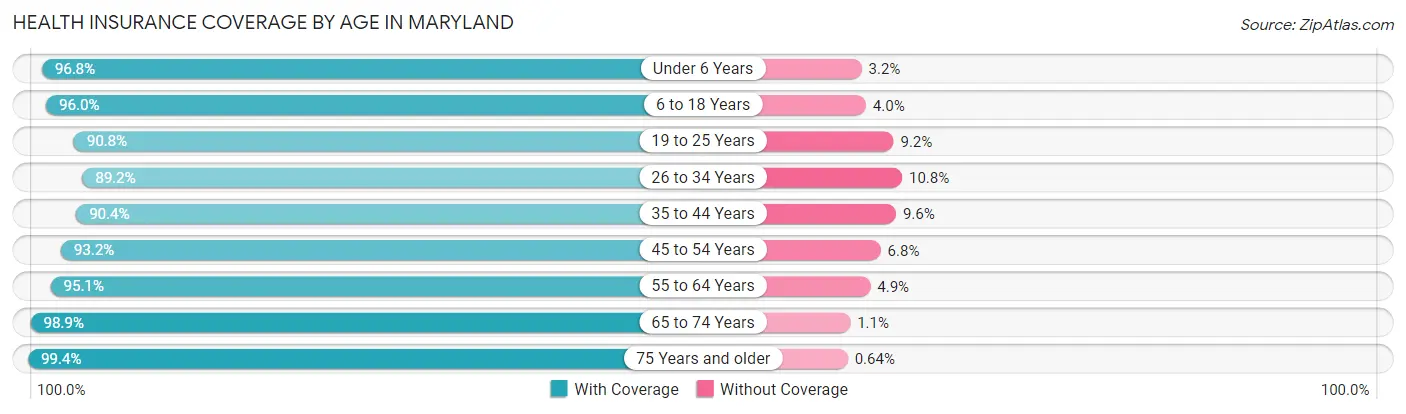
| Age Bracket | With Coverage | Without Coverage |
| Under 6 Years | 417,111 (96.8%) | 13,928 (3.2%) |
| 6 to 18 Years | 971,663 (96.0%) | 40,855 (4.0%) |
| 19 to 25 Years | 471,723 (90.8%) | 47,674 (9.2%) |
| 26 to 34 Years | 649,257 (89.2%) | 78,346 (10.8%) |
| 35 to 44 Years | 720,939 (90.4%) | 76,807 (9.6%) |
| 45 to 54 Years | 739,402 (93.2%) | 53,775 (6.8%) |
| 55 to 64 Years | 787,061 (95.1%) | 40,225 (4.9%) |
| 65 to 74 Years | 568,193 (98.9%) | 6,405 (1.1%) |
| 75 Years and older | 385,135 (99.4%) | 2,470 (0.6%) |
| Total | 5,710,484 (94.1%) | 360,485 (5.9%) |
Health Insurance Coverage by Citizenship Status in Maryland
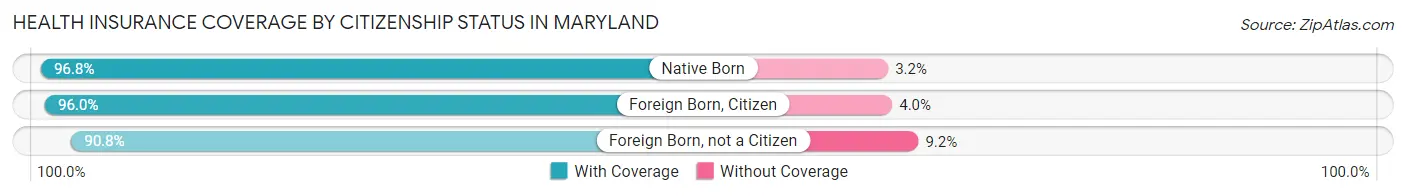
| Citizenship Status | With Coverage | Without Coverage |
| Native Born | 417,111 (96.8%) | 13,928 (3.2%) |
| Foreign Born, Citizen | 971,663 (96.0%) | 40,855 (4.0%) |
| Foreign Born, not a Citizen | 471,723 (90.8%) | 47,674 (9.2%) |
Health Insurance Coverage by Household Income in Maryland
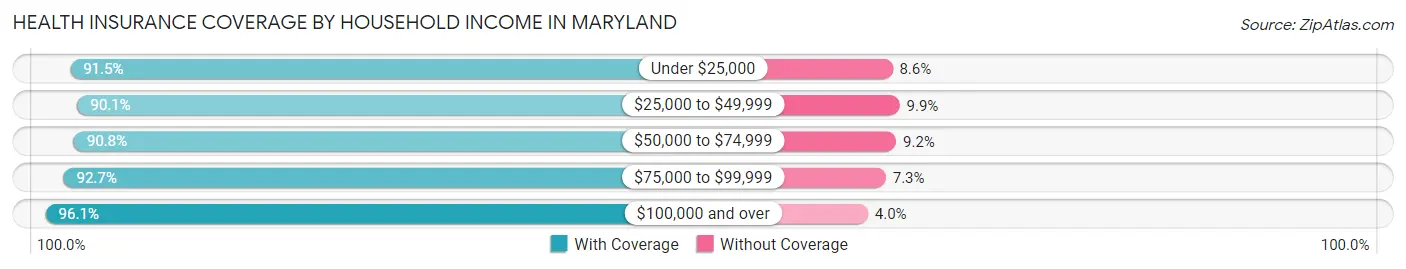
| Household Income | With Coverage | Without Coverage |
| Under $25,000 | 423,001 (91.4%) | 39,528 (8.6%) |
| $25,000 to $49,999 | 576,277 (90.1%) | 63,258 (9.9%) |
| $50,000 to $74,999 | 645,158 (90.8%) | 65,613 (9.2%) |
| $75,000 to $99,999 | 655,338 (92.7%) | 51,667 (7.3%) |
| $100,000 and over | 3,348,796 (96.1%) | 137,863 (4.0%) |
Public vs Private Health Insurance Coverage by Age in Maryland
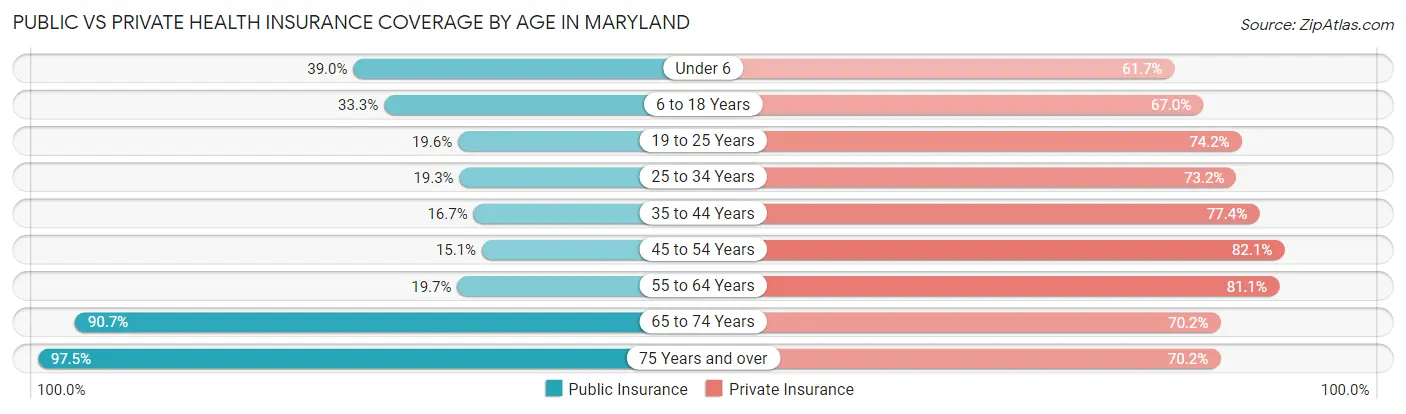
| Age Bracket | Public Insurance | Private Insurance |
| Under 6 | 168,065 (39.0%) | 266,071 (61.7%) |
| 6 to 18 Years | 336,898 (33.3%) | 678,776 (67.0%) |
| 19 to 25 Years | 101,602 (19.6%) | 385,225 (74.2%) |
| 25 to 34 Years | 140,324 (19.3%) | 532,577 (73.2%) |
| 35 to 44 Years | 133,054 (16.7%) | 617,675 (77.4%) |
| 45 to 54 Years | 119,835 (15.1%) | 651,181 (82.1%) |
| 55 to 64 Years | 162,903 (19.7%) | 671,045 (81.1%) |
| 65 to 74 Years | 520,910 (90.7%) | 403,580 (70.2%) |
| 75 Years and over | 378,054 (97.5%) | 272,129 (70.2%) |
| Total | 2,061,645 (34.0%) | 4,478,259 (73.8%) |
Disability Status by Sex by Age in Maryland
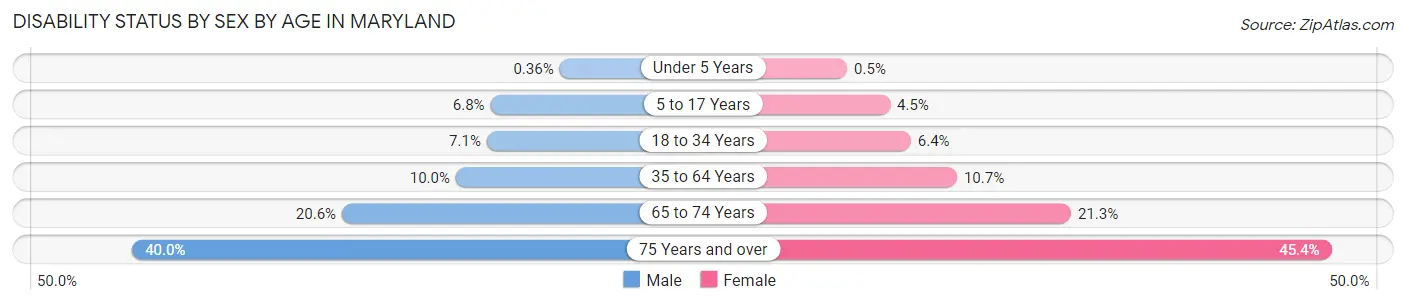
| Age Bracket | Male | Female |
| Under 5 Years | 664 (0.4%) | 872 (0.5%) |
| 5 to 17 Years | 34,611 (6.8%) | 21,930 (4.5%) |
| 18 to 34 Years | 46,681 (7.1%) | 43,199 (6.4%) |
| 35 to 64 Years | 116,633 (10.0%) | 133,670 (10.7%) |
| 65 to 74 Years | 54,149 (20.5%) | 66,195 (21.3%) |
| 75 Years and over | 62,645 (40.0%) | 104,995 (45.4%) |
Disability Class by Sex by Age in Maryland
Disability Class: Hearing Difficulty
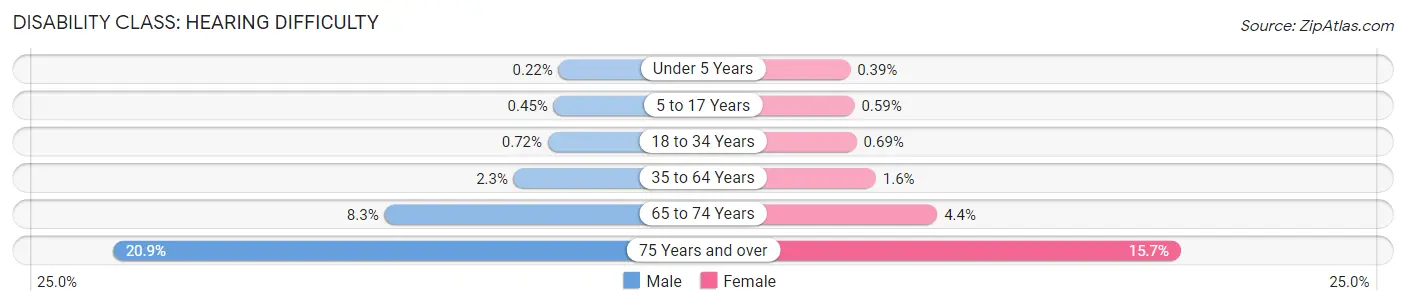
| Age Bracket | Male | Female |
| Under 5 Years | 407 (0.2%) | 689 (0.4%) |
| 5 to 17 Years | 2,284 (0.4%) | 2,872 (0.6%) |
| 18 to 34 Years | 4,732 (0.7%) | 4,652 (0.7%) |
| 35 to 64 Years | 26,916 (2.3%) | 19,812 (1.6%) |
| 65 to 74 Years | 21,871 (8.3%) | 13,772 (4.4%) |
| 75 Years and over | 32,736 (20.9%) | 36,352 (15.7%) |
Disability Class: Vision Difficulty
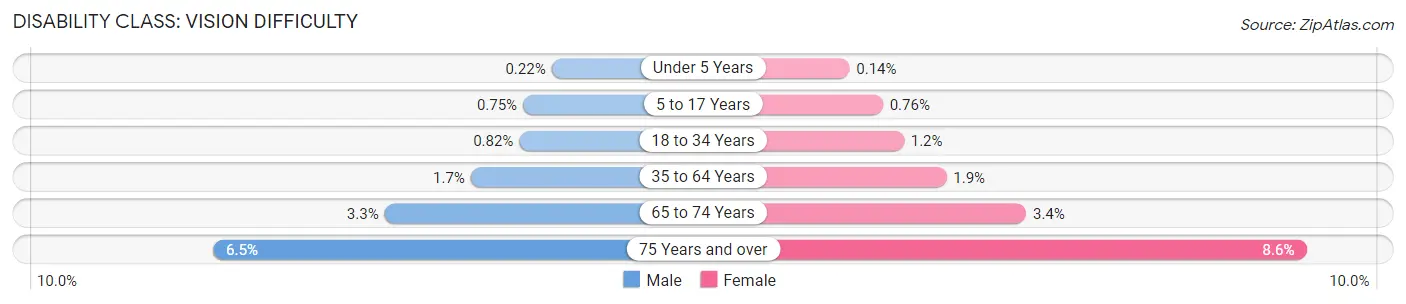
| Age Bracket | Male | Female |
| Under 5 Years | 399 (0.2%) | 254 (0.1%) |
| 5 to 17 Years | 3,853 (0.7%) | 3,738 (0.8%) |
| 18 to 34 Years | 5,400 (0.8%) | 7,746 (1.1%) |
| 35 to 64 Years | 20,040 (1.7%) | 24,265 (1.9%) |
| 65 to 74 Years | 8,736 (3.3%) | 10,654 (3.4%) |
| 75 Years and over | 10,175 (6.5%) | 19,916 (8.6%) |
Disability Class: Cognitive Difficulty
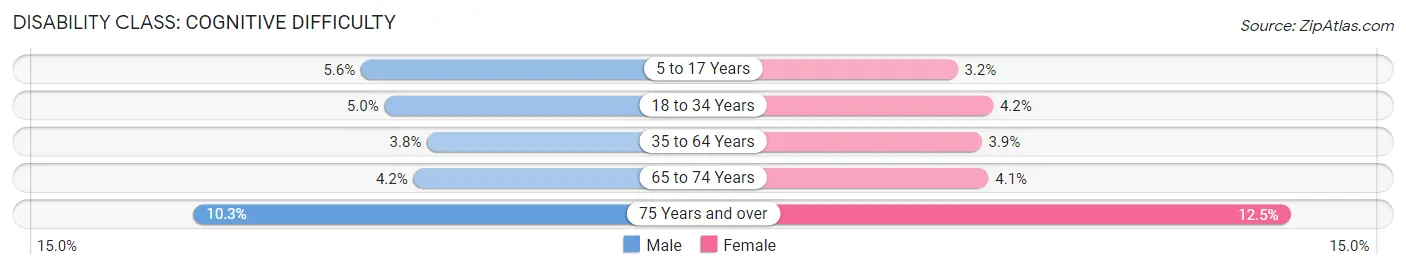
| Age Bracket | Male | Female |
| 5 to 17 Years | 28,816 (5.6%) | 15,730 (3.2%) |
| 18 to 34 Years | 32,723 (5.0%) | 28,413 (4.2%) |
| 35 to 64 Years | 44,229 (3.8%) | 48,588 (3.9%) |
| 65 to 74 Years | 10,983 (4.2%) | 12,691 (4.1%) |
| 75 Years and over | 16,129 (10.3%) | 28,865 (12.5%) |
Disability Class: Ambulatory Difficulty
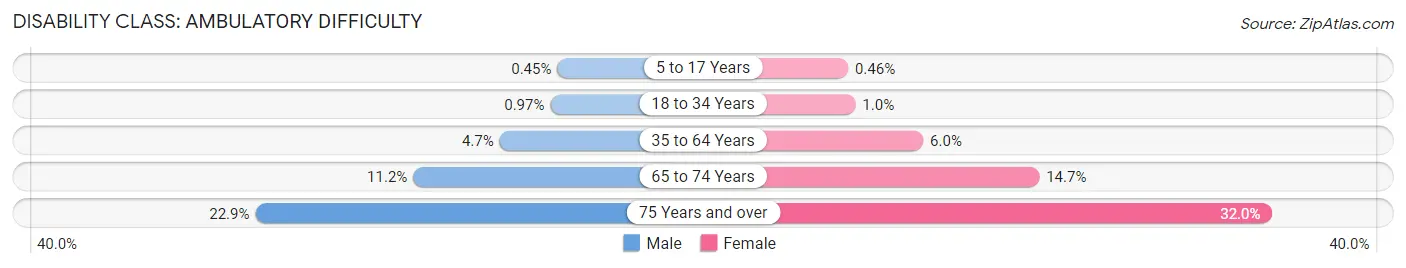
| Age Bracket | Male | Female |
| 5 to 17 Years | 2,295 (0.4%) | 2,236 (0.5%) |
| 18 to 34 Years | 6,394 (1.0%) | 6,818 (1.0%) |
| 35 to 64 Years | 55,325 (4.7%) | 75,547 (6.0%) |
| 65 to 74 Years | 29,368 (11.2%) | 45,601 (14.7%) |
| 75 Years and over | 35,808 (22.9%) | 73,850 (32.0%) |
Disability Class: Self-Care Difficulty
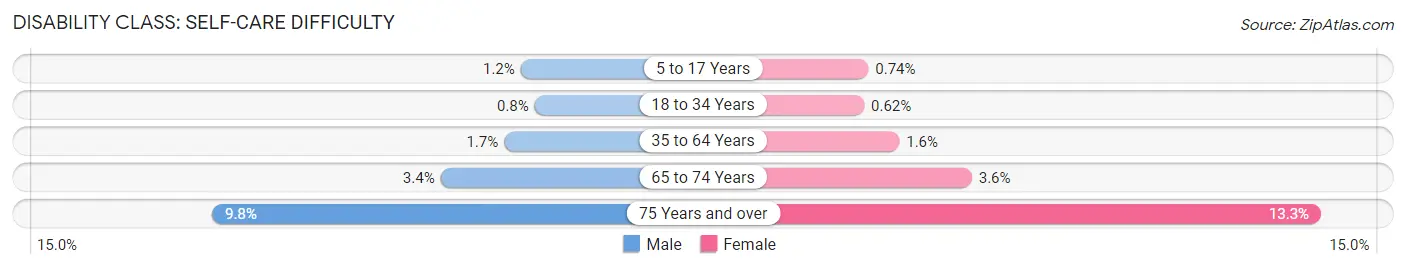
| Age Bracket | Male | Female |
| 5 to 17 Years | 6,076 (1.2%) | 3,598 (0.7%) |
| 18 to 34 Years | 5,263 (0.8%) | 4,176 (0.6%) |
| 35 to 64 Years | 19,274 (1.7%) | 19,944 (1.6%) |
| 65 to 74 Years | 9,003 (3.4%) | 11,259 (3.6%) |
| 75 Years and over | 15,311 (9.8%) | 30,814 (13.3%) |
Technology Access in Maryland
Computing Device Access in Maryland
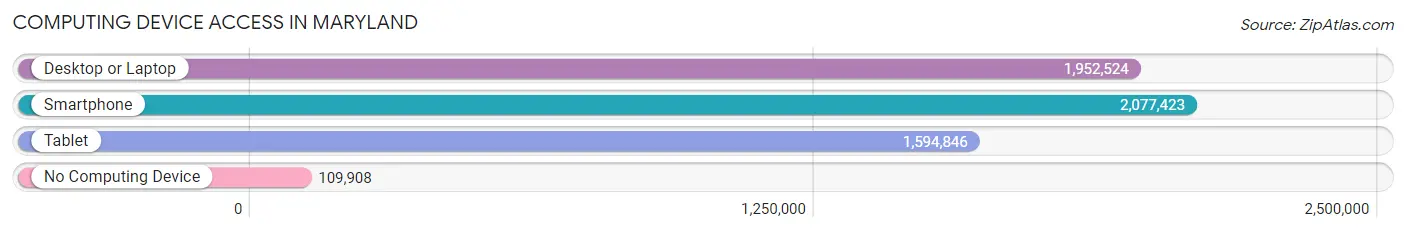
| Device Type | # Households | % Households |
| Desktop or Laptop | 1,952,524 | 84.2% |
| Smartphone | 2,077,423 | 89.6% |
| Tablet | 1,594,846 | 68.8% |
| No Computing Device | 109,908 | 4.7% |
| Total | 2,318,124 | 100.0% |
Internet Access in Maryland
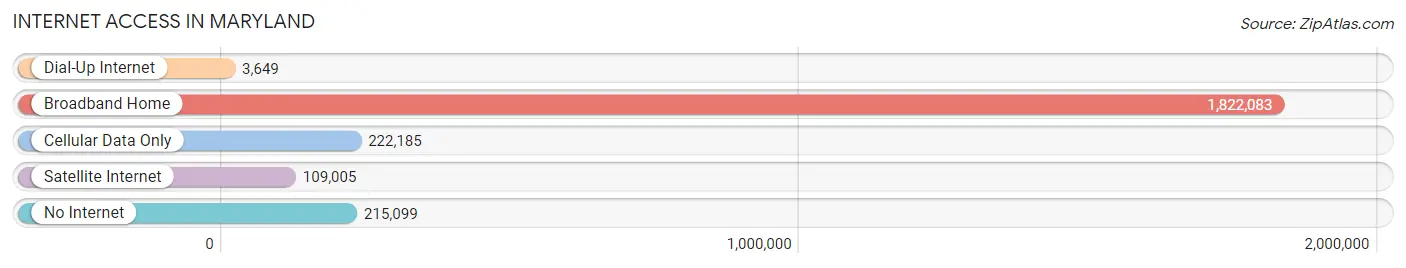
| Internet Type | # Households | % Households |
| Dial-Up Internet | 3,649 | 0.2% |
| Broadband Home | 1,822,083 | 78.6% |
| Cellular Data Only | 222,185 | 9.6% |
| Satellite Internet | 109,005 | 4.7% |
| No Internet | 215,099 | 9.3% |
| Total | 2,318,124 | 100.0% |
Maryland Summary
Maryland is a state located in the Mid-Atlantic region of the United States. It is bordered by Virginia, West Virginia, and the District of Columbia to the south and west; Pennsylvania to the north; and Delaware to the east. Maryland is the 9th smallest state in the country and the 19th most populous. It is the 7th most densely populated state in the nation.
History
The area that is now Maryland was first inhabited by Native Americans, including the Susquehannock, the Piscataway, and the Nanticoke. The first European settlers arrived in the area in 1634, when the English established the colony of Maryland. The colony was named after Queen Henrietta Maria, the wife of King Charles I of England.
The colony was initially a proprietary colony, meaning it was owned by a private individual, Cecil Calvert, the 2nd Lord Baltimore. The colony was founded as a refuge for English Catholics, who were persecuted in England. Maryland was one of the original thirteen colonies that declared independence from Britain in 1776.
Geography
Maryland is located in the Mid-Atlantic region of the United States. It is bordered by Virginia, West Virginia, and the District of Columbia to the south and west; Pennsylvania to the north; and Delaware to the east. Maryland is the 9th smallest state in the country and the 19th most populous. It is the 7th most densely populated state in the nation.
The state is divided into two distinct regions: the Eastern Shore and the Western Shore. The Eastern Shore is located on the Delmarva Peninsula and is home to the Chesapeake Bay and its tributaries. The Western Shore is located on the mainland and is home to the Appalachian Mountains.
The highest point in Maryland is Hoye-Crest, located in Garrett County, at an elevation of 3,360 feet. The lowest point is sea level, located along the Atlantic Ocean.
Economy
Maryland has a diverse economy, with a mix of industries including manufacturing, technology, agriculture, and tourism. The state is home to several major companies, including Lockheed Martin, Northrop Grumman, and Marriott International.
The state’s largest industries are manufacturing, technology, and health care. Maryland is also home to several major military installations, including the Naval Air Station Patuxent River and the Aberdeen Proving Ground.
The state’s agricultural products include poultry, dairy, corn, soybeans, and vegetables. Maryland is also home to several major ports, including the Port of Baltimore and the Port of Chesapeake.
Demographics
As of 2019, the population of Maryland was estimated to be 6,045,680. The state is home to a diverse population, with a mix of races and ethnicities. The largest racial group is White (60.2%), followed by Black or African American (30.2%), Hispanic or Latino (8.2%), and Asian (5.3%).
The median household income in Maryland is $80,776, which is higher than the national median of $61,937. The median age in the state is 38.7 years, which is slightly lower than the national median of 38.9 years.
Conclusion
Maryland is a state located in the Mid-Atlantic region of the United States. It is bordered by Virginia, West Virginia, and the District of Columbia to the south and west; Pennsylvania to the north; and Delaware to the east. Maryland is the 9th smallest state in the country and the 19th most populous. It is the 7th most densely populated state in the nation.
The state has a diverse economy, with a mix of industries including manufacturing, technology, agriculture, and tourism. The state is home to a diverse population, with a mix of races and ethnicities. The median household income in Maryland is $80,776, which is higher than the national median of $61,937. The median age in the state is 38.7 years, which is slightly lower than the national median of 38.9 years.
Common Questions
When was Maryland Incorporated?
Maryland was Incorporated into the Union on Apr 28, 1788.
What is the Total Area of Maryland?
Total Area of Maryland is 12,406 Square Miles.
What is the Total Land Area of Maryland?
Total Land Area of Maryland is 9,705 Square Miles.
What is the Total Water Area of Maryland?
Total Water Area of Maryland is 2,700 Square Miles.
What is the Average Elevation in Maryland?
Average Elevation in Maryland is 350 Feet.
What is the Highest Elevation in Maryland?
Highest Elevation in Maryland is 3,360 Feet.
What is the Lowest Elevation in Maryland?
Lowest Elevation in Maryland is 0 Feet.
What is the Population Density in Maryland?
Population Density in Maryland is 634.9 People per Square Mile.
What is Per Capita Income in Maryland?
Per Capita income in Maryland is $49,865.
What is the Median Family Income in Maryland?
Median Family Income in Maryland is $120,081.
What is the Median Household income in Maryland?
Median Household Income in Maryland is $98,461.
What is Income or Wage Gap in Maryland?
Income or Wage Gap in Maryland is 21.9%.
Women in Maryland earn 78.1 cents for every dollar earned by a man.
What is Family Income Deficit in Maryland?
Family Income Deficit in Maryland is $11,512.
Families that are below poverty line in Maryland earn $11,512 less on average than the poverty threshold level.
What is Inequality or Gini Index in Maryland?
Inequality or Gini Index in Maryland is 0.46.
What is the Total Population of Maryland?
Total Population of Maryland is 6,161,707.
What is the Total Male Population of Maryland?
Total Male Population of Maryland is 3,002,896.
What is the Total Female Population of Maryland?
Total Female Population of Maryland is 3,158,811.
What is the Ratio of Males per 100 Females in Maryland?
There are 95.06 Males per 100 Females in Maryland.
What is the Ratio of Females per 100 Males in Maryland?
There are 105.19 Females per 100 Males in Maryland.
What is the Median Population Age in Maryland?
Median Population Age in Maryland is 39.1 Years.
What is the Average Family Size in Maryland
Average Family Size in Maryland is 3.2 People.
What is the Average Household Size in Maryland
Average Household Size in Maryland is 2.6 People.
How Large is the Labor Force in Maryland?
There are 3,331,304 People in the Labor Forcein in Maryland.
What is the Percentage of People in the Labor Force in Maryland?
67.2% of People are in the Labor Force in Maryland.
What is the Unemployment Rate in Maryland?
Unemployment Rate in Maryland is 5.1%.