Cities with the Highest Percentage of Immigrants from Sri Lanka in California
RELATED REPORTS & OPTIONS
Sri Lanka
California
Compare Cities
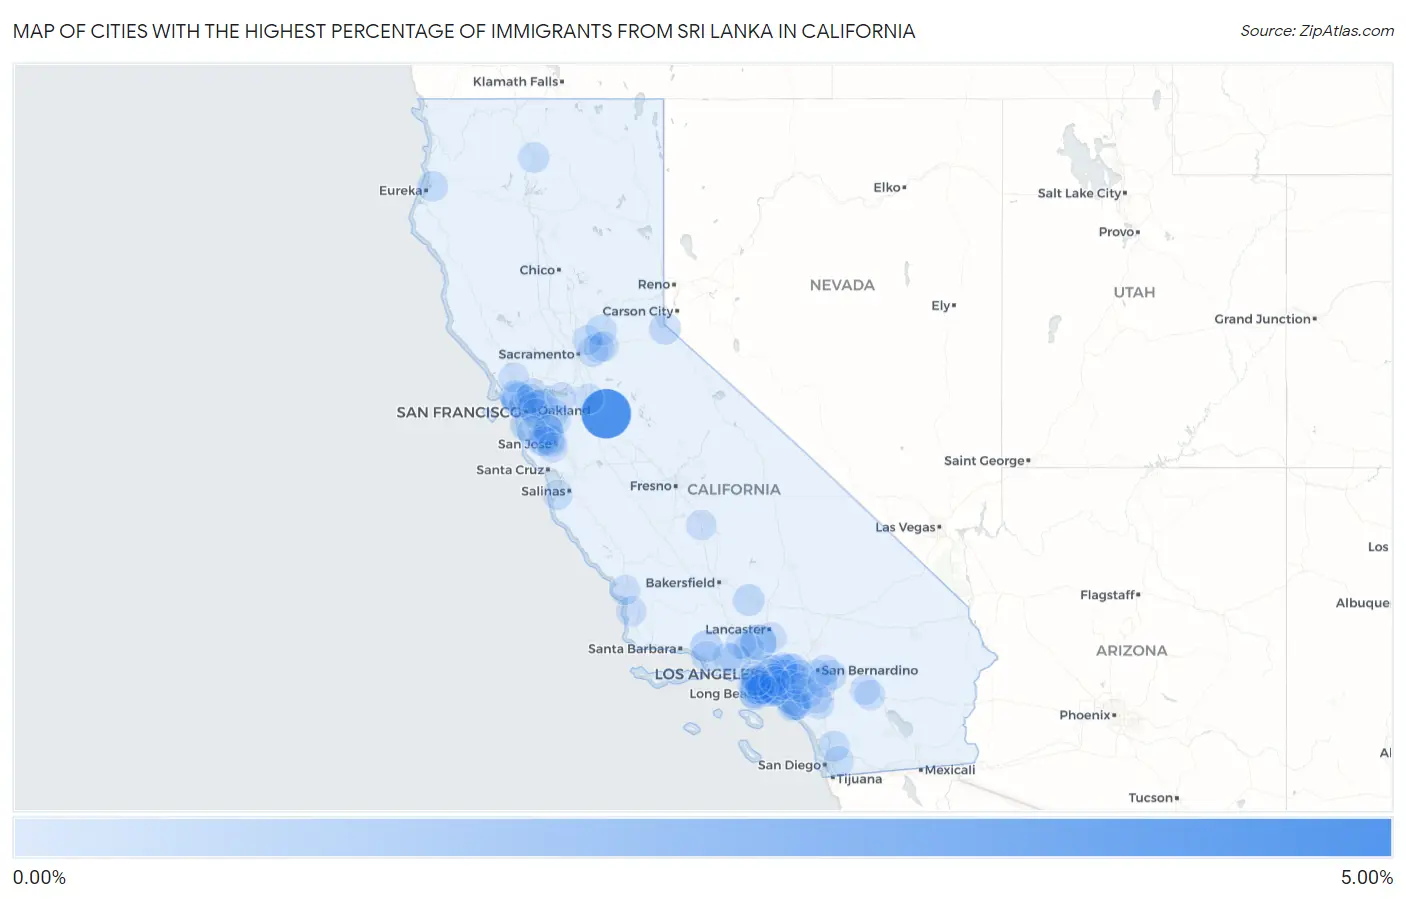
Map of Cities with the Highest Percentage of Immigrants from Sri Lanka in California
0.00%
5.00%
Cities with the Highest Percentage of Immigrants from Sri Lanka in California
| City | Sri Lanka | vs State | vs National | |
| 1. | Del Rio | 4.36% | 0.029%(+4.33)#-1 | 0.017%(+4.35)#0 |
| 2. | Agua Dulce | 1.23% | 0.029%(+1.21)#0 | 0.017%(+1.22)#1 |
| 3. | Kentfield | 0.94% | 0.029%(+0.916)#1 | 0.017%(+0.928)#2 |
| 4. | Strawberry Cdp Marin County | 0.66% | 0.029%(+0.628)#2 | 0.017%(+0.640)#3 |
| 5. | Millbrae | 0.44% | 0.029%(+0.409)#167 | 0.017%(+0.421)#1,596 |
| 6. | Ojai | 0.41% | 0.029%(+0.379)#168 | 0.017%(+0.390)#1,597 |
| 7. | Tehachapi | 0.38% | 0.029%(+0.352)#254 | 0.017%(+0.364)#2,133 |
| 8. | South Lake Tahoe | 0.36% | 0.029%(+0.332)#255 | 0.017%(+0.344)#2,134 |
| 9. | Fairfax | 0.34% | 0.029%(+0.315)#256 | 0.017%(+0.326)#2,135 |
| 10. | San Ramon | 0.31% | 0.029%(+0.281)#257 | 0.017%(+0.293)#2,136 |
| 11. | Sunnyvale | 0.28% | 0.029%(+0.249)#258 | 0.017%(+0.260)#2,137 |
| 12. | Eastern Goleta Valley | 0.27% | 0.029%(+0.245)#259 | 0.017%(+0.257)#2,138 |
| 13. | Palos Verdes Estates | 0.26% | 0.029%(+0.229)#260 | 0.017%(+0.240)#2,139 |
| 14. | Poway | 0.25% | 0.029%(+0.224)#261 | 0.017%(+0.235)#2,140 |
| 15. | Gold River | 0.24% | 0.029%(+0.212)#262 | 0.017%(+0.223)#2,141 |
| 16. | Lawndale | 0.23% | 0.029%(+0.203)#263 | 0.017%(+0.214)#2,142 |
| 17. | Aliso Viejo | 0.23% | 0.029%(+0.201)#264 | 0.017%(+0.212)#2,143 |
| 18. | Dunsmuir | 0.23% | 0.029%(+0.199)#265 | 0.017%(+0.211)#2,144 |
| 19. | Auburn | 0.23% | 0.029%(+0.196)#266 | 0.017%(+0.208)#2,145 |
| 20. | Wildomar | 0.21% | 0.029%(+0.186)#267 | 0.017%(+0.197)#2,146 |
| 21. | Charter Oak | 0.21% | 0.029%(+0.186)#268 | 0.017%(+0.197)#2,147 |
| 22. | Simi Valley | 0.21% | 0.029%(+0.184)#269 | 0.017%(+0.195)#2,148 |
| 23. | Grand Terrace | 0.20% | 0.029%(+0.170)#270 | 0.017%(+0.181)#2,149 |
| 24. | Tiburon | 0.20% | 0.029%(+0.169)#271 | 0.017%(+0.180)#2,150 |
| 25. | Cerritos | 0.20% | 0.029%(+0.167)#272 | 0.017%(+0.179)#2,151 |
| 26. | Rolling Hills Estates | 0.19% | 0.029%(+0.166)#273 | 0.017%(+0.178)#2,152 |
| 27. | Arcata | 0.18% | 0.029%(+0.155)#274 | 0.017%(+0.166)#2,153 |
| 28. | Folsom | 0.18% | 0.029%(+0.153)#275 | 0.017%(+0.164)#2,154 |
| 29. | Rossmoor | 0.18% | 0.029%(+0.150)#276 | 0.017%(+0.162)#2,155 |
| 30. | La Canada Flintridge | 0.17% | 0.029%(+0.143)#277 | 0.017%(+0.155)#2,156 |
| 31. | Santa Clara | 0.17% | 0.029%(+0.140)#278 | 0.017%(+0.152)#2,157 |
| 32. | Hercules | 0.17% | 0.029%(+0.136)#279 | 0.017%(+0.148)#2,158 |
| 33. | Lafayette | 0.16% | 0.029%(+0.133)#280 | 0.017%(+0.145)#2,159 |
| 34. | Yucaipa | 0.15% | 0.029%(+0.124)#281 | 0.017%(+0.135)#2,160 |
| 35. | Rancho Palos Verdes | 0.14% | 0.029%(+0.110)#282 | 0.017%(+0.122)#2,161 |
| 36. | Rancho San Diego | 0.13% | 0.029%(+0.105)#283 | 0.017%(+0.117)#2,162 |
| 37. | El Segundo | 0.12% | 0.029%(+0.094)#284 | 0.017%(+0.106)#2,163 |
| 38. | San Buenaventura Ventura | 0.12% | 0.029%(+0.090)#285 | 0.017%(+0.102)#2,164 |
| 39. | Newark | 0.11% | 0.029%(+0.085)#286 | 0.017%(+0.097)#2,165 |
| 40. | Torrance | 0.11% | 0.029%(+0.085)#287 | 0.017%(+0.096)#2,166 |
| 41. | Palo Alto | 0.11% | 0.029%(+0.083)#288 | 0.017%(+0.095)#2,167 |
| 42. | Signal Hill | 0.11% | 0.029%(+0.083)#289 | 0.017%(+0.094)#2,168 |
| 43. | Santa Clarita | 0.11% | 0.029%(+0.082)#290 | 0.017%(+0.094)#2,169 |
| 44. | Guadalupe | 0.11% | 0.029%(+0.080)#291 | 0.017%(+0.092)#2,170 |
| 45. | West Covina | 0.11% | 0.029%(+0.079)#292 | 0.017%(+0.090)#2,171 |
| 46. | South Pasadena | 0.11% | 0.029%(+0.077)#293 | 0.017%(+0.088)#2,172 |
| 47. | Walnut | 0.10% | 0.029%(+0.074)#294 | 0.017%(+0.086)#2,173 |
| 48. | Tulare | 0.097% | 0.029%(+0.068)#295 | 0.017%(+0.080)#2,174 |
| 49. | Castaic | 0.097% | 0.029%(+0.068)#296 | 0.017%(+0.079)#2,175 |
| 50. | Irvine | 0.096% | 0.029%(+0.067)#297 | 0.017%(+0.078)#2,176 |
| 51. | Emeryville | 0.093% | 0.029%(+0.065)#298 | 0.017%(+0.076)#2,177 |
| 52. | Claremont | 0.092% | 0.029%(+0.063)#299 | 0.017%(+0.075)#2,178 |
| 53. | Laguna Hills | 0.090% | 0.029%(+0.061)#300 | 0.017%(+0.073)#2,179 |
| 54. | La Verne | 0.090% | 0.029%(+0.061)#301 | 0.017%(+0.073)#2,180 |
| 55. | East San Gabriel | 0.088% | 0.029%(+0.060)#302 | 0.017%(+0.071)#2,181 |
| 56. | Lakewood | 0.087% | 0.029%(+0.058)#303 | 0.017%(+0.070)#2,182 |
| 57. | Lomita | 0.087% | 0.029%(+0.058)#304 | 0.017%(+0.070)#2,183 |
| 58. | Hawaiian Gardens | 0.086% | 0.029%(+0.057)#305 | 0.017%(+0.069)#2,184 |
| 59. | Moorpark | 0.083% | 0.029%(+0.054)#306 | 0.017%(+0.066)#2,185 |
| 60. | Azusa | 0.076% | 0.029%(+0.048)#307 | 0.017%(+0.059)#2,186 |
| 61. | West Carson | 0.076% | 0.029%(+0.048)#308 | 0.017%(+0.059)#2,187 |
| 62. | Monterey Park | 0.076% | 0.029%(+0.047)#309 | 0.017%(+0.059)#2,188 |
| 63. | Highland | 0.074% | 0.029%(+0.045)#310 | 0.017%(+0.057)#2,206 |
| 64. | Palmdale | 0.074% | 0.029%(+0.045)#311 | 0.017%(+0.057)#2,207 |
| 65. | Inglewood | 0.072% | 0.029%(+0.043)#312 | 0.017%(+0.055)#2,208 |
| 66. | Orinda | 0.072% | 0.029%(+0.043)#313 | 0.017%(+0.055)#2,209 |
| 67. | Roseville | 0.071% | 0.029%(+0.043)#314 | 0.017%(+0.054)#2,210 |
| 68. | Ontario | 0.070% | 0.029%(+0.041)#315 | 0.017%(+0.053)#2,211 |
| 69. | Oakland | 0.069% | 0.029%(+0.040)#316 | 0.017%(+0.052)#2,212 |
| 70. | Cypress | 0.068% | 0.029%(+0.039)#317 | 0.017%(+0.051)#2,213 |
| 71. | Monterey | 0.067% | 0.029%(+0.038)#318 | 0.017%(+0.050)#2,214 |
| 72. | Petaluma | 0.065% | 0.029%(+0.037)#319 | 0.017%(+0.048)#2,221 |
| 73. | Lake Forest | 0.064% | 0.029%(+0.036)#320 | 0.017%(+0.047)#2,222 |
| 74. | Pleasanton | 0.064% | 0.029%(+0.035)#321 | 0.017%(+0.046)#2,223 |
| 75. | West Whittier Los Nietos | 0.063% | 0.029%(+0.034)#322 | 0.017%(+0.046)#2,224 |
| 76. | Stockton | 0.062% | 0.029%(+0.034)#323 | 0.017%(+0.045)#2,225 |
| 77. | Los Alamitos | 0.060% | 0.029%(+0.031)#324 | 0.017%(+0.043)#2,226 |
| 78. | Fremont | 0.057% | 0.029%(+0.028)#325 | 0.017%(+0.040)#2,227 |
| 79. | Palm Desert | 0.057% | 0.029%(+0.028)#326 | 0.017%(+0.039)#2,228 |
| 80. | Yorba Linda | 0.056% | 0.029%(+0.027)#327 | 0.017%(+0.039)#2,229 |
| 81. | Mission Viejo | 0.056% | 0.029%(+0.027)#328 | 0.017%(+0.039)#2,230 |
| 82. | Richmond | 0.054% | 0.029%(+0.025)#329 | 0.017%(+0.037)#2,231 |
| 83. | Fullerton | 0.053% | 0.029%(+0.025)#330 | 0.017%(+0.036)#2,295 |
| 84. | Temescal Valley | 0.053% | 0.029%(+0.024)#331 | 0.017%(+0.036)#2,296 |
| 85. | Chino | 0.053% | 0.029%(+0.024)#332 | 0.017%(+0.036)#2,297 |
| 86. | Los Altos | 0.051% | 0.029%(+0.023)#333 | 0.017%(+0.034)#2,298 |
| 87. | Belmont | 0.050% | 0.029%(+0.022)#334 | 0.017%(+0.033)#2,299 |
| 88. | Cathedral City | 0.050% | 0.029%(+0.021)#335 | 0.017%(+0.033)#2,300 |
| 89. | Los Angeles | 0.050% | 0.029%(+0.021)#336 | 0.017%(+0.033)#2,301 |
| 90. | El Dorado Hills | 0.049% | 0.029%(+0.020)#337 | 0.017%(+0.032)#2,302 |
| 91. | Gardena | 0.048% | 0.029%(+0.019)#338 | 0.017%(+0.031)#2,303 |
| 92. | San Luis Obispo | 0.046% | 0.029%(+0.018)#339 | 0.017%(+0.029)#2,304 |
| 93. | Antioch | 0.046% | 0.029%(+0.017)#340 | 0.017%(+0.029)#2,305 |
| 94. | Campbell | 0.046% | 0.029%(+0.017)#341 | 0.017%(+0.029)#2,306 |
| 95. | Lake Elsinore | 0.046% | 0.029%(+0.017)#342 | 0.017%(+0.029)#2,307 |
| 96. | Corona | 0.045% | 0.029%(+0.017)#343 | 0.017%(+0.028)#2,308 |
| 97. | Carson | 0.044% | 0.029%(+0.016)#344 | 0.017%(+0.027)#2,309 |
| 98. | South Whittier | 0.044% | 0.029%(+0.015)#345 | 0.017%(+0.026)#2,310 |
| 99. | Lennox | 0.044% | 0.029%(+0.015)#346 | 0.017%(+0.026)#2,311 |
| 100. | Moreno Valley | 0.043% | 0.029%(+0.015)#347 | 0.017%(+0.026)#2,312 |
Common Questions
What are the Top 10 Cities with the Highest Percentage of Immigrants from Sri Lanka in California?
Top 10 Cities with the Highest Percentage of Immigrants from Sri Lanka in California are:
#1
4.36%
#2
1.23%
#3
0.94%
#4
0.44%
#5
0.41%
#6
0.38%
#7
0.36%
#8
0.34%
#9
0.31%
#10
0.28%
What city has the Highest Percentage of Immigrants from Sri Lanka in California?
Del Rio has the Highest Percentage of Immigrants from Sri Lanka in California with 4.36%.
What is the Percentage of Immigrants from Sri Lanka in the State of California?
Percentage of Immigrants from Sri Lanka in California is 0.029%.
What is the Percentage of Immigrants from Sri Lanka in the United States?
Percentage of Immigrants from Sri Lanka in the United States is 0.017%.