Santa Susana, CA Map & Demographics
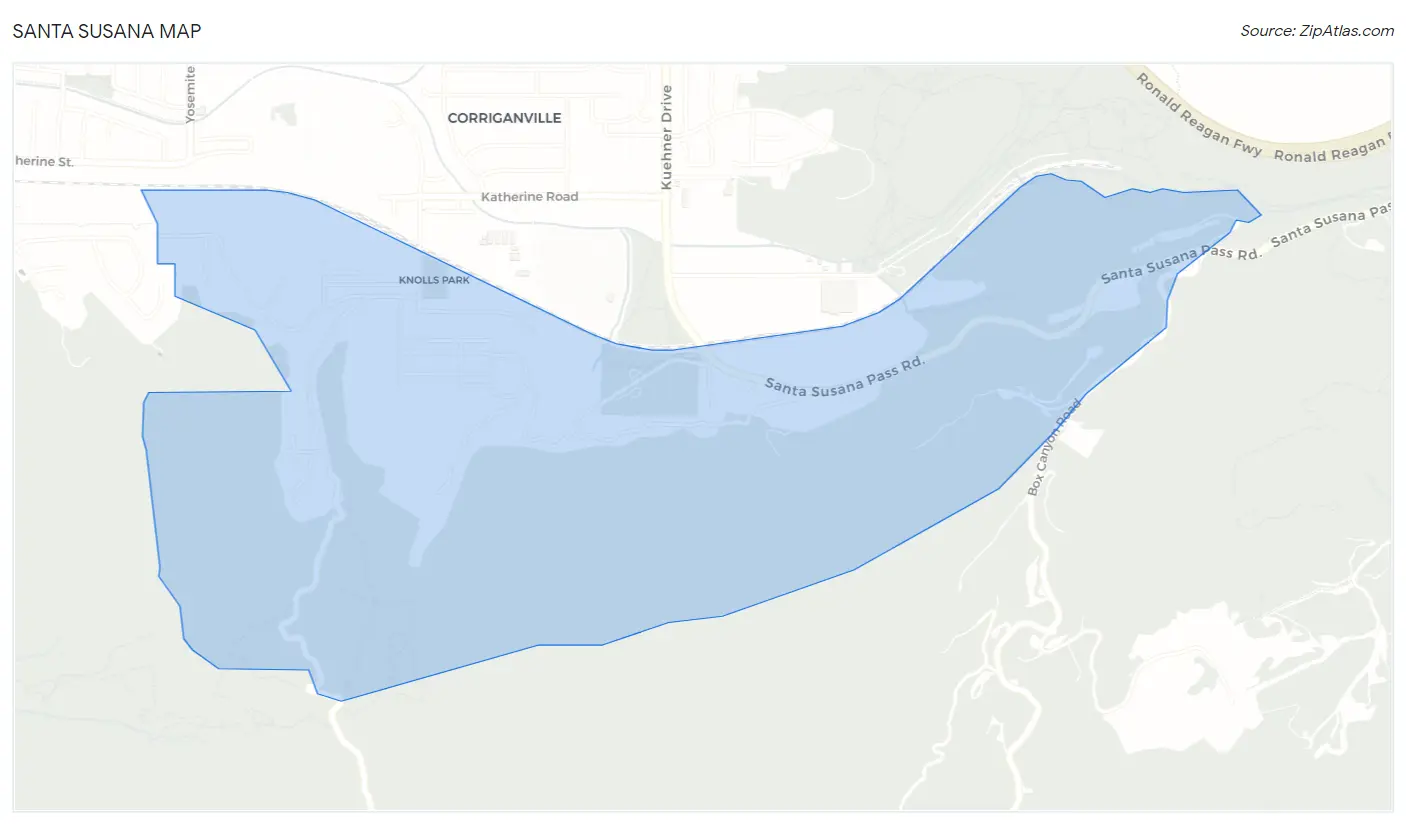
Santa Susana Map
Santa Susana Overview
$57,937
PER CAPITA INCOME
44.1%
WAGE / INCOME GAP [ % ]
55.9¢/ $1
WAGE / INCOME GAP [ $ ]
0.51
INEQUALITY / GINI INDEX
1,132
TOTAL POPULATION
569
MALE POPULATION
563
FEMALE POPULATION
101.07
MALES / 100 FEMALES
98.95
FEMALES / 100 MALES
45.5
MEDIAN AGE
3.5
AVG FAMILY SIZE
2.5
AVG HOUSEHOLD SIZE
638
LABOR FORCE [ PEOPLE ]
75.7%
PERCENT IN LABOR FORCE
9.6%
UNEMPLOYMENT RATE
Santa Susana Area Codes
Income in Santa Susana
Income Overview in Santa Susana
| Characteristic | Number | Measure |
| Per Capita Income | 1,132 | $57,937 |
| Median Family Income | 239 | $0 |
| Mean Family Income | 239 | $102,097 |
| Median Household Income | 449 | $0 |
| Mean Household Income | 449 | $143,802 |
| Income Deficit | 239 | $0 |
| Wage / Income Gap (%) | 1,132 | 44.06% |
| Wage / Income Gap ($) | 1,132 | 55.94¢ per $1 |
| Gini / Inequality Index | 1,132 | 0.51 |
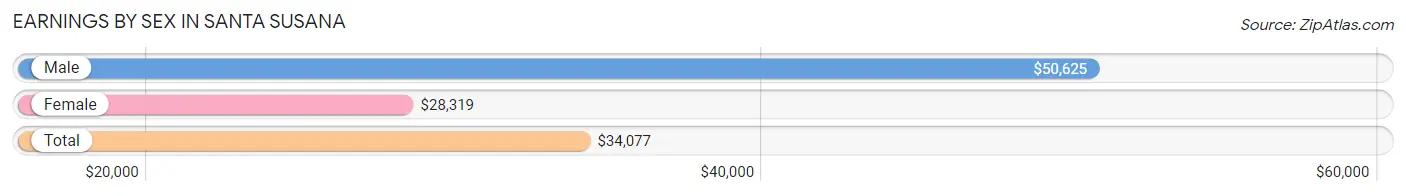
Earnings by Sex in Santa Susana
Average Earnings in Santa Susana are $34,077, $50,625 for men and $28,319 for women, a difference of 44.1%.
| Sex | Number | Average Earnings |
| Male | 351 (52.2%) | $50,625 |
| Female | 321 (47.8%) | $28,319 |
| Total | 672 (100.0%) | $34,077 |
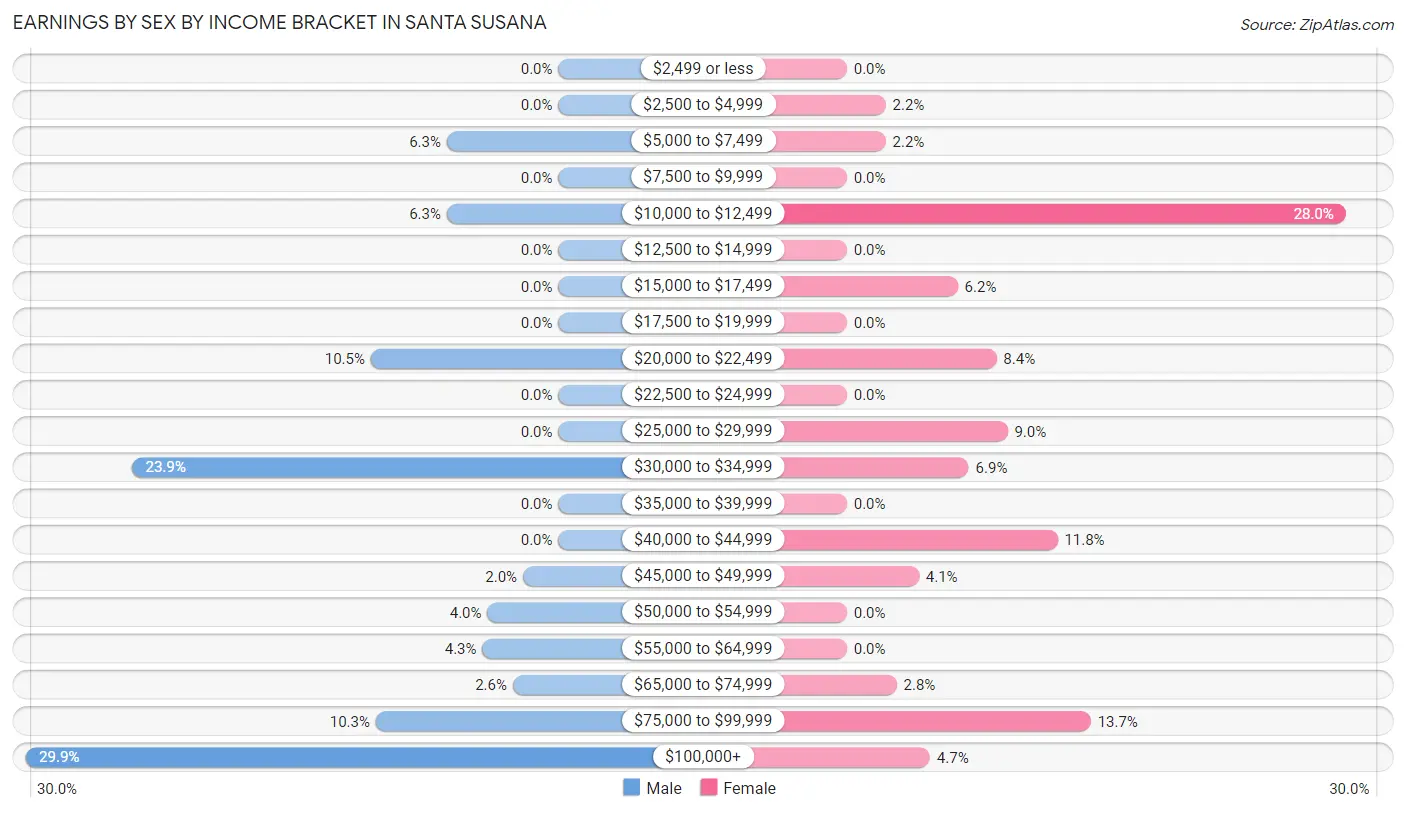
Earnings by Sex by Income Bracket in Santa Susana
The most common earnings brackets in Santa Susana are $100,000+ for men (105 | 29.9%) and $10,000 to $12,499 for women (90 | 28.0%).
| Income | Male | Female |
| $2,499 or less | 0 (0.0%) | 0 (0.0%) |
| $2,500 to $4,999 | 0 (0.0%) | 7 (2.2%) |
| $5,000 to $7,499 | 22 (6.3%) | 7 (2.2%) |
| $7,500 to $9,999 | 0 (0.0%) | 0 (0.0%) |
| $10,000 to $12,499 | 22 (6.3%) | 90 (28.0%) |
| $12,500 to $14,999 | 0 (0.0%) | 0 (0.0%) |
| $15,000 to $17,499 | 0 (0.0%) | 20 (6.2%) |
| $17,500 to $19,999 | 0 (0.0%) | 0 (0.0%) |
| $20,000 to $22,499 | 37 (10.5%) | 27 (8.4%) |
| $22,500 to $24,999 | 0 (0.0%) | 0 (0.0%) |
| $25,000 to $29,999 | 0 (0.0%) | 29 (9.0%) |
| $30,000 to $34,999 | 84 (23.9%) | 22 (6.9%) |
| $35,000 to $39,999 | 0 (0.0%) | 0 (0.0%) |
| $40,000 to $44,999 | 0 (0.0%) | 38 (11.8%) |
| $45,000 to $49,999 | 7 (2.0%) | 13 (4.1%) |
| $50,000 to $54,999 | 14 (4.0%) | 0 (0.0%) |
| $55,000 to $64,999 | 15 (4.3%) | 0 (0.0%) |
| $65,000 to $74,999 | 9 (2.6%) | 9 (2.8%) |
| $75,000 to $99,999 | 36 (10.3%) | 44 (13.7%) |
| $100,000+ | 105 (29.9%) | 15 (4.7%) |
| Total | 351 (100.0%) | 321 (100.0%) |
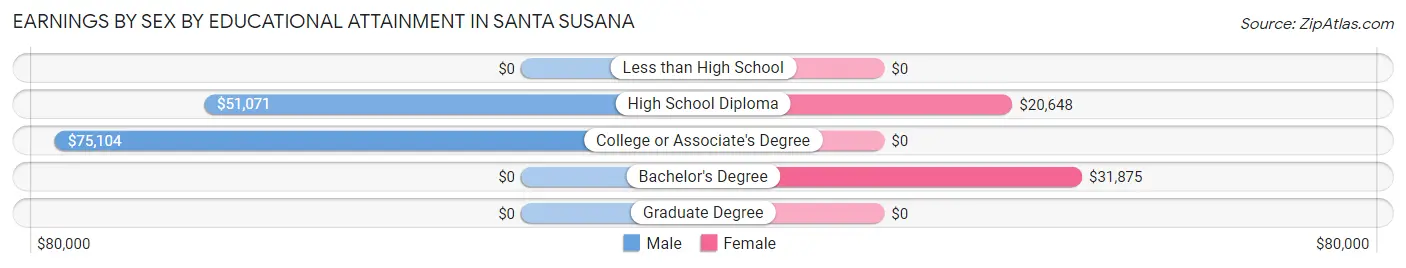
Earnings by Sex by Educational Attainment in Santa Susana
Average earnings in Santa Susana are $51,696 for men and $29,483 for women, a difference of 43.0%. Men with an educational attainment of college or associate's degree enjoy the highest average annual earnings of $75,104, while those with high school diploma education earn the least with $51,071. Women with an educational attainment of bachelor's degree earn the most with the average annual earnings of $31,875, while those with high school diploma education have the smallest earnings of $20,648.
| Educational Attainment | Male Income | Female Income |
| Less than High School | - | - |
| High School Diploma | $51,071 | $20,648 |
| College or Associate's Degree | $75,104 | $0 |
| Bachelor's Degree | - | - |
| Graduate Degree | - | - |
| Total | $51,696 | $29,483 |
Family Income in Santa Susana
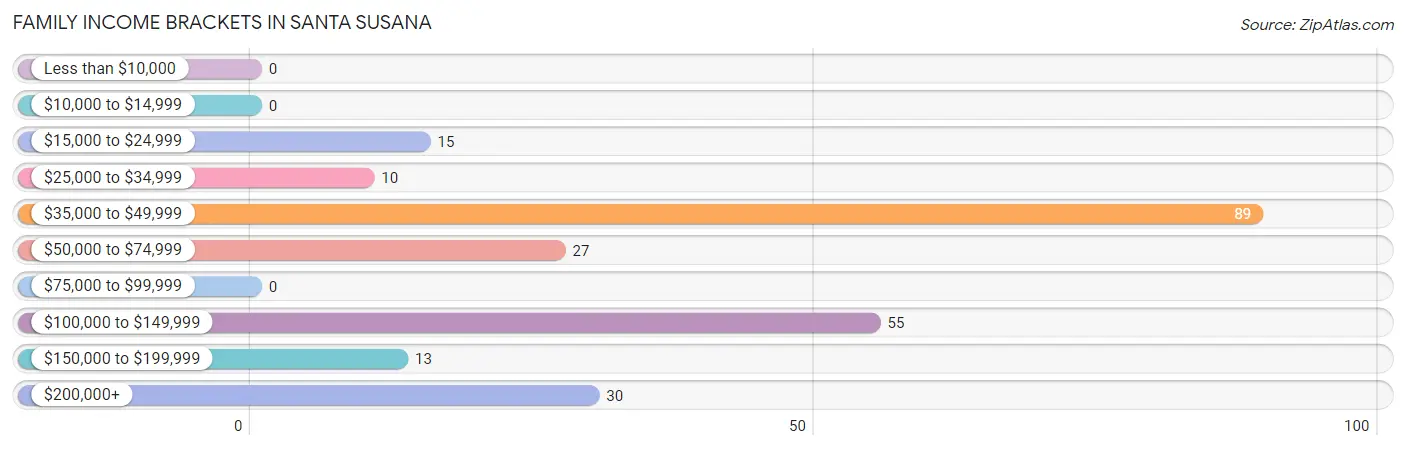
Family Income Brackets in Santa Susana
According to the Santa Susana family income data, there are 89 families falling into the $35,000 to $49,999 income range, which is the most common income bracket and makes up 37.2% of all families.
| Income Bracket | # Families | % Families |
| Less than $10,000 | 0 | 0.0% |
| $10,000 to $14,999 | 0 | 0.0% |
| $15,000 to $24,999 | 15 | 6.3% |
| $25,000 to $34,999 | 10 | 4.2% |
| $35,000 to $49,999 | 89 | 37.2% |
| $50,000 to $74,999 | 27 | 11.3% |
| $75,000 to $99,999 | 0 | 0.0% |
| $100,000 to $149,999 | 55 | 23.0% |
| $150,000 to $199,999 | 13 | 5.4% |
| $200,000+ | 30 | 12.6% |
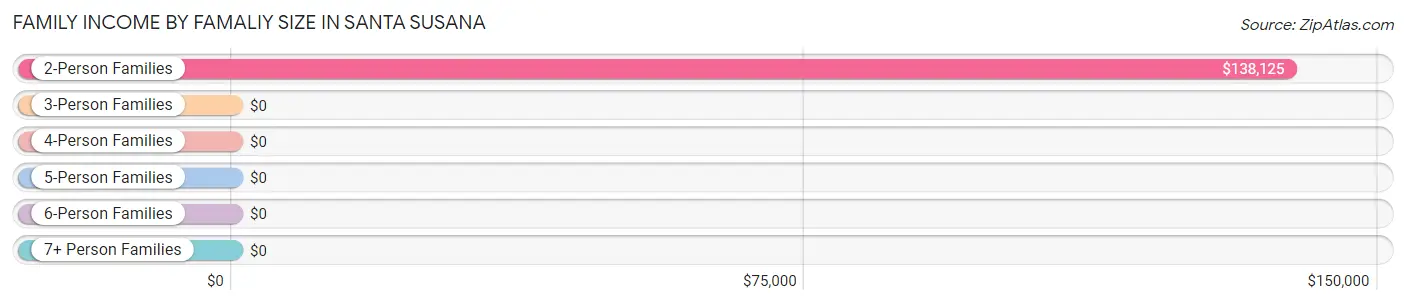
Family Income by Famaliy Size in Santa Susana
2-person families (71 | 29.7%) account for the highest median family income in Santa Susana with $138,125 per family, while 2-person families (71 | 29.7%) have the highest median income of $69,062 per family member.
| Income Bracket | # Families | Median Income |
| 2-Person Families | 71 (29.7%) | $138,125 |
| 3-Person Families | 76 (31.8%) | $0 |
| 4-Person Families | 75 (31.4%) | $0 |
| 5-Person Families | 0 (0.0%) | $0 |
| 6-Person Families | 17 (7.1%) | $0 |
| 7+ Person Families | 0 (0.0%) | $0 |
| Total | 239 (100.0%) | $0 |
Family Income by Number of Earners in Santa Susana
| Number of Earners | # Families | Median Income |
| No Earners | 23 (9.6%) | $0 |
| 1 Earner | 39 (16.3%) | $0 |
| 2 Earners | 153 (64.0%) | $0 |
| 3+ Earners | 24 (10.0%) | $0 |
| Total | 239 (100.0%) | $0 |
Household Income in Santa Susana
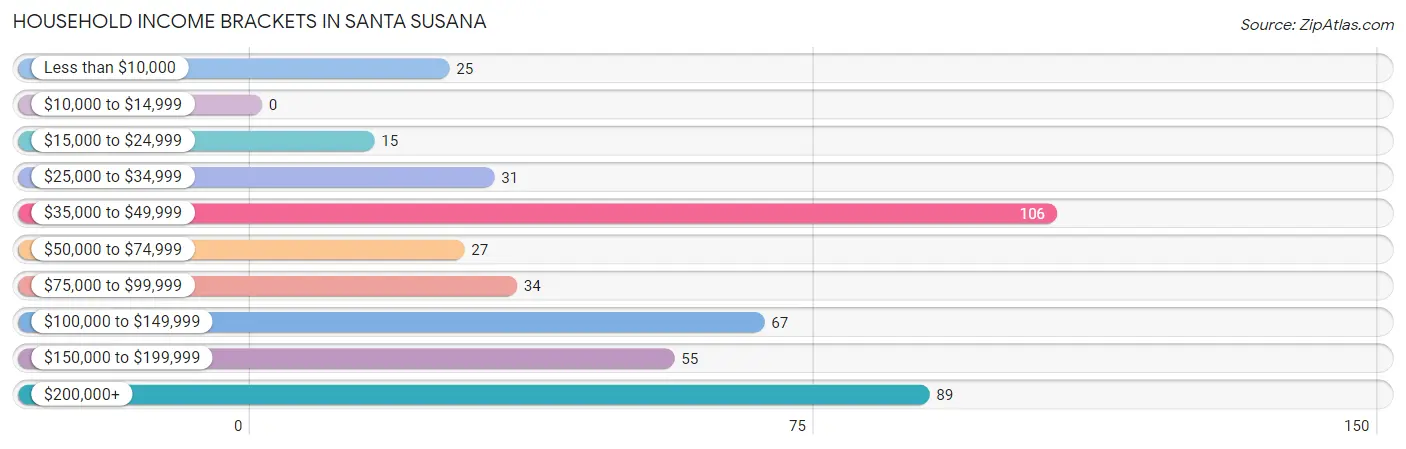
Household Income Brackets in Santa Susana
With 106 households falling in the category, the $35,000 to $49,999 income range is the most frequent in Santa Susana, accounting for 23.6% of all households.
| Income Bracket | # Households | % Households |
| Less than $10,000 | 25 | 5.6% |
| $10,000 to $14,999 | 0 | 0.0% |
| $15,000 to $24,999 | 15 | 3.3% |
| $25,000 to $34,999 | 31 | 6.9% |
| $35,000 to $49,999 | 106 | 23.6% |
| $50,000 to $74,999 | 27 | 6.0% |
| $75,000 to $99,999 | 34 | 7.6% |
| $100,000 to $149,999 | 67 | 14.9% |
| $150,000 to $199,999 | 55 | 12.2% |
| $200,000+ | 89 | 19.8% |
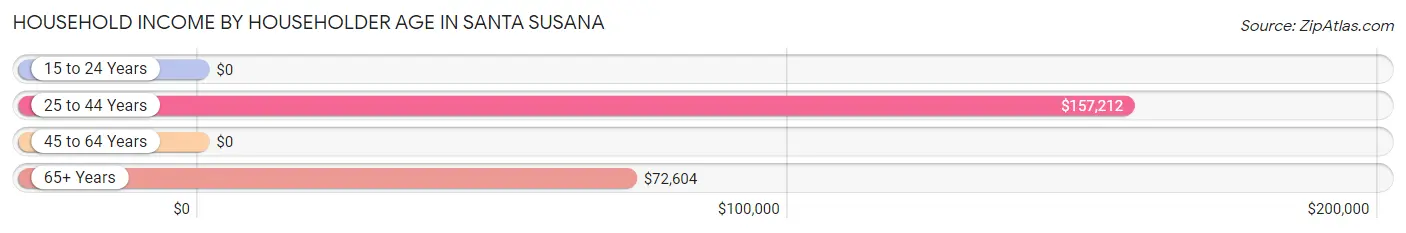
Household Income by Householder Age in Santa Susana
The median household income in Santa Susana is $0, with the highest median household income of $157,212 found in the 25 to 44 years age bracket for the primary householder. A total of 61 households (13.6%) fall into this category.
| Income Bracket | # Households | Median Income |
| 15 to 24 Years | 0 (0.0%) | $0 |
| 25 to 44 Years | 61 (13.6%) | $157,212 |
| 45 to 64 Years | 265 (59.0%) | $0 |
| 65+ Years | 123 (27.4%) | $72,604 |
| Total | 449 (100.0%) | $0 |
Poverty in Santa Susana
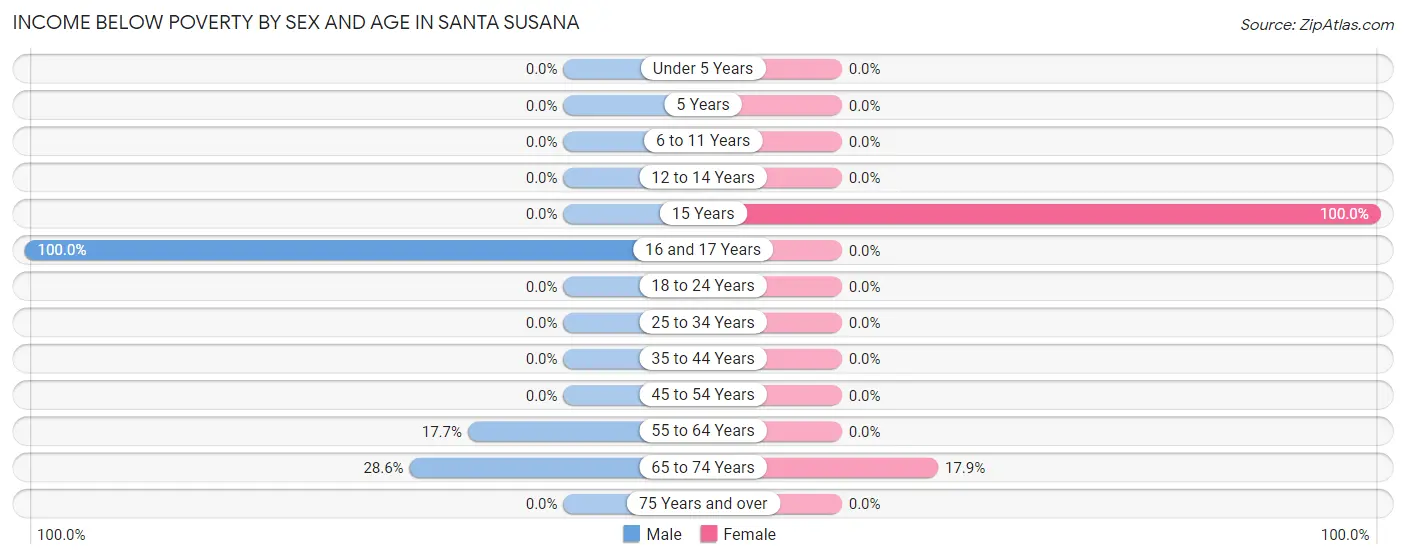
Income Below Poverty by Sex and Age in Santa Susana
With 8.5% poverty level for males and 5.9% for females among the residents of Santa Susana, 16 and 17 year old males and 15 year old females are the most vulnerable to poverty, with 7 males (100.0%) and 18 females (100.0%) in their respective age groups living below the poverty level.
| Age Bracket | Male | Female |
| Under 5 Years | 0 (0.0%) | 0 (0.0%) |
| 5 Years | 0 (0.0%) | 0 (0.0%) |
| 6 to 11 Years | 0 (0.0%) | 0 (0.0%) |
| 12 to 14 Years | 0 (0.0%) | 0 (0.0%) |
| 15 Years | 0 (0.0%) | 18 (100.0%) |
| 16 and 17 Years | 7 (100.0%) | 0 (0.0%) |
| 18 to 24 Years | 0 (0.0%) | 0 (0.0%) |
| 25 to 34 Years | 0 (0.0%) | 0 (0.0%) |
| 35 to 44 Years | 0 (0.0%) | 0 (0.0%) |
| 45 to 54 Years | 0 (0.0%) | 0 (0.0%) |
| 55 to 64 Years | 25 (17.7%) | 0 (0.0%) |
| 65 to 74 Years | 16 (28.6%) | 15 (17.9%) |
| 75 Years and over | 0 (0.0%) | 0 (0.0%) |
| Total | 48 (8.5%) | 33 (5.9%) |
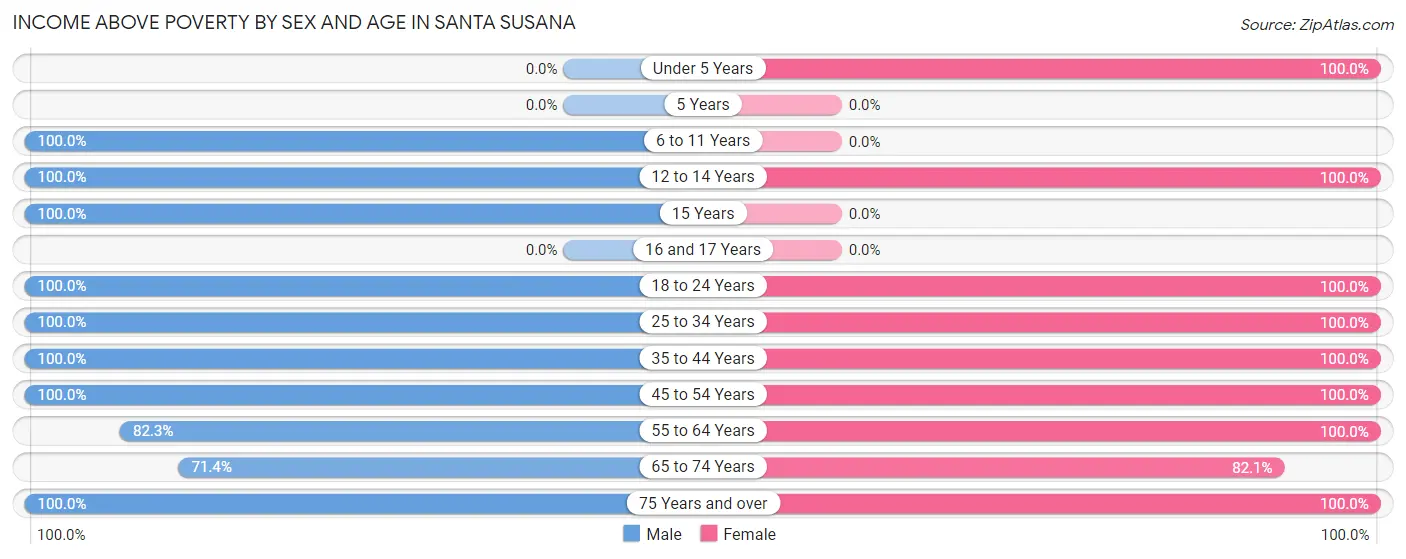
Income Above Poverty by Sex and Age in Santa Susana
According to the poverty statistics in Santa Susana, males aged 6 to 11 years and females aged under 5 years are the age groups that are most secure financially, with 100.0% of males and 100.0% of females in these age groups living above the poverty line.
| Age Bracket | Male | Female |
| Under 5 Years | 0 (0.0%) | 17 (100.0%) |
| 5 Years | 0 (0.0%) | 0 (0.0%) |
| 6 to 11 Years | 75 (100.0%) | 0 (0.0%) |
| 12 to 14 Years | 50 (100.0%) | 116 (100.0%) |
| 15 Years | 13 (100.0%) | 0 (0.0%) |
| 16 and 17 Years | 0 (0.0%) | 0 (0.0%) |
| 18 to 24 Years | 12 (100.0%) | 56 (100.0%) |
| 25 to 34 Years | 67 (100.0%) | 91 (100.0%) |
| 35 to 44 Years | 19 (100.0%) | 9 (100.0%) |
| 45 to 54 Years | 103 (100.0%) | 141 (100.0%) |
| 55 to 64 Years | 116 (82.3%) | 13 (100.0%) |
| 65 to 74 Years | 40 (71.4%) | 69 (82.1%) |
| 75 Years and over | 23 (100.0%) | 18 (100.0%) |
| Total | 518 (91.5%) | 530 (94.1%) |
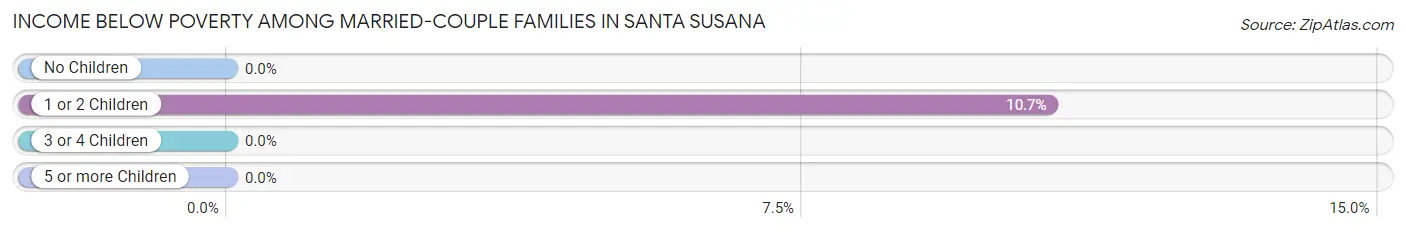
Income Below Poverty Among Married-Couple Families in Santa Susana
The poverty statistics for married-couple families in Santa Susana show that 7.4% or 15 of the total 202 families live below the poverty line. Families with 1 or 2 children have the highest poverty rate of 10.7%, comprising of 15 families. On the other hand, families with no children have the lowest poverty rate of 0.0%, which includes 0 families.
| Children | Above Poverty | Below Poverty |
| No Children | 62 (100.0%) | 0 (0.0%) |
| 1 or 2 Children | 125 (89.3%) | 15 (10.7%) |
| 3 or 4 Children | 0 (0.0%) | 0 (0.0%) |
| 5 or more Children | 0 (0.0%) | 0 (0.0%) |
| Total | 187 (92.6%) | 15 (7.4%) |
Income Below Poverty Among Single-Parent Households in Santa Susana
| Children | Single Father | Single Mother |
| No Children | 0 (0.0%) | 0 (0.0%) |
| 1 or 2 Children | 0 (0.0%) | 0 (0.0%) |
| 3 or 4 Children | 0 (0.0%) | 0 (0.0%) |
| 5 or more Children | 0 (0.0%) | 0 (0.0%) |
| Total | 0 (0.0%) | 0 (0.0%) |
Income Below Poverty Among Married-Couple vs Single-Parent Households in Santa Susana
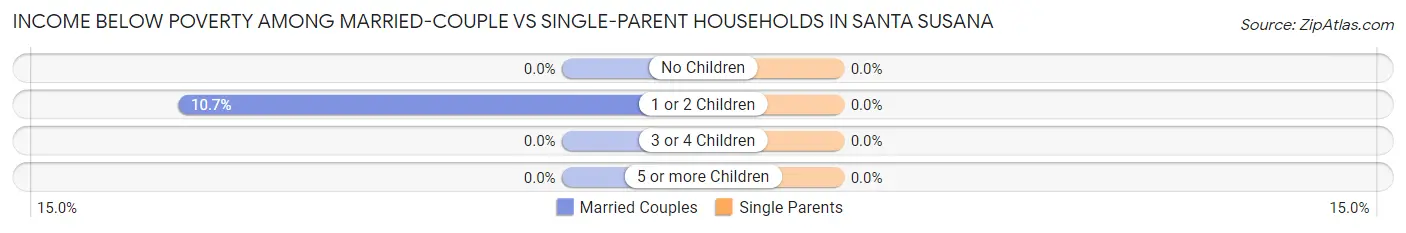
| Children | Married-Couple Families | Single-Parent Households |
| No Children | 0 (0.0%) | 0 (0.0%) |
| 1 or 2 Children | 15 (10.7%) | 0 (0.0%) |
| 3 or 4 Children | 0 (0.0%) | 0 (0.0%) |
| 5 or more Children | 0 (0.0%) | 0 (0.0%) |
| Total | 15 (7.4%) | 0 (0.0%) |
Race in Santa Susana
The most populous races in Santa Susana are White / Caucasian (1,041 | 92.0%), Hispanic or Latino (219 | 19.4%), and Some other Race (56 | 5.0%).
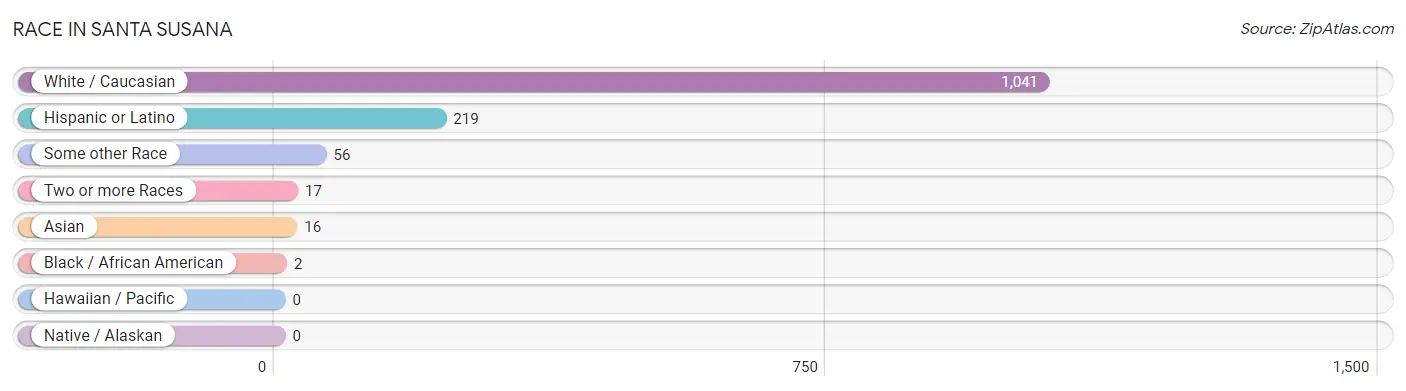
| Race | # Population | % Population |
| Asian | 16 | 1.4% |
| Black / African American | 2 | 0.2% |
| Hawaiian / Pacific | 0 | 0.0% |
| Hispanic or Latino | 219 | 19.4% |
| Native / Alaskan | 0 | 0.0% |
| White / Caucasian | 1,041 | 92.0% |
| Two or more Races | 17 | 1.5% |
| Some other Race | 56 | 5.0% |
| Total | 1,132 | 100.0% |
Ancestry in Santa Susana
The most populous ancestries reported in Santa Susana are English (241 | 21.3%), German (183 | 16.2%), Central American (128 | 11.3%), Irish (126 | 11.1%), and Costa Rican (114 | 10.1%), together accounting for 70.0% of all Santa Susana residents.
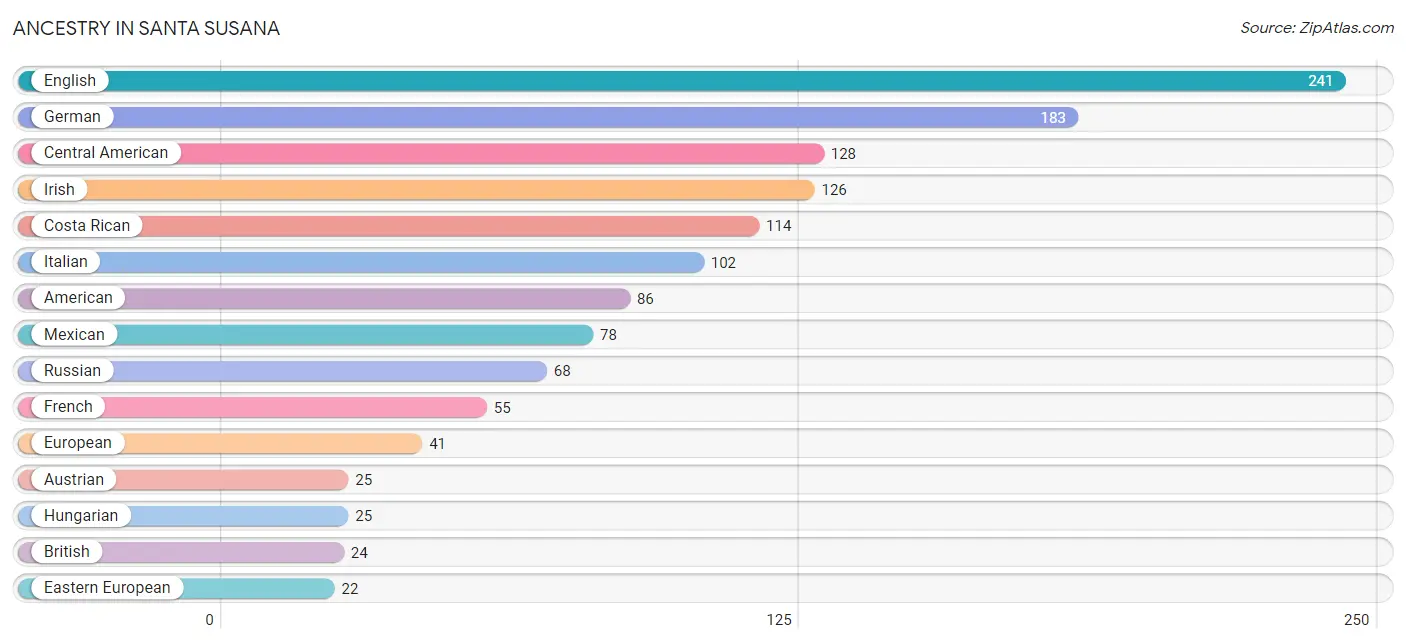
| Ancestry | # Population | % Population |
| American | 86 | 7.6% |
| Austrian | 25 | 2.2% |
| Bhutanese | 9 | 0.8% |
| British | 24 | 2.1% |
| Central American | 128 | 11.3% |
| Cherokee | 8 | 0.7% |
| Costa Rican | 114 | 10.1% |
| Czech | 13 | 1.1% |
| Eastern European | 22 | 1.9% |
| English | 241 | 21.3% |
| European | 41 | 3.6% |
| French | 55 | 4.9% |
| German | 183 | 16.2% |
| Honduran | 14 | 1.2% |
| Hungarian | 25 | 2.2% |
| Indian (Asian) | 16 | 1.4% |
| Irish | 126 | 11.1% |
| Italian | 102 | 9.0% |
| Mexican | 78 | 6.9% |
| Norwegian | 17 | 1.5% |
| Polish | 22 | 1.9% |
| Romanian | 13 | 1.1% |
| Russian | 68 | 6.0% |
| Swedish | 10 | 0.9% | View All 24 Rows |
Immigrants in Santa Susana
The most numerous immigrant groups reported in Santa Susana came from Central America (82 | 7.2%), Latin America (82 | 7.2%), Europe (50 | 4.4%), Asia (48 | 4.2%), and Costa Rica (39 | 3.5%), together accounting for 26.6% of all Santa Susana residents.
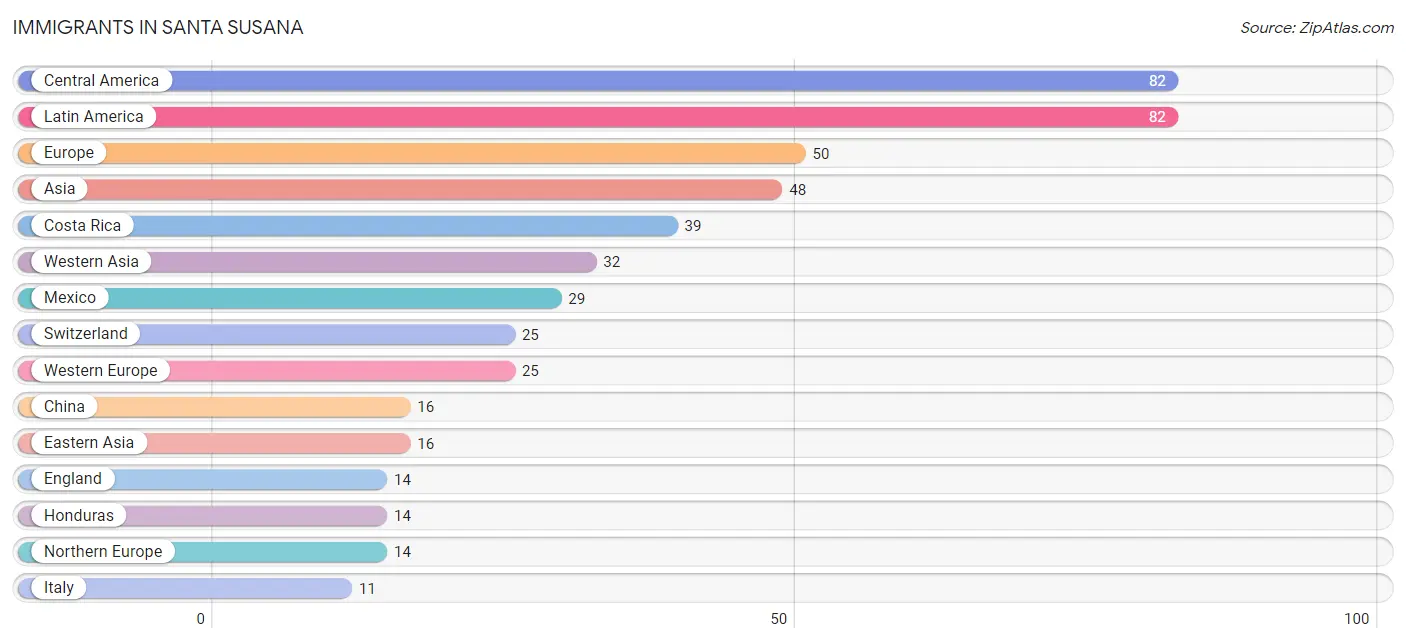
| Immigration Origin | # Population | % Population |
| Asia | 48 | 4.2% |
| Central America | 82 | 7.2% |
| China | 16 | 1.4% |
| Costa Rica | 39 | 3.5% |
| Eastern Asia | 16 | 1.4% |
| England | 14 | 1.2% |
| Europe | 50 | 4.4% |
| Honduras | 14 | 1.2% |
| Italy | 11 | 1.0% |
| Latin America | 82 | 7.2% |
| Mexico | 29 | 2.6% |
| Northern Europe | 14 | 1.2% |
| Southern Europe | 11 | 1.0% |
| Switzerland | 25 | 2.2% |
| Western Asia | 32 | 2.8% |
| Western Europe | 25 | 2.2% | View All 16 Rows |
Sex and Age in Santa Susana
Sex and Age in Santa Susana
The most populous age groups in Santa Susana are 45 to 49 Years (96 | 16.9%) for men and 10 to 14 Years (116 | 20.6%) for women.
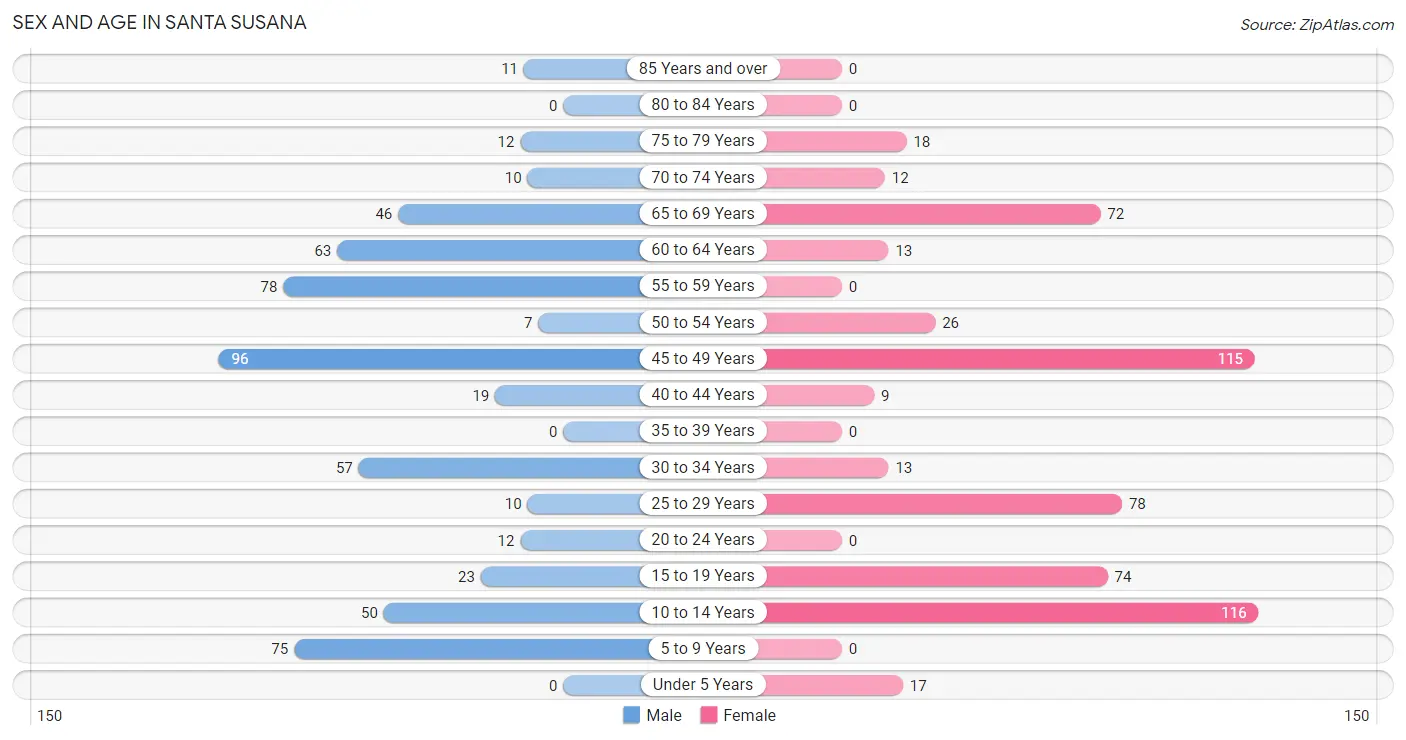
| Age Bracket | Male | Female |
| Under 5 Years | 0 (0.0%) | 17 (3.0%) |
| 5 to 9 Years | 75 (13.2%) | 0 (0.0%) |
| 10 to 14 Years | 50 (8.8%) | 116 (20.6%) |
| 15 to 19 Years | 23 (4.0%) | 74 (13.1%) |
| 20 to 24 Years | 12 (2.1%) | 0 (0.0%) |
| 25 to 29 Years | 10 (1.8%) | 78 (13.9%) |
| 30 to 34 Years | 57 (10.0%) | 13 (2.3%) |
| 35 to 39 Years | 0 (0.0%) | 0 (0.0%) |
| 40 to 44 Years | 19 (3.3%) | 9 (1.6%) |
| 45 to 49 Years | 96 (16.9%) | 115 (20.4%) |
| 50 to 54 Years | 7 (1.2%) | 26 (4.6%) |
| 55 to 59 Years | 78 (13.7%) | 0 (0.0%) |
| 60 to 64 Years | 63 (11.1%) | 13 (2.3%) |
| 65 to 69 Years | 46 (8.1%) | 72 (12.8%) |
| 70 to 74 Years | 10 (1.8%) | 12 (2.1%) |
| 75 to 79 Years | 12 (2.1%) | 18 (3.2%) |
| 80 to 84 Years | 0 (0.0%) | 0 (0.0%) |
| 85 Years and over | 11 (1.9%) | 0 (0.0%) |
| Total | 569 (100.0%) | 563 (100.0%) |
Families and Households in Santa Susana
Median Family Size in Santa Susana
The median family size in Santa Susana is 3.47 persons per family, with married-couple families (202 | 84.5%) accounting for the largest median family size of 3.59 persons per family. On the other hand, single male/father families (10 | 4.2%) represent the smallest median family size with 2.20 persons per family.
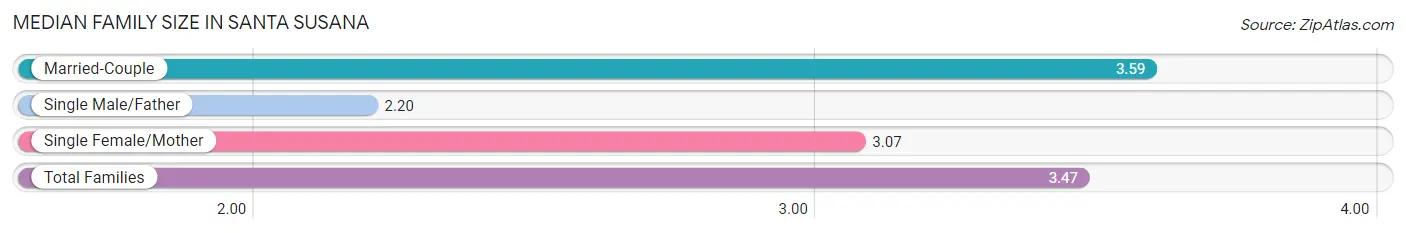
| Family Type | # Families | Family Size |
| Married-Couple | 202 (84.5%) | 3.59 |
| Single Male/Father | 10 (4.2%) | 2.20 |
| Single Female/Mother | 27 (11.3%) | 3.07 |
| Total Families | 239 (100.0%) | 3.47 |
Median Household Size in Santa Susana
The median household size in Santa Susana is 2.51 persons per household, with married-couple households (202 | 45.0%) accounting for the largest median household size of 3.84 persons per household. non-family households (210 | 46.8%) represent the smallest median household size with 1.19 persons per household.
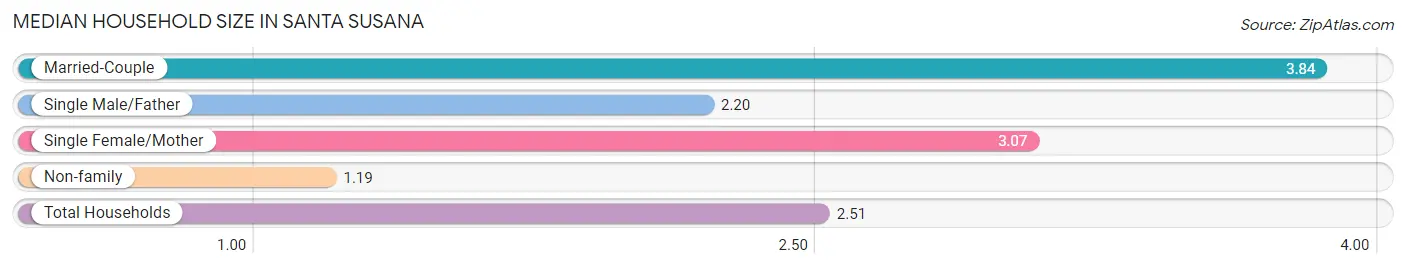
| Household Type | # Households | Household Size |
| Married-Couple | 202 (45.0%) | 3.84 |
| Single Male/Father | 10 (2.2%) | 2.20 |
| Single Female/Mother | 27 (6.0%) | 3.07 |
| Non-family | 210 (46.8%) | 1.19 |
| Total Households | 449 (100.0%) | 2.51 |
Household Size by Marriage Status in Santa Susana
Out of a total of 449 households in Santa Susana, 239 (53.2%) are family households, while 210 (46.8%) are nonfamily households. The most numerous type of family households are 4-person households, comprising 75, and the most common type of nonfamily households are 1-person households, comprising 178.
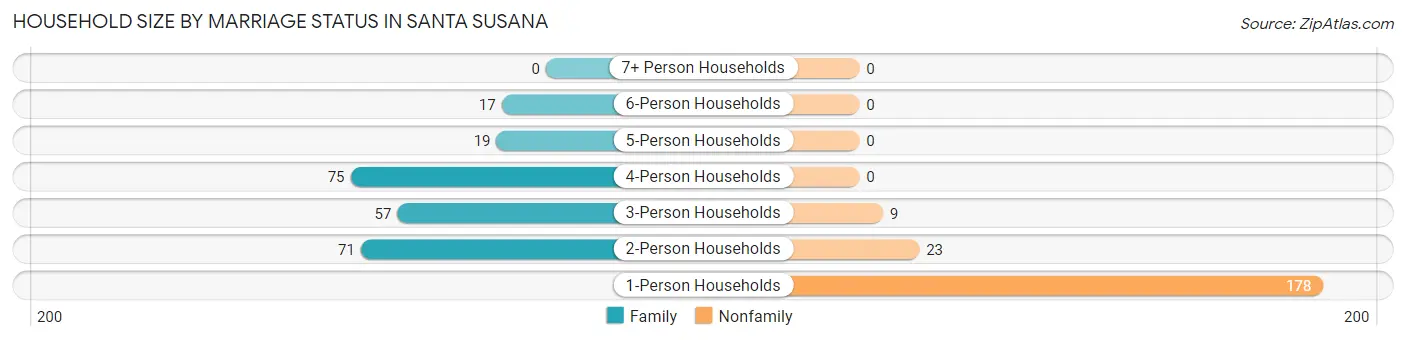
| Household Size | Family Households | Nonfamily Households |
| 1-Person Households | - | 178 (39.6%) |
| 2-Person Households | 71 (15.8%) | 23 (5.1%) |
| 3-Person Households | 57 (12.7%) | 9 (2.0%) |
| 4-Person Households | 75 (16.7%) | 0 (0.0%) |
| 5-Person Households | 19 (4.2%) | 0 (0.0%) |
| 6-Person Households | 17 (3.8%) | 0 (0.0%) |
| 7+ Person Households | 0 (0.0%) | 0 (0.0%) |
| Total | 239 (53.2%) | 210 (46.8%) |
Female Fertility in Santa Susana
Fertility by Age in Santa Susana
Average fertility rate in Santa Susana is 76.0 births per 1,000 women. Women in the age bracket of 20 to 34 years have the highest fertility rate with 242.0 births per 1,000 women. Women in the age bracket of 20 to 34 years acount for 100.0% of all women with births.
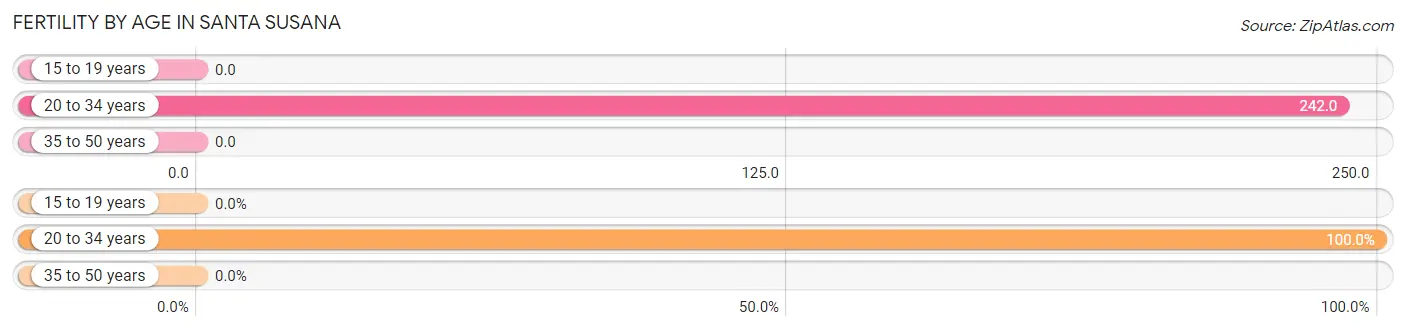
| Age Bracket | Women with Births | Births / 1,000 Women |
| 15 to 19 years | 0 (0.0%) | 0.0 |
| 20 to 34 years | 22 (100.0%) | 242.0 |
| 35 to 50 years | 0 (0.0%) | 0.0 |
| Total | 22 (100.0%) | 76.0 |
Fertility by Age by Marriage Status in Santa Susana
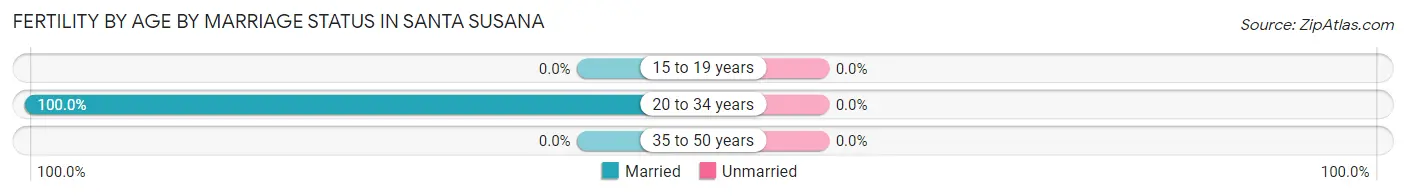
| Age Bracket | Married | Unmarried |
| 15 to 19 years | 0 (0.0%) | 0 (0.0%) |
| 20 to 34 years | 22 (100.0%) | 0 (0.0%) |
| 35 to 50 years | 0 (0.0%) | 0 (0.0%) |
| Total | 22 (100.0%) | 0 (0.0%) |
Fertility by Education in Santa Susana
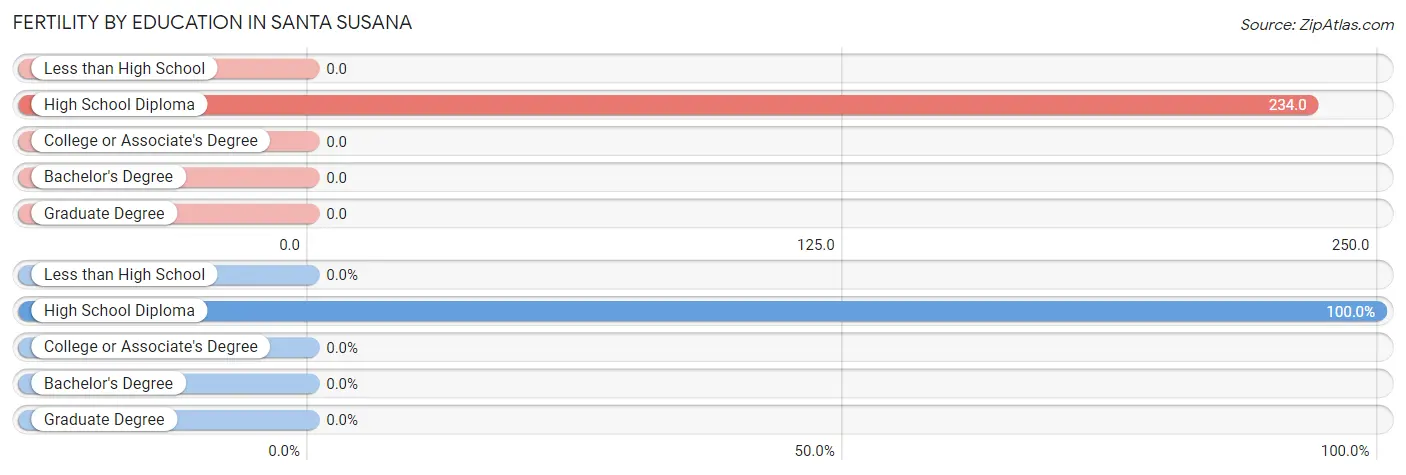
| Educational Attainment | Women with Births | Births / 1,000 Women |
| Less than High School | 0 (0.0%) | 0.0 |
| High School Diploma | 22 (100.0%) | 234.0 |
| College or Associate's Degree | 0 (0.0%) | 0.0 |
| Bachelor's Degree | 0 (0.0%) | 0.0 |
| Graduate Degree | 0 (0.0%) | 0.0 |
| Total | 22 (100.0%) | 76.0 |
Fertility by Education by Marriage Status in Santa Susana
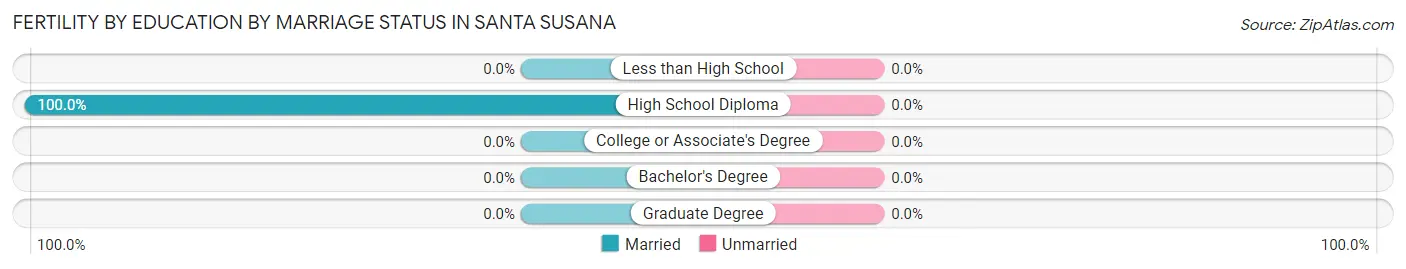
| Educational Attainment | Married | Unmarried |
| Less than High School | 0 (0.0%) | 0 (0.0%) |
| High School Diploma | 22 (100.0%) | 0 (0.0%) |
| College or Associate's Degree | 0 (0.0%) | 0 (0.0%) |
| Bachelor's Degree | 0 (0.0%) | 0 (0.0%) |
| Graduate Degree | 0 (0.0%) | 0 (0.0%) |
| Total | 22 (100.0%) | 0 (0.0%) |
Employment Characteristics in Santa Susana
Employment by Class of Employer in Santa Susana
Among the 577 employed individuals in Santa Susana, private company employees (367 | 63.6%), self-employed (not incorporated) (68 | 11.8%), and local government employees (68 | 11.8%) make up the most common classes of employment.
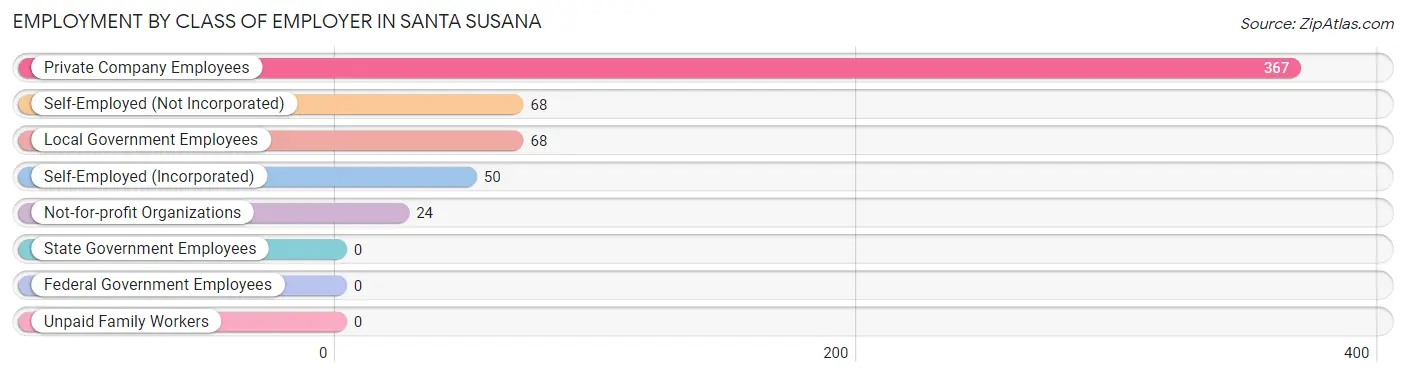
| Employer Class | # Employees | % Employees |
| Private Company Employees | 367 | 63.6% |
| Self-Employed (Incorporated) | 50 | 8.7% |
| Self-Employed (Not Incorporated) | 68 | 11.8% |
| Not-for-profit Organizations | 24 | 4.2% |
| Local Government Employees | 68 | 11.8% |
| State Government Employees | 0 | 0.0% |
| Federal Government Employees | 0 | 0.0% |
| Unpaid Family Workers | 0 | 0.0% |
| Total | 577 | 100.0% |
Employment Status by Age in Santa Susana
According to the labor force statistics for Santa Susana, out of the total population over 16 years of age (843), 75.7% or 638 individuals are in the labor force, with 9.6% or 61 of them unemployed. The age group with the highest labor force participation rate is 20 to 24 years, with 100.0% or 12 individuals in the labor force. Within the labor force, the 65 to 74 years age range has the highest percentage of unemployed individuals, with 100.0% or 8 of them being unemployed.
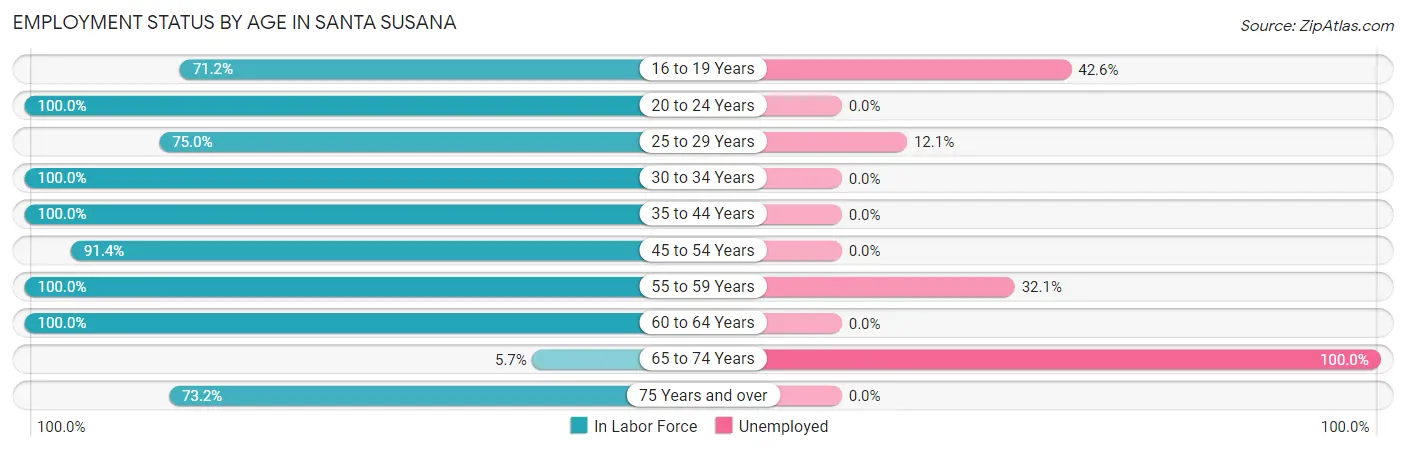
| Age Bracket | In Labor Force | Unemployed |
| 16 to 19 Years | 47 (71.2%) | 20 (42.6%) |
| 20 to 24 Years | 12 (100.0%) | 0 (0.0%) |
| 25 to 29 Years | 66 (75.0%) | 8 (12.1%) |
| 30 to 34 Years | 70 (100.0%) | 0 (0.0%) |
| 35 to 44 Years | 28 (100.0%) | 0 (0.0%) |
| 45 to 54 Years | 223 (91.4%) | 0 (0.0%) |
| 55 to 59 Years | 78 (100.0%) | 25 (32.1%) |
| 60 to 64 Years | 76 (100.0%) | 0 (0.0%) |
| 65 to 74 Years | 8 (5.7%) | 8 (100.0%) |
| 75 Years and over | 30 (73.2%) | 0 (0.0%) |
| Total | 638 (75.7%) | 61 (9.6%) |
Employment Status by Educational Attainment in Santa Susana
According to labor force statistics for Santa Susana, 92.6% of individuals (541) out of the total population between 25 and 64 years of age (584) are in the labor force, with 6.1% or 33 of them being unemployed. The group with the highest labor force participation rate are those with the educational attainment of less than high school, with 100.0% or 85 individuals in the labor force. Within the labor force, individuals with college / associate degree education have the highest percentage of unemployment, with 13.8% or 33 of them being unemployed.
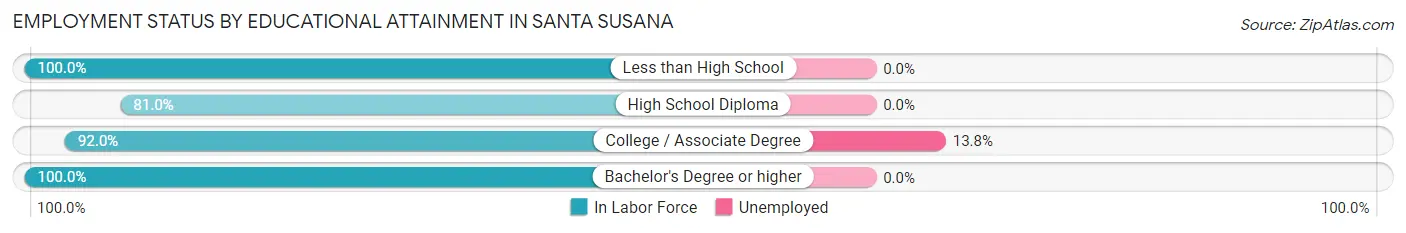
| Educational Attainment | In Labor Force | Unemployed |
| Less than High School | 85 (100.0%) | 0 (0.0%) |
| High School Diploma | 94 (81.0%) | 0 (0.0%) |
| College / Associate Degree | 240 (92.0%) | 36 (13.8%) |
| Bachelor's Degree or higher | 122 (100.0%) | 0 (0.0%) |
| Total | 541 (92.6%) | 36 (6.1%) |
Employment Occupations by Sex in Santa Susana
Management, Business, Science and Arts Occupations
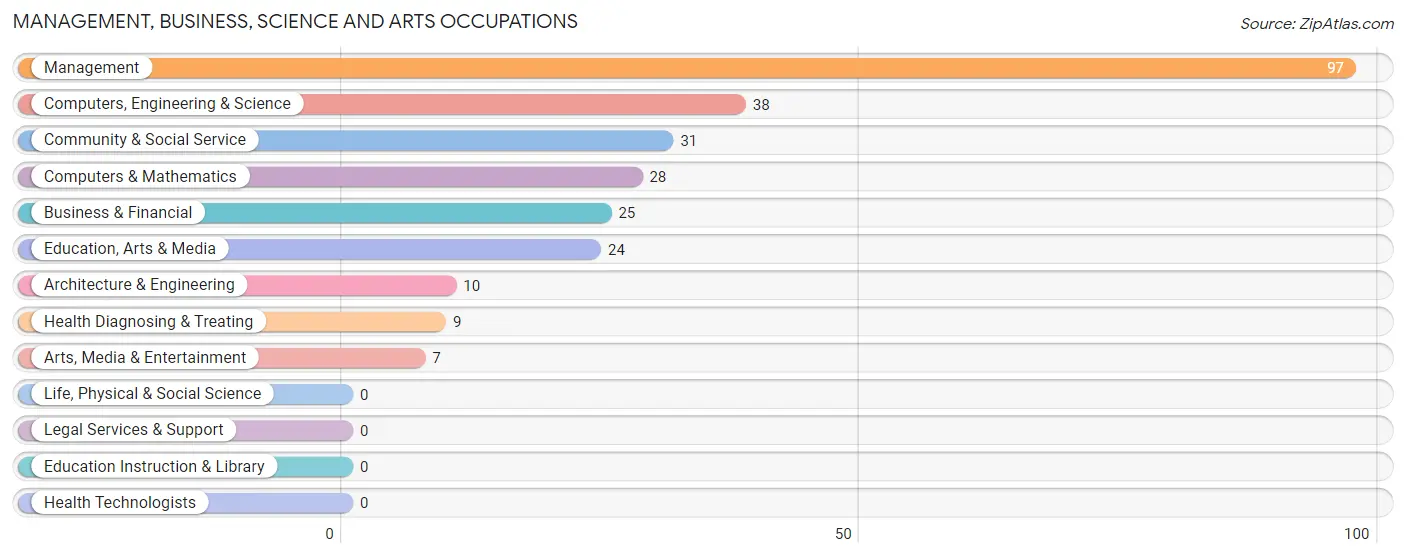
The most common Management, Business, Science and Arts occupations in Santa Susana are Management (97 | 16.8%), Computers, Engineering & Science (38 | 6.6%), Community & Social Service (31 | 5.4%), Computers & Mathematics (28 | 4.9%), and Business & Financial (25 | 4.3%).
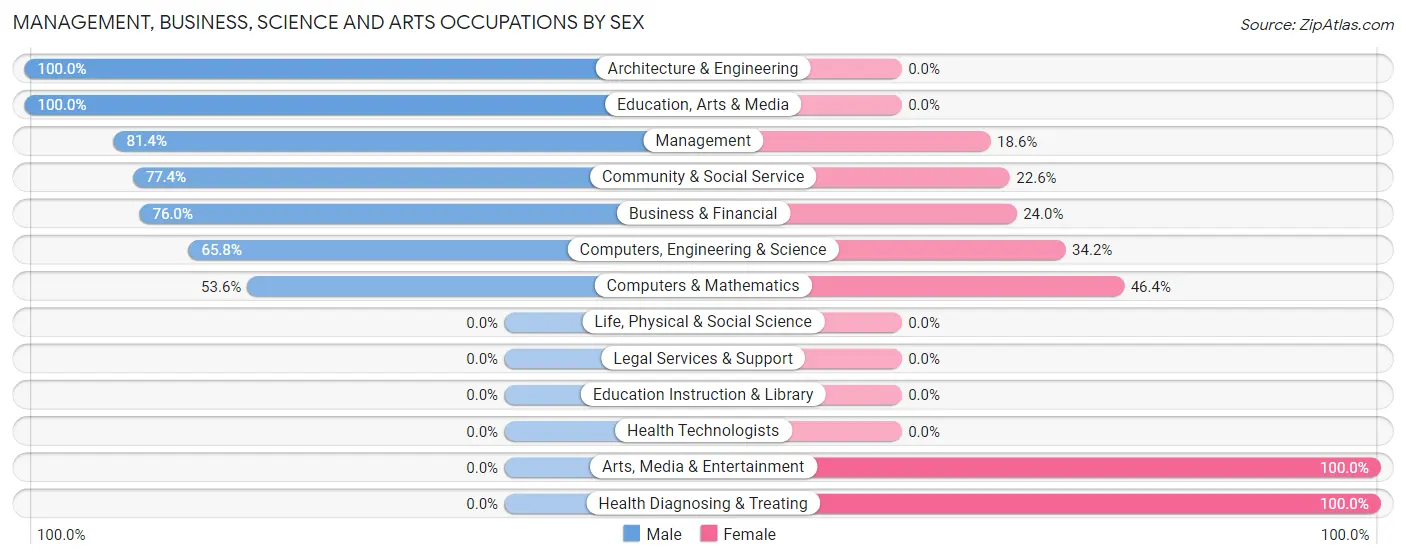
Management, Business, Science and Arts Occupations by Sex
Within the Management, Business, Science and Arts occupations in Santa Susana, the most male-oriented occupations are Architecture & Engineering (100.0%), Education, Arts & Media (100.0%), and Management (81.4%), while the most female-oriented occupations are Arts, Media & Entertainment (100.0%), Health Diagnosing & Treating (100.0%), and Computers & Mathematics (46.4%).
| Occupation | Male | Female |
| Management | 79 (81.4%) | 18 (18.6%) |
| Business & Financial | 19 (76.0%) | 6 (24.0%) |
| Computers, Engineering & Science | 25 (65.8%) | 13 (34.2%) |
| Computers & Mathematics | 15 (53.6%) | 13 (46.4%) |
| Architecture & Engineering | 10 (100.0%) | 0 (0.0%) |
| Life, Physical & Social Science | 0 (0.0%) | 0 (0.0%) |
| Community & Social Service | 24 (77.4%) | 7 (22.6%) |
| Education, Arts & Media | 24 (100.0%) | 0 (0.0%) |
| Legal Services & Support | 0 (0.0%) | 0 (0.0%) |
| Education Instruction & Library | 0 (0.0%) | 0 (0.0%) |
| Arts, Media & Entertainment | 0 (0.0%) | 7 (100.0%) |
| Health Diagnosing & Treating | 0 (0.0%) | 9 (100.0%) |
| Health Technologists | 0 (0.0%) | 0 (0.0%) |
| Total (Category) | 147 (73.5%) | 53 (26.5%) |
| Total (Overall) | 329 (57.0%) | 248 (43.0%) |
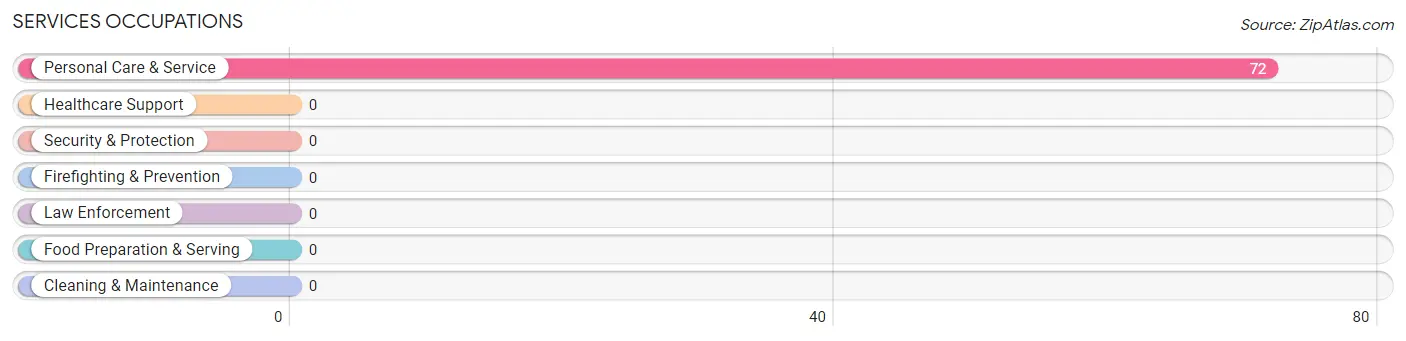
Services Occupations
The most common Services occupations in Santa Susana are , and Personal Care & Service (72 | 12.5%).
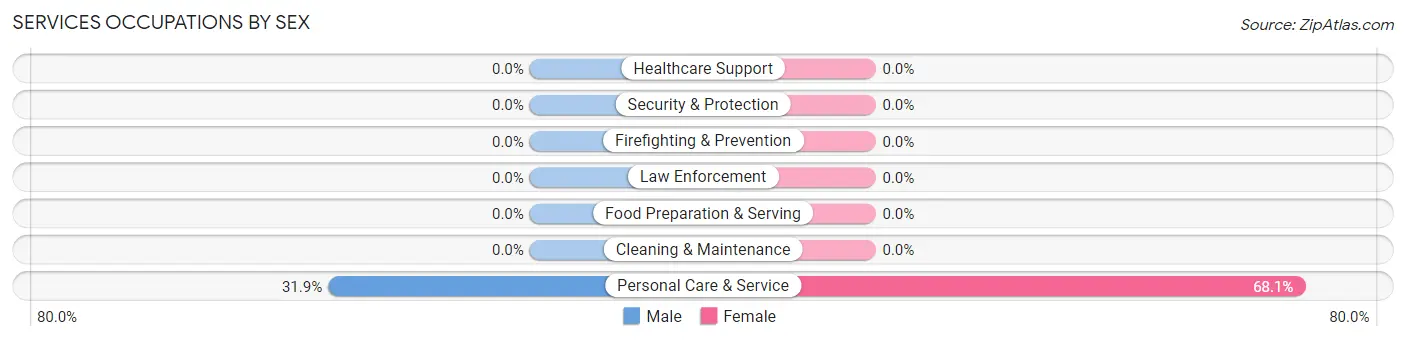
Services Occupations by Sex
| Occupation | Male | Female |
| Healthcare Support | 0 (0.0%) | 0 (0.0%) |
| Security & Protection | 0 (0.0%) | 0 (0.0%) |
| Firefighting & Prevention | 0 (0.0%) | 0 (0.0%) |
| Law Enforcement | 0 (0.0%) | 0 (0.0%) |
| Food Preparation & Serving | 0 (0.0%) | 0 (0.0%) |
| Cleaning & Maintenance | 0 (0.0%) | 0 (0.0%) |
| Personal Care & Service | 23 (31.9%) | 49 (68.1%) |
| Total (Category) | 23 (31.9%) | 49 (68.1%) |
| Total (Overall) | 329 (57.0%) | 248 (43.0%) |
Sales and Office Occupations
The most common Sales and Office occupations in Santa Susana are Sales & Related (108 | 18.7%), and Office & Administration (24 | 4.2%).
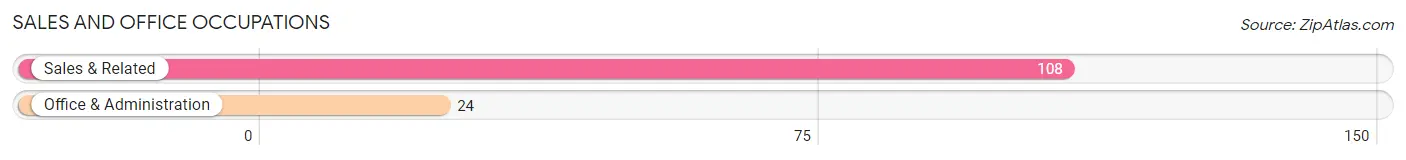
Sales and Office Occupations by Sex
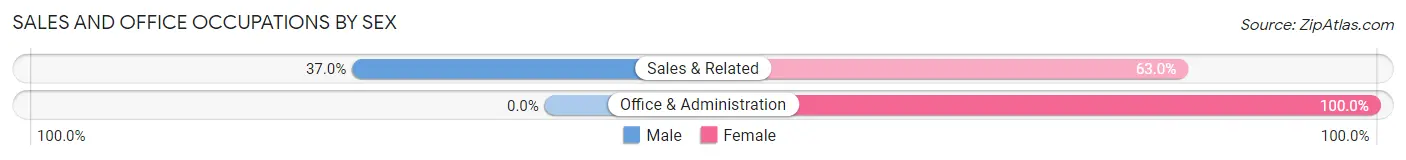
| Occupation | Male | Female |
| Sales & Related | 40 (37.0%) | 68 (63.0%) |
| Office & Administration | 0 (0.0%) | 24 (100.0%) |
| Total (Category) | 40 (30.3%) | 92 (69.7%) |
| Total (Overall) | 329 (57.0%) | 248 (43.0%) |
Natural Resources, Construction and Maintenance Occupations
The most common Natural Resources, Construction and Maintenance occupations in Santa Susana are Installation, Maintenance & Repair (100 | 17.3%), and Construction & Extraction (26 | 4.5%).
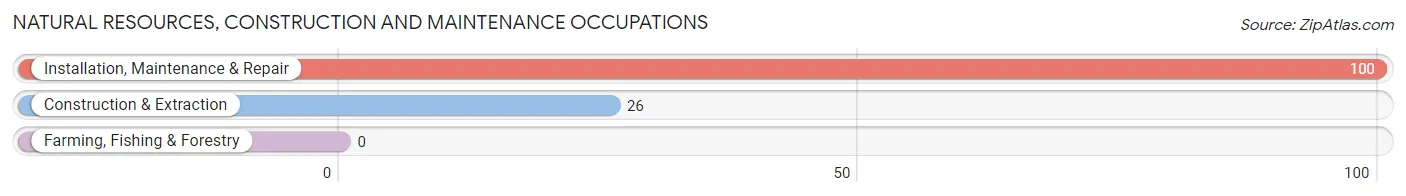
Natural Resources, Construction and Maintenance Occupations by Sex
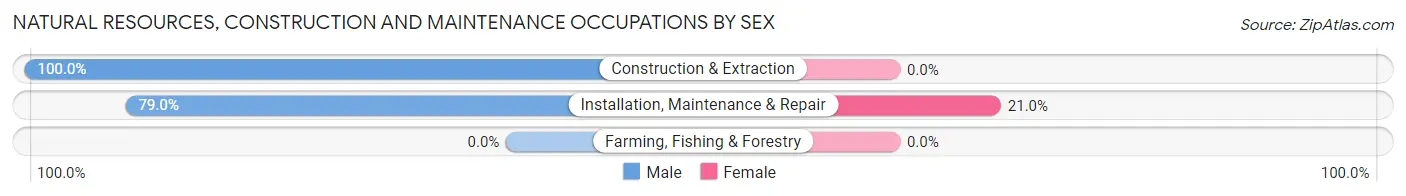
| Occupation | Male | Female |
| Farming, Fishing & Forestry | 0 (0.0%) | 0 (0.0%) |
| Construction & Extraction | 26 (100.0%) | 0 (0.0%) |
| Installation, Maintenance & Repair | 79 (79.0%) | 21 (21.0%) |
| Total (Category) | 105 (83.3%) | 21 (16.7%) |
| Total (Overall) | 329 (57.0%) | 248 (43.0%) |
Production, Transportation and Moving Occupations
The most common Production, Transportation and Moving occupations in Santa Susana are , and Production (47 | 8.2%).
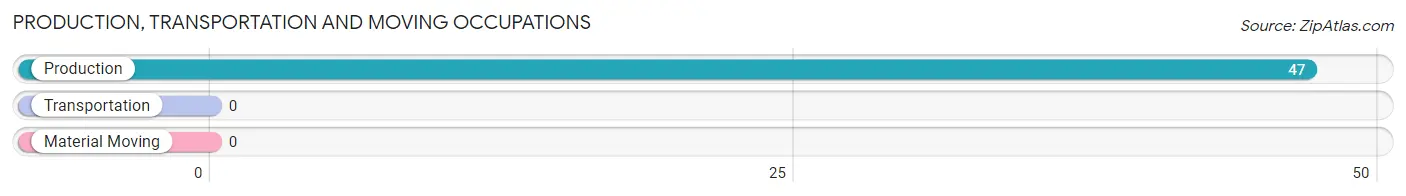
Production, Transportation and Moving Occupations by Sex
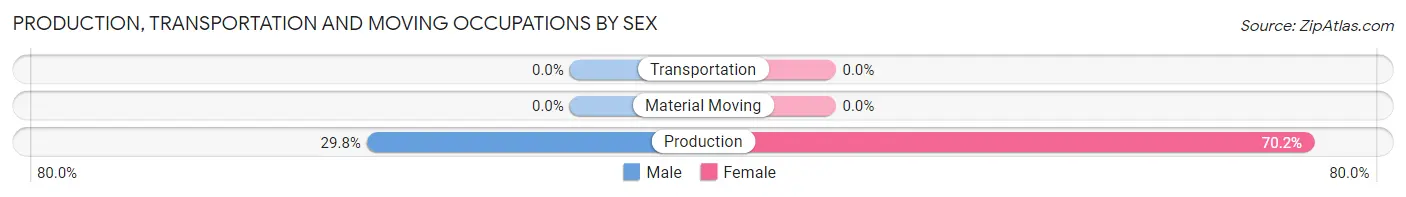
| Occupation | Male | Female |
| Production | 14 (29.8%) | 33 (70.2%) |
| Transportation | 0 (0.0%) | 0 (0.0%) |
| Material Moving | 0 (0.0%) | 0 (0.0%) |
| Total (Category) | 14 (29.8%) | 33 (70.2%) |
| Total (Overall) | 329 (57.0%) | 248 (43.0%) |
Employment Industries by Sex in Santa Susana
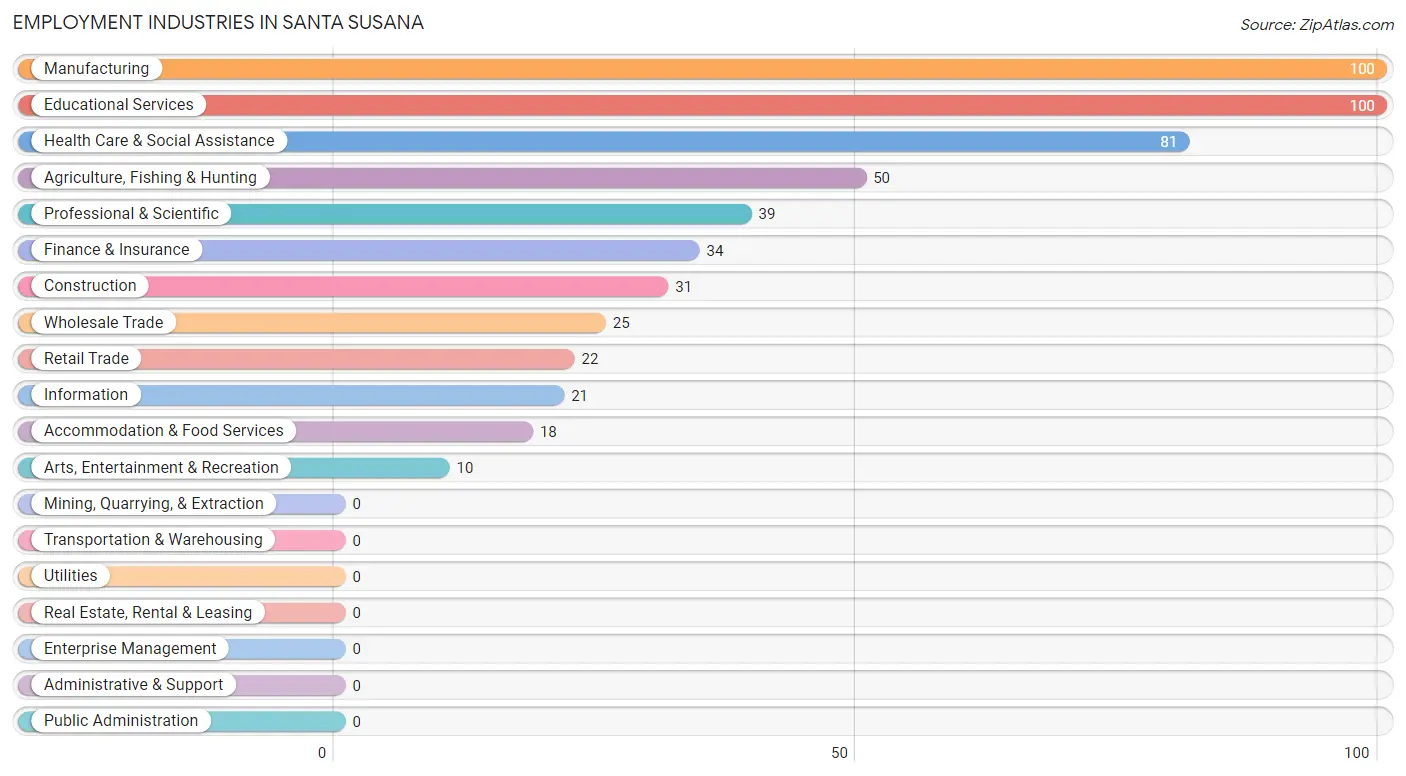
Employment Industries in Santa Susana
The major employment industries in Santa Susana include Manufacturing (100 | 17.3%), Educational Services (100 | 17.3%), Health Care & Social Assistance (81 | 14.0%), Agriculture, Fishing & Hunting (50 | 8.7%), and Professional & Scientific (39 | 6.8%).
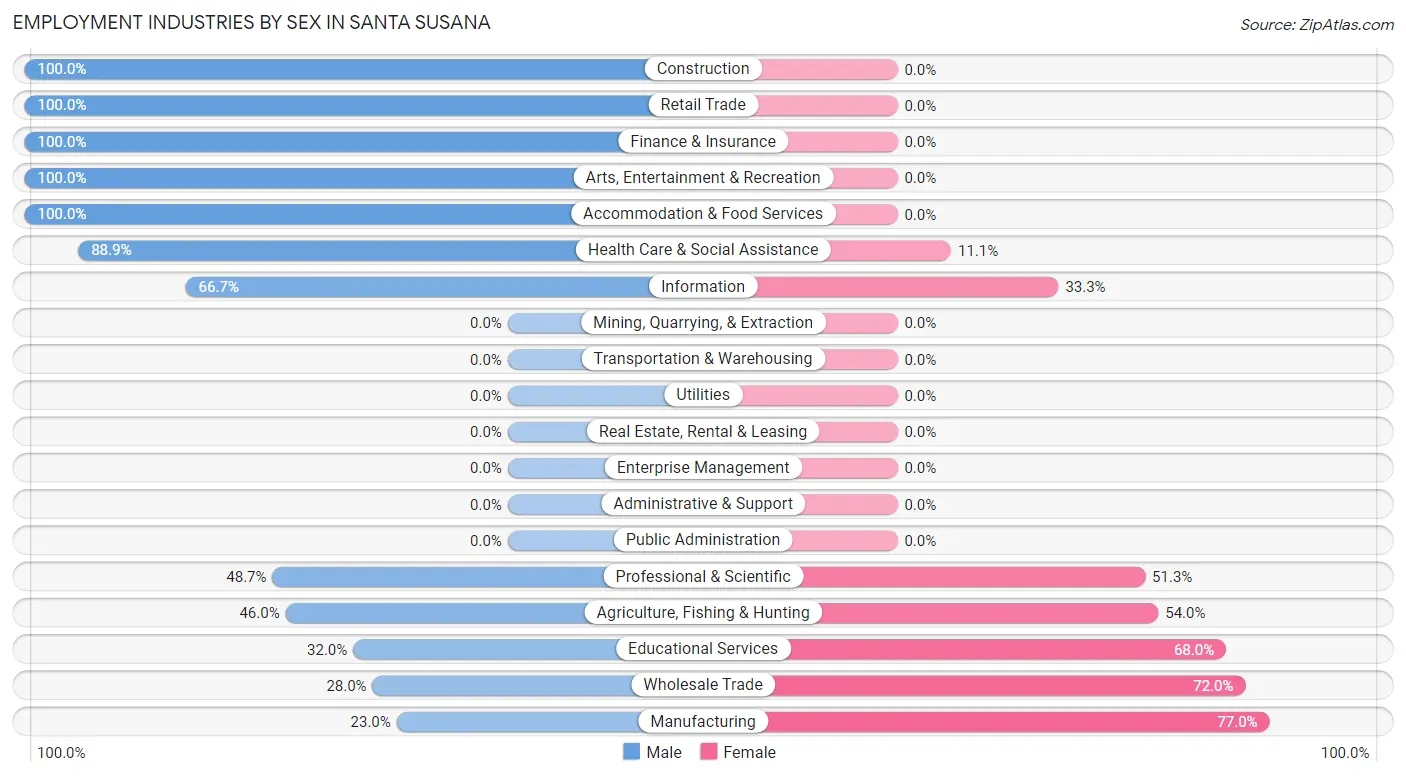
Employment Industries by Sex in Santa Susana
The Santa Susana industries that see more men than women are Construction (100.0%), Retail Trade (100.0%), and Finance & Insurance (100.0%), whereas the industries that tend to have a higher number of women are Manufacturing (77.0%), Wholesale Trade (72.0%), and Educational Services (68.0%).
| Industry | Male | Female |
| Agriculture, Fishing & Hunting | 23 (46.0%) | 27 (54.0%) |
| Mining, Quarrying, & Extraction | 0 (0.0%) | 0 (0.0%) |
| Construction | 31 (100.0%) | 0 (0.0%) |
| Manufacturing | 23 (23.0%) | 77 (77.0%) |
| Wholesale Trade | 7 (28.0%) | 18 (72.0%) |
| Retail Trade | 22 (100.0%) | 0 (0.0%) |
| Transportation & Warehousing | 0 (0.0%) | 0 (0.0%) |
| Utilities | 0 (0.0%) | 0 (0.0%) |
| Information | 14 (66.7%) | 7 (33.3%) |
| Finance & Insurance | 34 (100.0%) | 0 (0.0%) |
| Real Estate, Rental & Leasing | 0 (0.0%) | 0 (0.0%) |
| Professional & Scientific | 19 (48.7%) | 20 (51.3%) |
| Enterprise Management | 0 (0.0%) | 0 (0.0%) |
| Administrative & Support | 0 (0.0%) | 0 (0.0%) |
| Educational Services | 32 (32.0%) | 68 (68.0%) |
| Health Care & Social Assistance | 72 (88.9%) | 9 (11.1%) |
| Arts, Entertainment & Recreation | 10 (100.0%) | 0 (0.0%) |
| Accommodation & Food Services | 18 (100.0%) | 0 (0.0%) |
| Public Administration | 0 (0.0%) | 0 (0.0%) |
| Total | 329 (57.0%) | 248 (43.0%) |
Education in Santa Susana
School Enrollment in Santa Susana
The most common levels of schooling among the 311 students in Santa Susana are middle school (117 | 37.6%), high school (107 | 34.4%), and elementary school (75 | 24.1%).
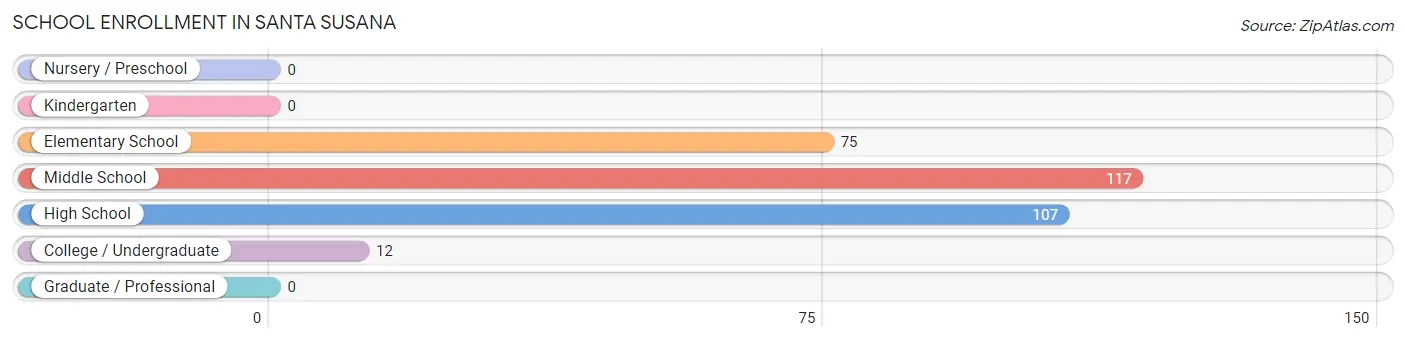
| School Level | # Students | % Students |
| Nursery / Preschool | 0 | 0.0% |
| Kindergarten | 0 | 0.0% |
| Elementary School | 75 | 24.1% |
| Middle School | 117 | 37.6% |
| High School | 107 | 34.4% |
| College / Undergraduate | 12 | 3.9% |
| Graduate / Professional | 0 | 0.0% |
| Total | 311 | 100.0% |
School Enrollment by Age by Funding Source in Santa Susana
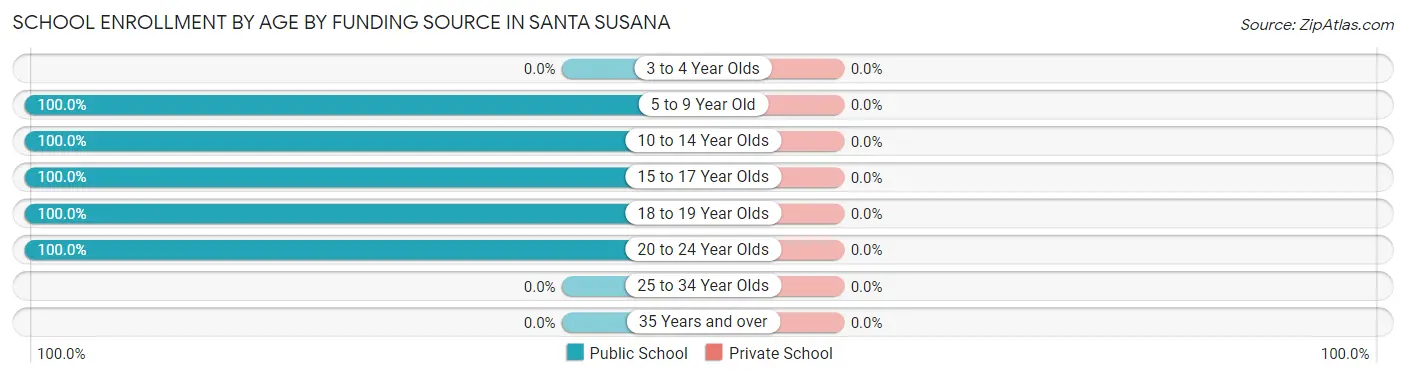
| Age Bracket | Public School | Private School |
| 3 to 4 Year Olds | 0 (0.0%) | 0 (0.0%) |
| 5 to 9 Year Old | 75 (100.0%) | 0 (0.0%) |
| 10 to 14 Year Olds | 166 (100.0%) | 0 (0.0%) |
| 15 to 17 Year Olds | 38 (100.0%) | 0 (0.0%) |
| 18 to 19 Year Olds | 20 (100.0%) | 0 (0.0%) |
| 20 to 24 Year Olds | 12 (100.0%) | 0 (0.0%) |
| 25 to 34 Year Olds | 0 (0.0%) | 0 (0.0%) |
| 35 Years and over | 0 (0.0%) | 0 (0.0%) |
| Total | 311 (100.0%) | 0 (0.0%) |
Educational Attainment by Field of Study in Santa Susana
Social sciences (57 | 20.7%), physical & health sciences (54 | 19.6%), business (31 | 11.3%), science & technology (23 | 8.4%), and bio, nature & agricultural (22 | 8.0%) are the most common fields of study among 275 individuals in Santa Susana who have obtained a bachelor's degree or higher.
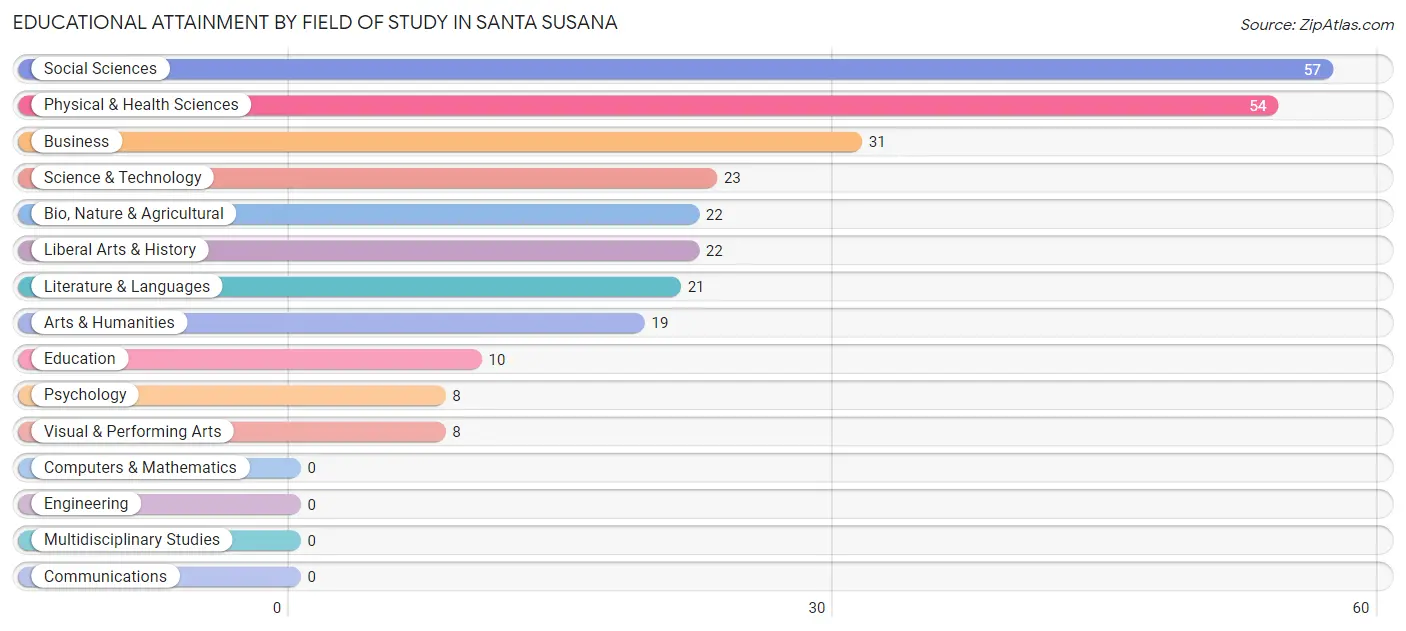
| Field of Study | # Graduates | % Graduates |
| Computers & Mathematics | 0 | 0.0% |
| Bio, Nature & Agricultural | 22 | 8.0% |
| Physical & Health Sciences | 54 | 19.6% |
| Psychology | 8 | 2.9% |
| Social Sciences | 57 | 20.7% |
| Engineering | 0 | 0.0% |
| Multidisciplinary Studies | 0 | 0.0% |
| Science & Technology | 23 | 8.4% |
| Business | 31 | 11.3% |
| Education | 10 | 3.6% |
| Literature & Languages | 21 | 7.6% |
| Liberal Arts & History | 22 | 8.0% |
| Visual & Performing Arts | 8 | 2.9% |
| Communications | 0 | 0.0% |
| Arts & Humanities | 19 | 6.9% |
| Total | 275 | 100.0% |
Transportation & Commute in Santa Susana
Vehicle Availability by Sex in Santa Susana
The most prevalent vehicle ownership categories in Santa Susana are males with 3 vehicles (140, accounting for 42.5%) and females with 3 vehicles (81, making up 56.5%).
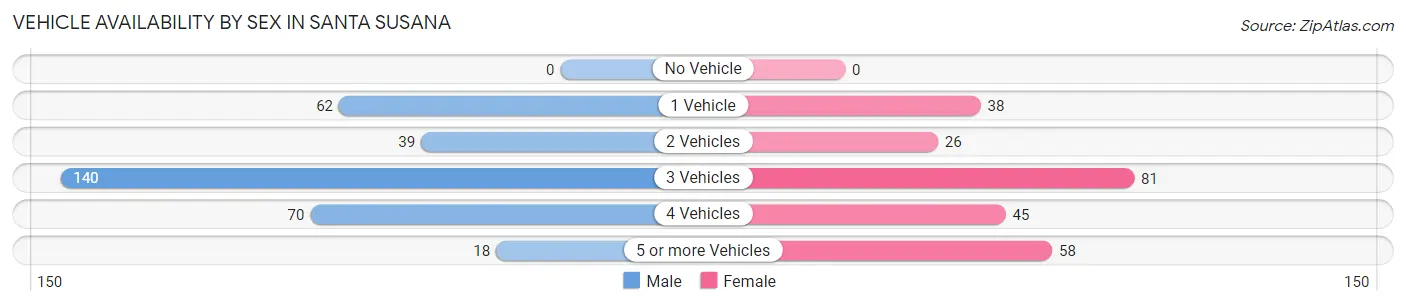
| Vehicles Available | Male | Female |
| No Vehicle | 0 (0.0%) | 0 (0.0%) |
| 1 Vehicle | 62 (18.8%) | 38 (15.3%) |
| 2 Vehicles | 39 (11.8%) | 26 (10.5%) |
| 3 Vehicles | 140 (42.5%) | 81 (32.7%) |
| 4 Vehicles | 70 (21.3%) | 45 (18.1%) |
| 5 or more Vehicles | 18 (5.5%) | 58 (23.4%) |
| Total | 329 (100.0%) | 248 (100.0%) |
Commute Time in Santa Susana
The most frequently occuring commute durations in Santa Susana are 20 to 24 minutes (126 commuters, 26.7%), 10 to 14 minutes (86 commuters, 18.2%), and 60 to 89 minutes (69 commuters, 14.6%).
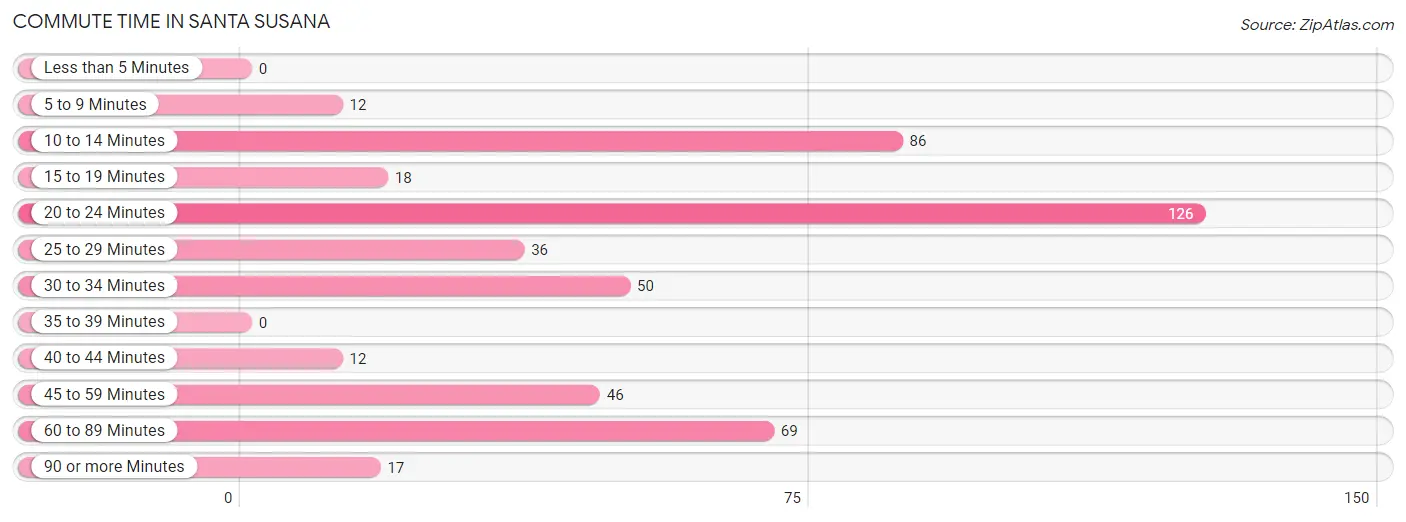
| Commute Time | # Commuters | % Commuters |
| Less than 5 Minutes | 0 | 0.0% |
| 5 to 9 Minutes | 12 | 2.5% |
| 10 to 14 Minutes | 86 | 18.2% |
| 15 to 19 Minutes | 18 | 3.8% |
| 20 to 24 Minutes | 126 | 26.7% |
| 25 to 29 Minutes | 36 | 7.6% |
| 30 to 34 Minutes | 50 | 10.6% |
| 35 to 39 Minutes | 0 | 0.0% |
| 40 to 44 Minutes | 12 | 2.5% |
| 45 to 59 Minutes | 46 | 9.8% |
| 60 to 89 Minutes | 69 | 14.6% |
| 90 or more Minutes | 17 | 3.6% |
Commute Time by Sex in Santa Susana
The most common commute times in Santa Susana are 20 to 24 minutes (72 commuters, 29.6%) for males and 10 to 14 minutes (77 commuters, 33.6%) for females.
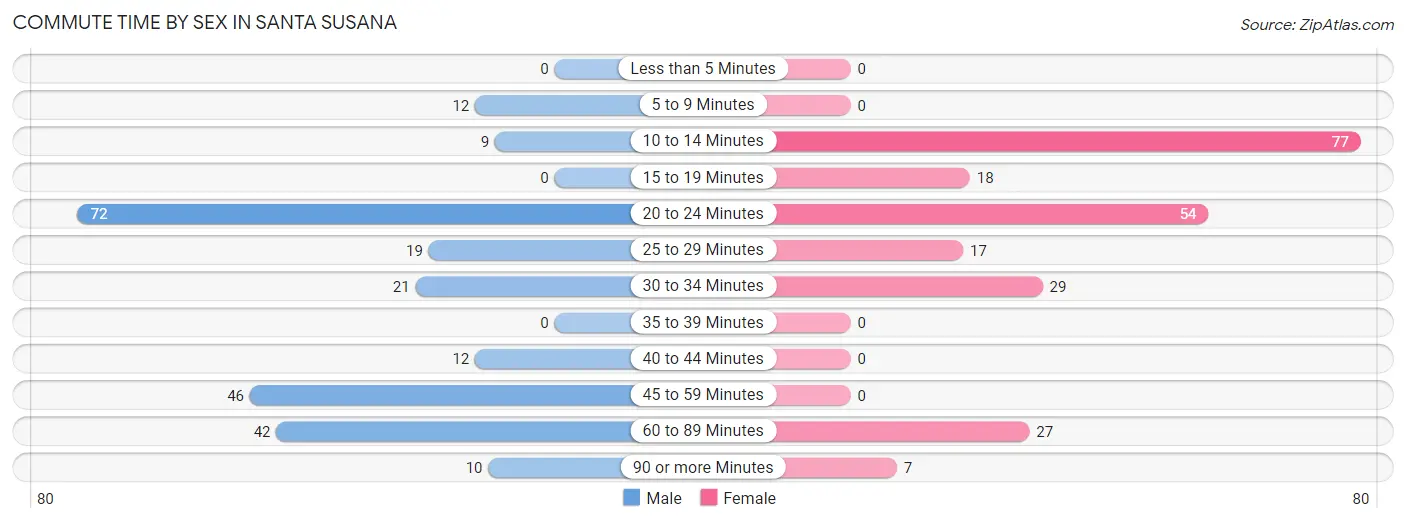
| Commute Time | Male | Female |
| Less than 5 Minutes | 0 (0.0%) | 0 (0.0%) |
| 5 to 9 Minutes | 12 (4.9%) | 0 (0.0%) |
| 10 to 14 Minutes | 9 (3.7%) | 77 (33.6%) |
| 15 to 19 Minutes | 0 (0.0%) | 18 (7.9%) |
| 20 to 24 Minutes | 72 (29.6%) | 54 (23.6%) |
| 25 to 29 Minutes | 19 (7.8%) | 17 (7.4%) |
| 30 to 34 Minutes | 21 (8.6%) | 29 (12.7%) |
| 35 to 39 Minutes | 0 (0.0%) | 0 (0.0%) |
| 40 to 44 Minutes | 12 (4.9%) | 0 (0.0%) |
| 45 to 59 Minutes | 46 (18.9%) | 0 (0.0%) |
| 60 to 89 Minutes | 42 (17.3%) | 27 (11.8%) |
| 90 or more Minutes | 10 (4.1%) | 7 (3.1%) |
Time of Departure to Work by Sex in Santa Susana
The most frequent times of departure to work in Santa Susana are 11:00 AM to 11:59 AM (91, 37.4%) for males and 8:30 AM to 8:59 AM (91, 39.7%) for females.
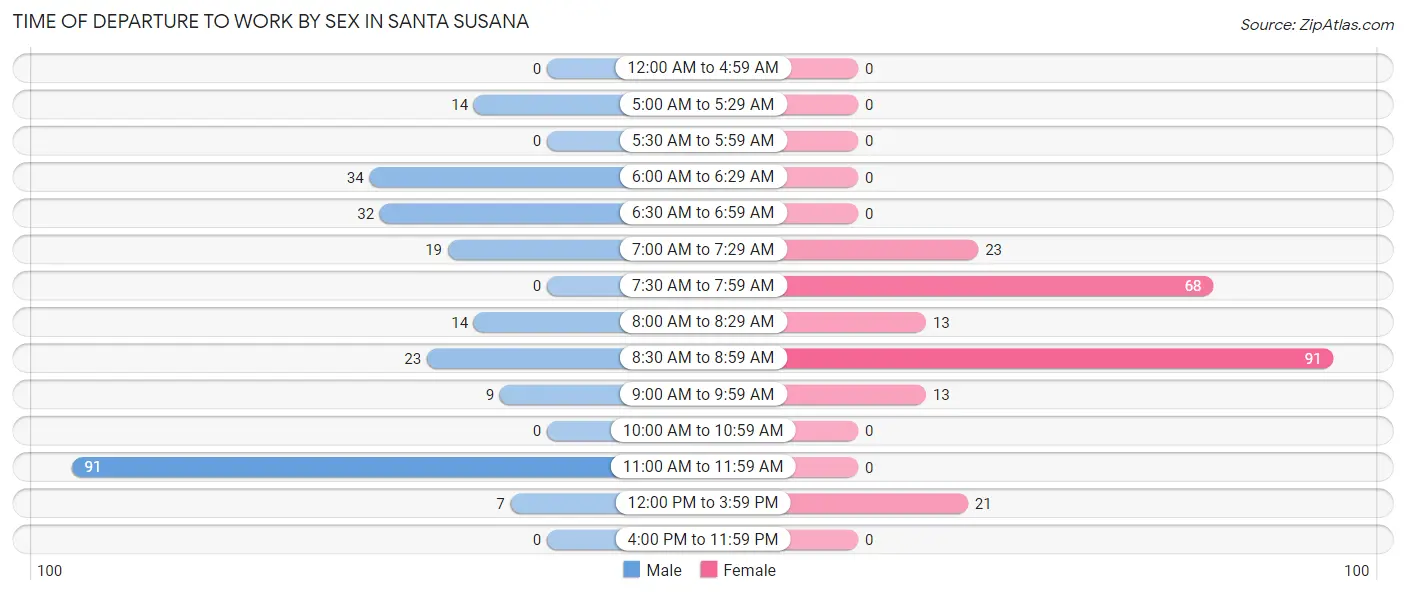
| Time of Departure | Male | Female |
| 12:00 AM to 4:59 AM | 0 (0.0%) | 0 (0.0%) |
| 5:00 AM to 5:29 AM | 14 (5.8%) | 0 (0.0%) |
| 5:30 AM to 5:59 AM | 0 (0.0%) | 0 (0.0%) |
| 6:00 AM to 6:29 AM | 34 (14.0%) | 0 (0.0%) |
| 6:30 AM to 6:59 AM | 32 (13.2%) | 0 (0.0%) |
| 7:00 AM to 7:29 AM | 19 (7.8%) | 23 (10.0%) |
| 7:30 AM to 7:59 AM | 0 (0.0%) | 68 (29.7%) |
| 8:00 AM to 8:29 AM | 14 (5.8%) | 13 (5.7%) |
| 8:30 AM to 8:59 AM | 23 (9.5%) | 91 (39.7%) |
| 9:00 AM to 9:59 AM | 9 (3.7%) | 13 (5.7%) |
| 10:00 AM to 10:59 AM | 0 (0.0%) | 0 (0.0%) |
| 11:00 AM to 11:59 AM | 91 (37.4%) | 0 (0.0%) |
| 12:00 PM to 3:59 PM | 7 (2.9%) | 21 (9.2%) |
| 4:00 PM to 11:59 PM | 0 (0.0%) | 0 (0.0%) |
| Total | 243 (100.0%) | 229 (100.0%) |
Housing Occupancy in Santa Susana
Occupancy by Ownership in Santa Susana
Of the total 449 dwellings in Santa Susana, owner-occupied units account for 398 (88.6%), while renter-occupied units make up 51 (11.4%).
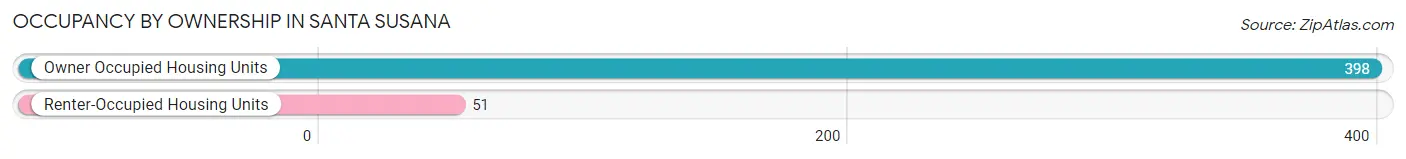
| Occupancy | # Housing Units | % Housing Units |
| Owner Occupied Housing Units | 398 | 88.6% |
| Renter-Occupied Housing Units | 51 | 11.4% |
| Total Occupied Housing Units | 449 | 100.0% |
Occupancy by Household Size in Santa Susana
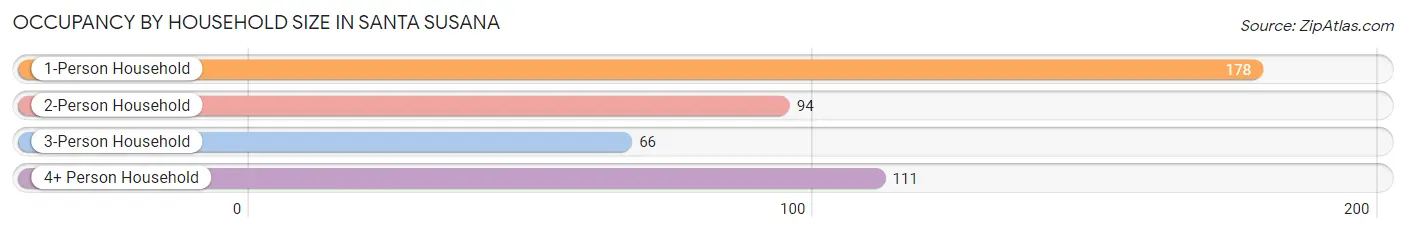
| Household Size | # Housing Units | % Housing Units |
| 1-Person Household | 178 | 39.6% |
| 2-Person Household | 94 | 20.9% |
| 3-Person Household | 66 | 14.7% |
| 4+ Person Household | 111 | 24.7% |
| Total Housing Units | 449 | 100.0% |
Occupancy by Ownership by Household Size in Santa Susana
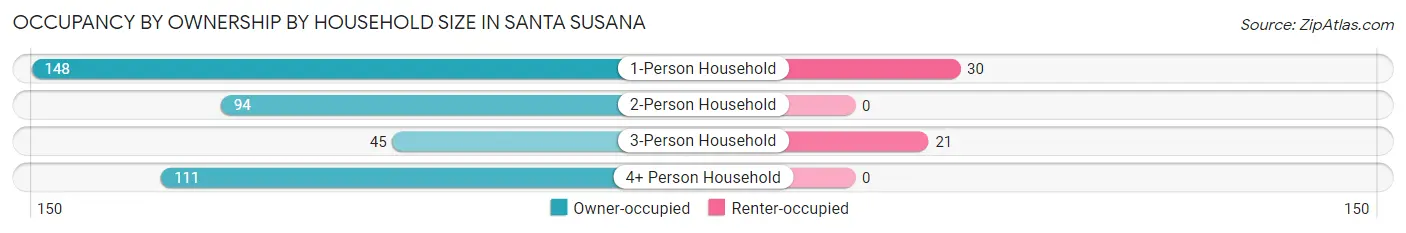
| Household Size | Owner-occupied | Renter-occupied |
| 1-Person Household | 148 (83.2%) | 30 (16.9%) |
| 2-Person Household | 94 (100.0%) | 0 (0.0%) |
| 3-Person Household | 45 (68.2%) | 21 (31.8%) |
| 4+ Person Household | 111 (100.0%) | 0 (0.0%) |
| Total Housing Units | 398 (88.6%) | 51 (11.4%) |
Occupancy by Educational Attainment in Santa Susana
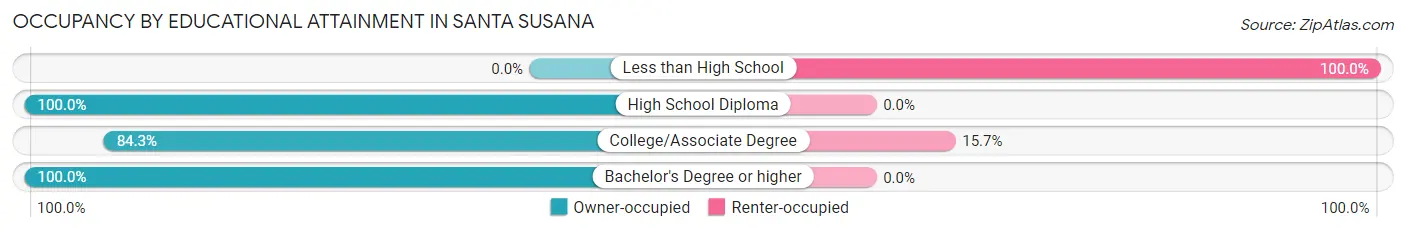
| Household Size | Owner-occupied | Renter-occupied |
| Less than High School | 0 (0.0%) | 11 (100.0%) |
| High School Diploma | 43 (100.0%) | 0 (0.0%) |
| College/Associate Degree | 215 (84.3%) | 40 (15.7%) |
| Bachelor's Degree or higher | 140 (100.0%) | 0 (0.0%) |
Occupancy by Age of Householder in Santa Susana
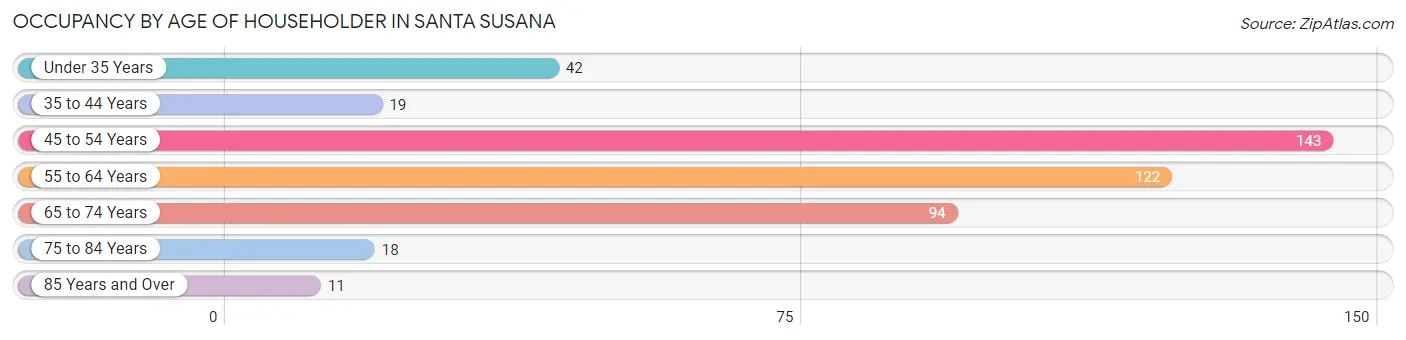
| Age Bracket | # Households | % Households |
| Under 35 Years | 42 | 9.3% |
| 35 to 44 Years | 19 | 4.2% |
| 45 to 54 Years | 143 | 31.9% |
| 55 to 64 Years | 122 | 27.2% |
| 65 to 74 Years | 94 | 20.9% |
| 75 to 84 Years | 18 | 4.0% |
| 85 Years and Over | 11 | 2.5% |
| Total | 449 | 100.0% |
Housing Finances in Santa Susana
Median Income by Occupancy in Santa Susana
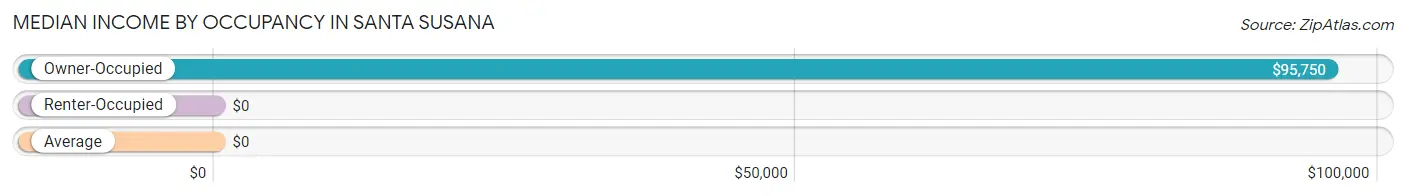
| Occupancy Type | # Households | Median Income |
| Owner-Occupied | 398 (88.6%) | $95,750 |
| Renter-Occupied | 51 (11.4%) | $0 |
| Average | 449 (100.0%) | $0 |
Occupancy by Householder Income Bracket in Santa Susana
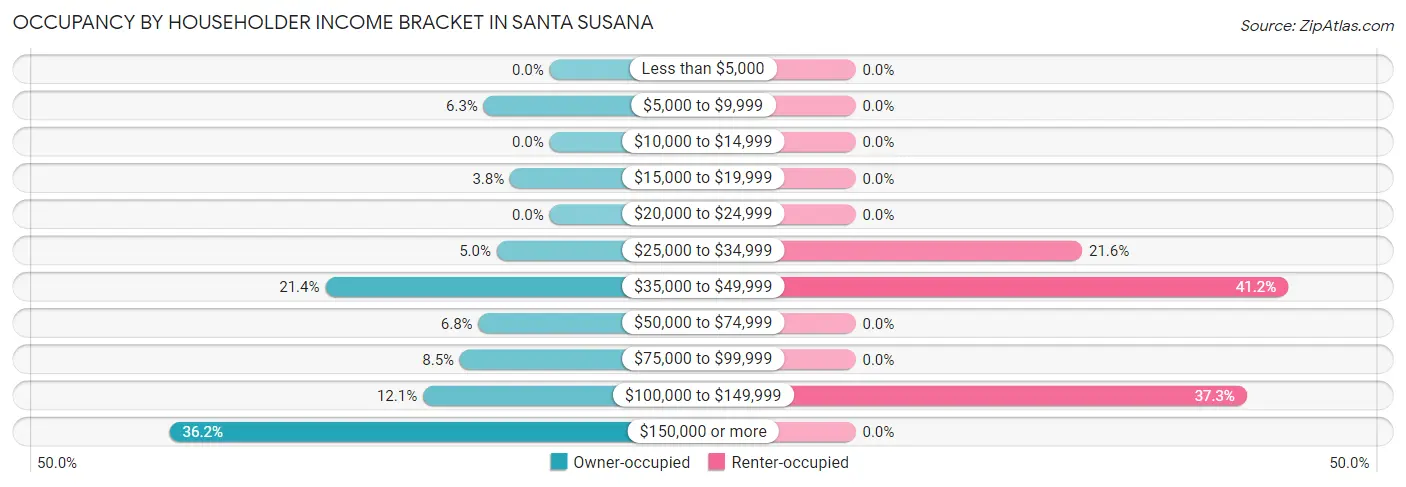
| Income Bracket | Owner-occupied | Renter-occupied |
| Less than $5,000 | 0 (0.0%) | 0 (0.0%) |
| $5,000 to $9,999 | 25 (6.3%) | 0 (0.0%) |
| $10,000 to $14,999 | 0 (0.0%) | 0 (0.0%) |
| $15,000 to $19,999 | 15 (3.8%) | 0 (0.0%) |
| $20,000 to $24,999 | 0 (0.0%) | 0 (0.0%) |
| $25,000 to $34,999 | 20 (5.0%) | 11 (21.6%) |
| $35,000 to $49,999 | 85 (21.4%) | 21 (41.2%) |
| $50,000 to $74,999 | 27 (6.8%) | 0 (0.0%) |
| $75,000 to $99,999 | 34 (8.5%) | 0 (0.0%) |
| $100,000 to $149,999 | 48 (12.1%) | 19 (37.2%) |
| $150,000 or more | 144 (36.2%) | 0 (0.0%) |
| Total | 398 (100.0%) | 51 (100.0%) |
Monthly Housing Cost Tiers in Santa Susana
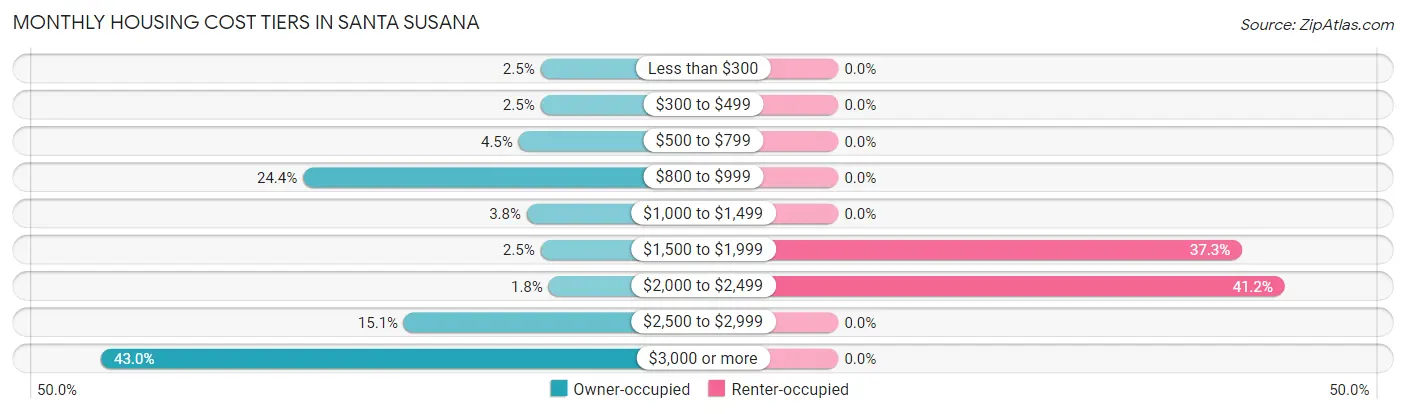
| Monthly Cost | Owner-occupied | Renter-occupied |
| Less than $300 | 10 (2.5%) | 0 (0.0%) |
| $300 to $499 | 10 (2.5%) | 0 (0.0%) |
| $500 to $799 | 18 (4.5%) | 0 (0.0%) |
| $800 to $999 | 97 (24.4%) | 0 (0.0%) |
| $1,000 to $1,499 | 15 (3.8%) | 0 (0.0%) |
| $1,500 to $1,999 | 10 (2.5%) | 19 (37.2%) |
| $2,000 to $2,499 | 7 (1.8%) | 21 (41.2%) |
| $2,500 to $2,999 | 60 (15.1%) | 0 (0.0%) |
| $3,000 or more | 171 (43.0%) | 0 (0.0%) |
| Total | 398 (100.0%) | 51 (100.0%) |
Physical Housing Characteristics in Santa Susana
Housing Structures in Santa Susana
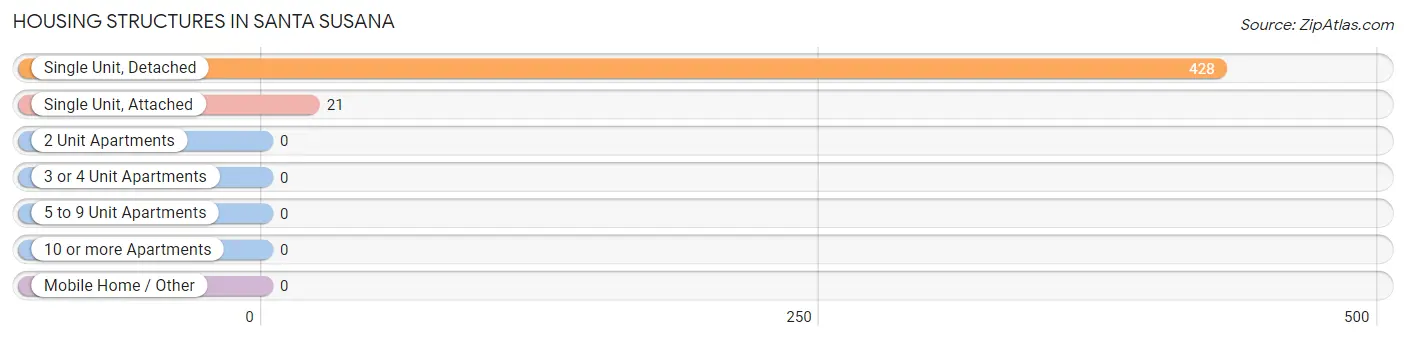
| Structure Type | # Housing Units | % Housing Units |
| Single Unit, Detached | 428 | 95.3% |
| Single Unit, Attached | 21 | 4.7% |
| 2 Unit Apartments | 0 | 0.0% |
| 3 or 4 Unit Apartments | 0 | 0.0% |
| 5 to 9 Unit Apartments | 0 | 0.0% |
| 10 or more Apartments | 0 | 0.0% |
| Mobile Home / Other | 0 | 0.0% |
| Total | 449 | 100.0% |
Housing Structures by Occupancy in Santa Susana
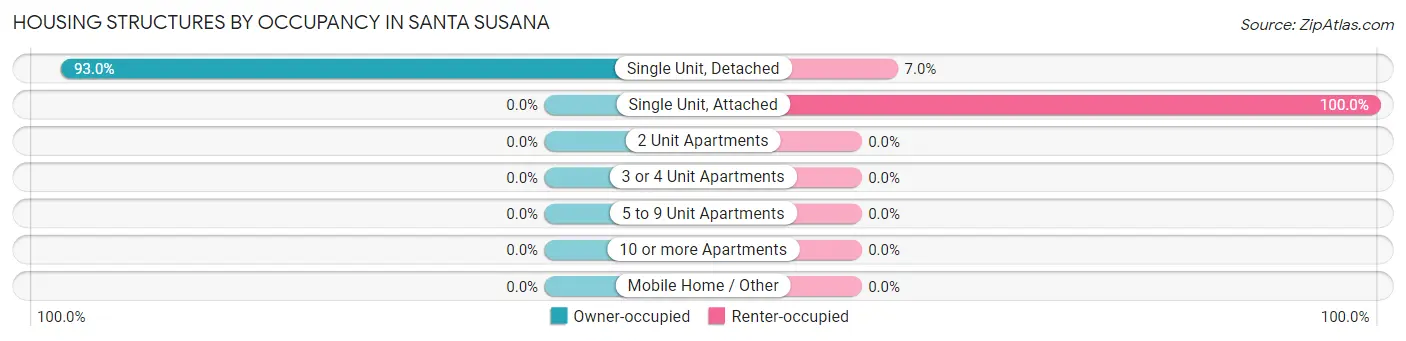
| Structure Type | Owner-occupied | Renter-occupied |
| Single Unit, Detached | 398 (93.0%) | 30 (7.0%) |
| Single Unit, Attached | 0 (0.0%) | 21 (100.0%) |
| 2 Unit Apartments | 0 (0.0%) | 0 (0.0%) |
| 3 or 4 Unit Apartments | 0 (0.0%) | 0 (0.0%) |
| 5 to 9 Unit Apartments | 0 (0.0%) | 0 (0.0%) |
| 10 or more Apartments | 0 (0.0%) | 0 (0.0%) |
| Mobile Home / Other | 0 (0.0%) | 0 (0.0%) |
| Total | 398 (88.6%) | 51 (11.4%) |
Housing Structures by Number of Rooms in Santa Susana
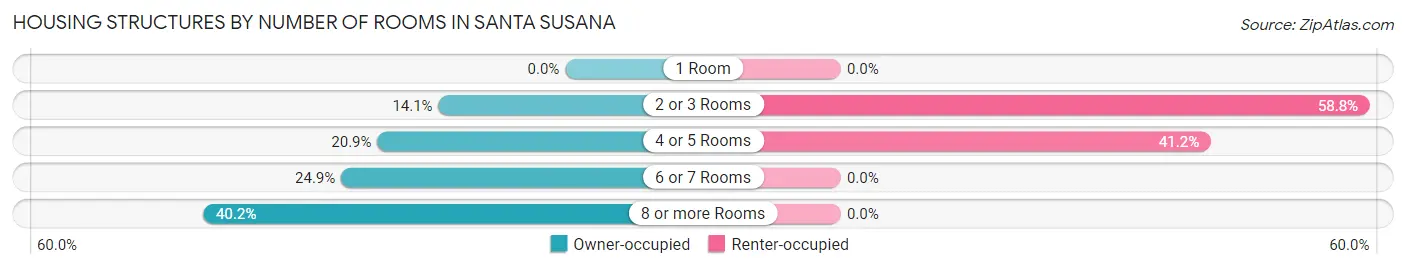
| Number of Rooms | Owner-occupied | Renter-occupied |
| 1 Room | 0 (0.0%) | 0 (0.0%) |
| 2 or 3 Rooms | 56 (14.1%) | 30 (58.8%) |
| 4 or 5 Rooms | 83 (20.8%) | 21 (41.2%) |
| 6 or 7 Rooms | 99 (24.9%) | 0 (0.0%) |
| 8 or more Rooms | 160 (40.2%) | 0 (0.0%) |
| Total | 398 (100.0%) | 51 (100.0%) |
Housing Structure by Heating Type in Santa Susana
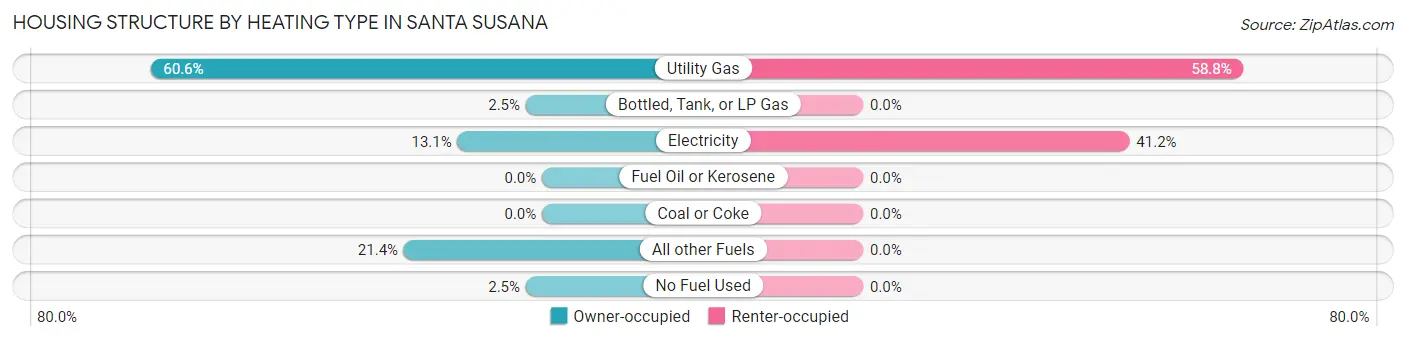
| Heating Type | Owner-occupied | Renter-occupied |
| Utility Gas | 241 (60.6%) | 30 (58.8%) |
| Bottled, Tank, or LP Gas | 10 (2.5%) | 0 (0.0%) |
| Electricity | 52 (13.1%) | 21 (41.2%) |
| Fuel Oil or Kerosene | 0 (0.0%) | 0 (0.0%) |
| Coal or Coke | 0 (0.0%) | 0 (0.0%) |
| All other Fuels | 85 (21.4%) | 0 (0.0%) |
| No Fuel Used | 10 (2.5%) | 0 (0.0%) |
| Total | 398 (100.0%) | 51 (100.0%) |
Household Vehicle Usage in Santa Susana
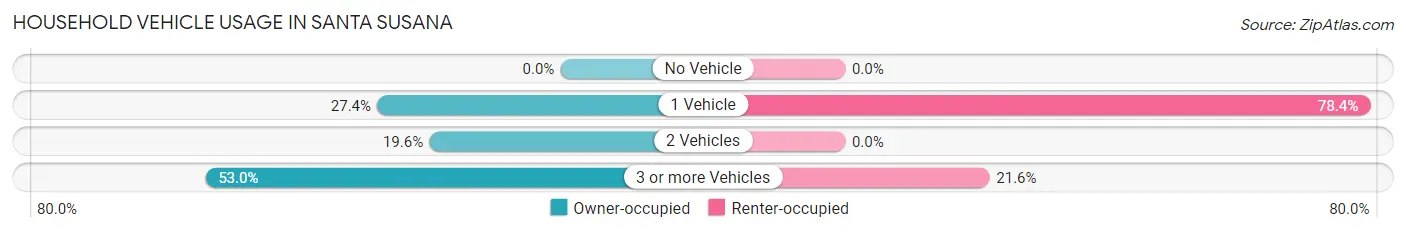
| Vehicles per Household | Owner-occupied | Renter-occupied |
| No Vehicle | 0 (0.0%) | 0 (0.0%) |
| 1 Vehicle | 109 (27.4%) | 40 (78.4%) |
| 2 Vehicles | 78 (19.6%) | 0 (0.0%) |
| 3 or more Vehicles | 211 (53.0%) | 11 (21.6%) |
| Total | 398 (100.0%) | 51 (100.0%) |
Real Estate & Mortgages in Santa Susana
Real Estate and Mortgage Overview in Santa Susana
| Characteristic | Without Mortgage | With Mortgage |
| Housing Units | 82 | 316 |
| Median Property Value | $648,100 | $688,600 |
| Median Household Income | - | - |
| Monthly Housing Costs | $810 | $171 |
| Real Estate Taxes | - | - |
Property Value by Mortgage Status in Santa Susana
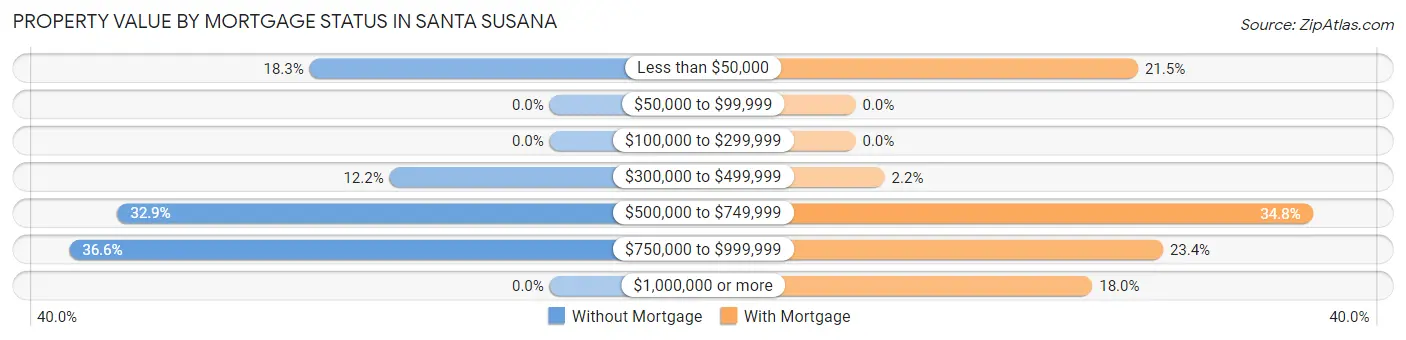
| Property Value | Without Mortgage | With Mortgage |
| Less than $50,000 | 15 (18.3%) | 68 (21.5%) |
| $50,000 to $99,999 | 0 (0.0%) | 0 (0.0%) |
| $100,000 to $299,999 | 0 (0.0%) | 0 (0.0%) |
| $300,000 to $499,999 | 10 (12.2%) | 7 (2.2%) |
| $500,000 to $749,999 | 27 (32.9%) | 110 (34.8%) |
| $750,000 to $999,999 | 30 (36.6%) | 74 (23.4%) |
| $1,000,000 or more | 0 (0.0%) | 57 (18.0%) |
| Total | 82 (100.0%) | 316 (100.0%) |
Household Income by Mortgage Status in Santa Susana
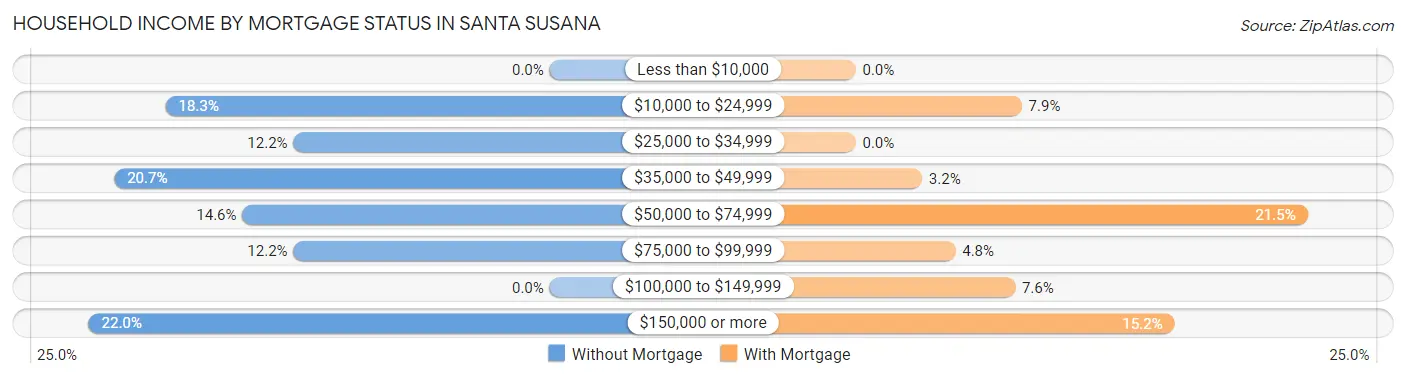
| Household Income | Without Mortgage | With Mortgage |
| Less than $10,000 | 0 (0.0%) | 0 (0.0%) |
| $10,000 to $24,999 | 15 (18.3%) | 25 (7.9%) |
| $25,000 to $34,999 | 10 (12.2%) | 0 (0.0%) |
| $35,000 to $49,999 | 17 (20.7%) | 10 (3.2%) |
| $50,000 to $74,999 | 12 (14.6%) | 68 (21.5%) |
| $75,000 to $99,999 | 10 (12.2%) | 15 (4.8%) |
| $100,000 to $149,999 | 0 (0.0%) | 24 (7.6%) |
| $150,000 or more | 18 (22.0%) | 48 (15.2%) |
| Total | 82 (100.0%) | 316 (100.0%) |
Property Value to Household Income Ratio in Santa Susana
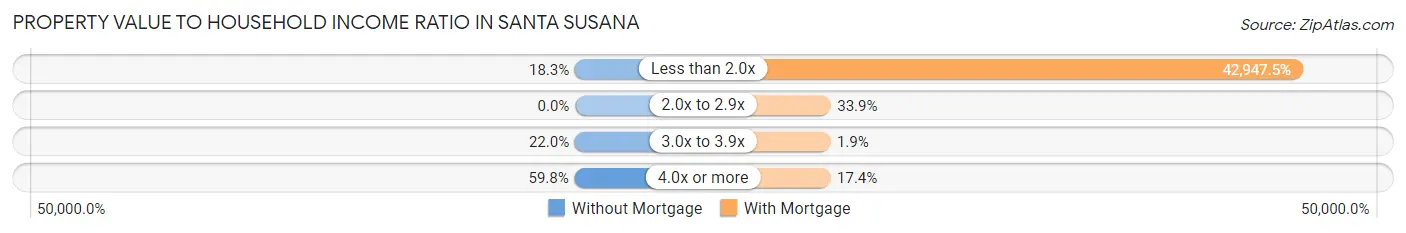
| Value-to-Income Ratio | Without Mortgage | With Mortgage |
| Less than 2.0x | 15 (18.3%) | 135,714 (42,947.5%) |
| 2.0x to 2.9x | 0 (0.0%) | 107 (33.9%) |
| 3.0x to 3.9x | 18 (22.0%) | 6 (1.9%) |
| 4.0x or more | 49 (59.8%) | 55 (17.4%) |
| Total | 82 (100.0%) | 316 (100.0%) |
Real Estate Taxes by Mortgage Status in Santa Susana
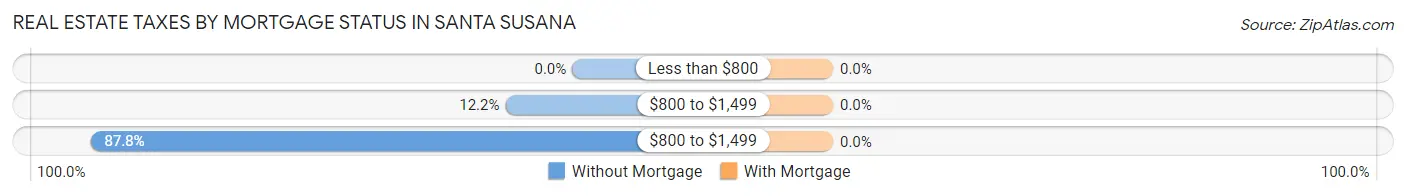
| Property Taxes | Without Mortgage | With Mortgage |
| Less than $800 | 0 (0.0%) | 0 (0.0%) |
| $800 to $1,499 | 10 (12.2%) | 0 (0.0%) |
| $800 to $1,499 | 72 (87.8%) | 0 (0.0%) |
| Total | 82 (100.0%) | 316 (100.0%) |
Health & Disability in Santa Susana
Health Insurance Coverage by Age in Santa Susana
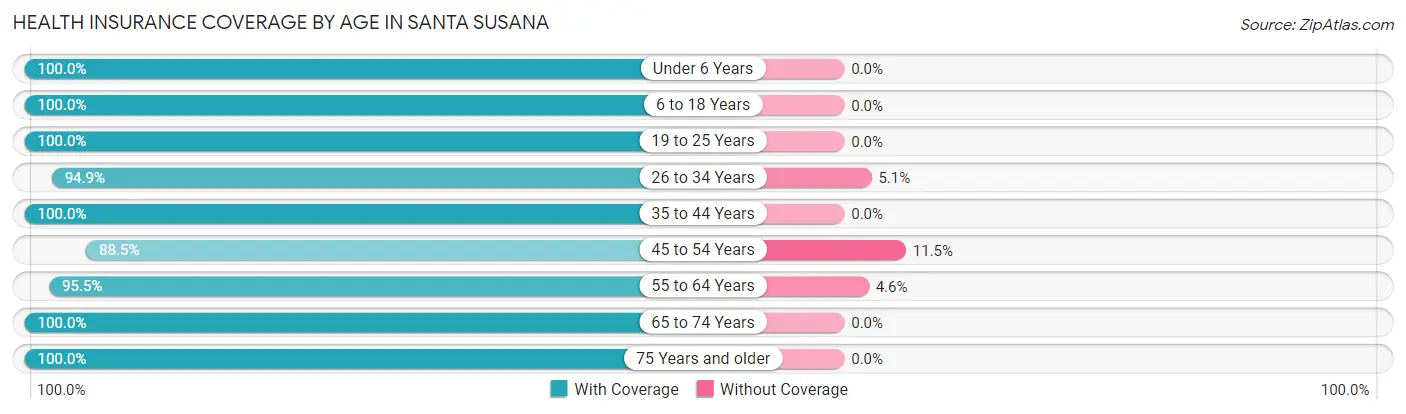
| Age Bracket | With Coverage | Without Coverage |
| Under 6 Years | 17 (100.0%) | 0 (0.0%) |
| 6 to 18 Years | 299 (100.0%) | 0 (0.0%) |
| 19 to 25 Years | 48 (100.0%) | 0 (0.0%) |
| 26 to 34 Years | 150 (94.9%) | 8 (5.1%) |
| 35 to 44 Years | 28 (100.0%) | 0 (0.0%) |
| 45 to 54 Years | 216 (88.5%) | 28 (11.5%) |
| 55 to 64 Years | 147 (95.5%) | 7 (4.5%) |
| 65 to 74 Years | 140 (100.0%) | 0 (0.0%) |
| 75 Years and older | 41 (100.0%) | 0 (0.0%) |
| Total | 1,086 (96.2%) | 43 (3.8%) |
Health Insurance Coverage by Citizenship Status in Santa Susana
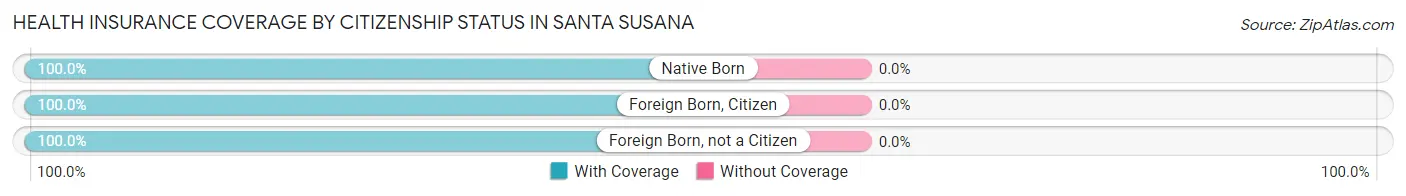
| Citizenship Status | With Coverage | Without Coverage |
| Native Born | 17 (100.0%) | 0 (0.0%) |
| Foreign Born, Citizen | 299 (100.0%) | 0 (0.0%) |
| Foreign Born, not a Citizen | 48 (100.0%) | 0 (0.0%) |
Health Insurance Coverage by Household Income in Santa Susana

| Household Income | With Coverage | Without Coverage |
| Under $25,000 | 74 (100.0%) | 0 (0.0%) |
| $25,000 to $49,999 | 404 (95.1%) | 21 (4.9%) |
| $50,000 to $74,999 | 47 (77.0%) | 14 (23.0%) |
| $75,000 to $99,999 | 34 (100.0%) | 0 (0.0%) |
| $100,000 and over | 527 (98.5%) | 8 (1.5%) |
Public vs Private Health Insurance Coverage by Age in Santa Susana
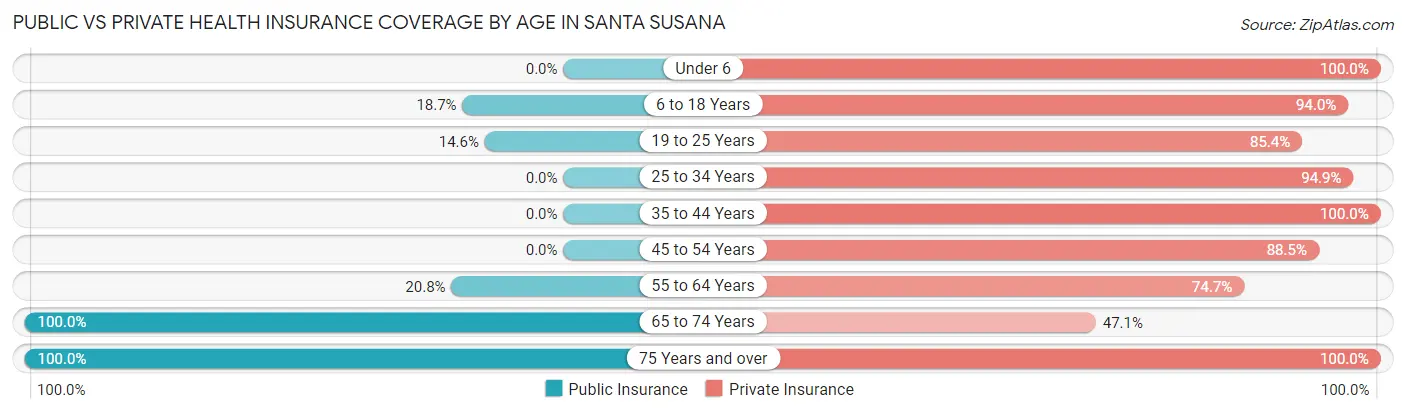
| Age Bracket | Public Insurance | Private Insurance |
| Under 6 | 0 (0.0%) | 17 (100.0%) |
| 6 to 18 Years | 56 (18.7%) | 281 (94.0%) |
| 19 to 25 Years | 7 (14.6%) | 41 (85.4%) |
| 25 to 34 Years | 0 (0.0%) | 150 (94.9%) |
| 35 to 44 Years | 0 (0.0%) | 28 (100.0%) |
| 45 to 54 Years | 0 (0.0%) | 216 (88.5%) |
| 55 to 64 Years | 32 (20.8%) | 115 (74.7%) |
| 65 to 74 Years | 140 (100.0%) | 66 (47.1%) |
| 75 Years and over | 41 (100.0%) | 41 (100.0%) |
| Total | 276 (24.4%) | 955 (84.6%) |
Disability Status by Sex by Age in Santa Susana
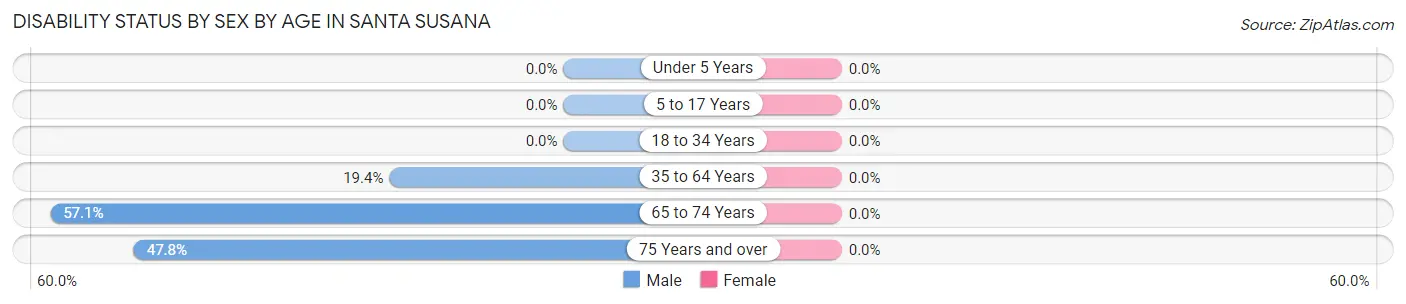
| Age Bracket | Male | Female |
| Under 5 Years | 0 (0.0%) | 0 (0.0%) |
| 5 to 17 Years | 0 (0.0%) | 0 (0.0%) |
| 18 to 34 Years | 0 (0.0%) | 0 (0.0%) |
| 35 to 64 Years | 51 (19.4%) | 0 (0.0%) |
| 65 to 74 Years | 32 (57.1%) | 0 (0.0%) |
| 75 Years and over | 11 (47.8%) | 0 (0.0%) |
Disability Class by Sex by Age in Santa Susana
Disability Class: Hearing Difficulty
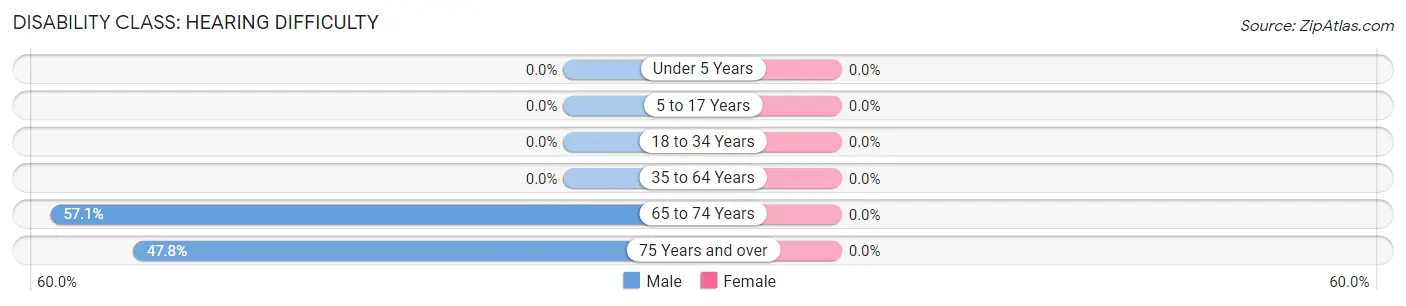
| Age Bracket | Male | Female |
| Under 5 Years | 0 (0.0%) | 0 (0.0%) |
| 5 to 17 Years | 0 (0.0%) | 0 (0.0%) |
| 18 to 34 Years | 0 (0.0%) | 0 (0.0%) |
| 35 to 64 Years | 0 (0.0%) | 0 (0.0%) |
| 65 to 74 Years | 32 (57.1%) | 0 (0.0%) |
| 75 Years and over | 11 (47.8%) | 0 (0.0%) |
Disability Class: Vision Difficulty
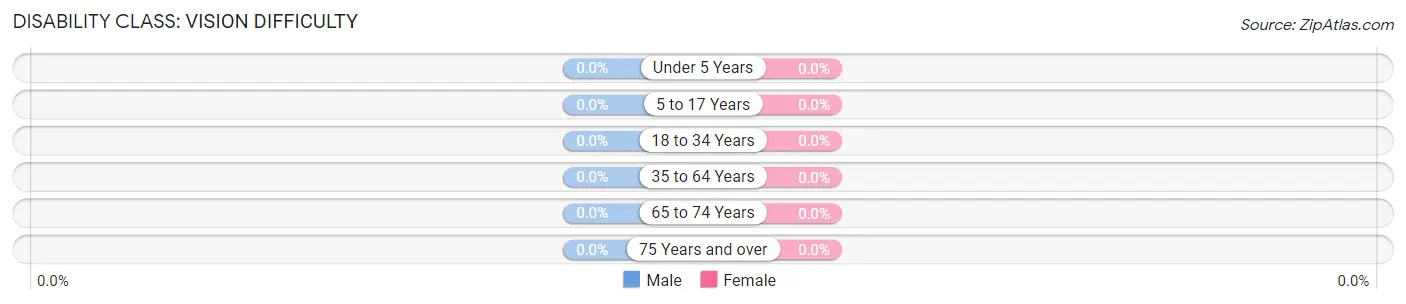
| Age Bracket | Male | Female |
| Under 5 Years | 0 (0.0%) | 0 (0.0%) |
| 5 to 17 Years | 0 (0.0%) | 0 (0.0%) |
| 18 to 34 Years | 0 (0.0%) | 0 (0.0%) |
| 35 to 64 Years | 0 (0.0%) | 0 (0.0%) |
| 65 to 74 Years | 0 (0.0%) | 0 (0.0%) |
| 75 Years and over | 0 (0.0%) | 0 (0.0%) |
Disability Class: Cognitive Difficulty
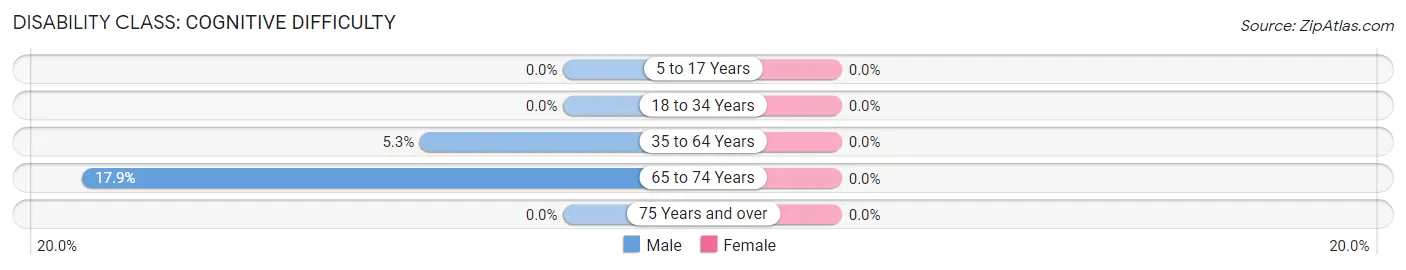
| Age Bracket | Male | Female |
| 5 to 17 Years | 0 (0.0%) | 0 (0.0%) |
| 18 to 34 Years | 0 (0.0%) | 0 (0.0%) |
| 35 to 64 Years | 14 (5.3%) | 0 (0.0%) |
| 65 to 74 Years | 10 (17.9%) | 0 (0.0%) |
| 75 Years and over | 0 (0.0%) | 0 (0.0%) |
Disability Class: Ambulatory Difficulty
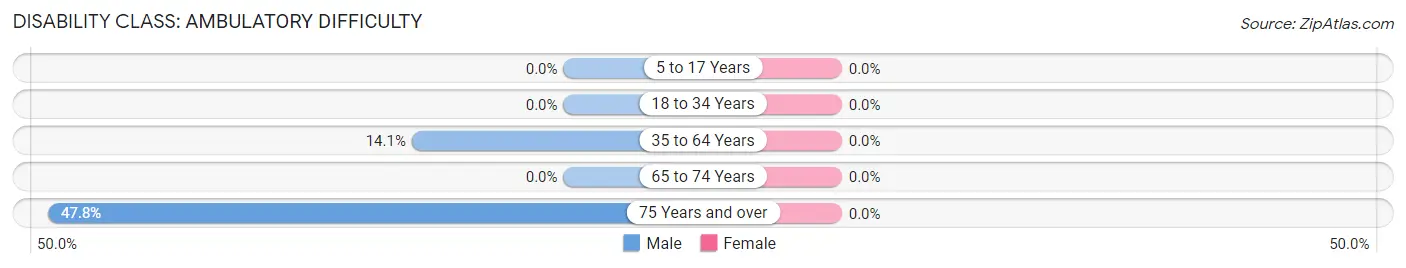
| Age Bracket | Male | Female |
| 5 to 17 Years | 0 (0.0%) | 0 (0.0%) |
| 18 to 34 Years | 0 (0.0%) | 0 (0.0%) |
| 35 to 64 Years | 37 (14.1%) | 0 (0.0%) |
| 65 to 74 Years | 0 (0.0%) | 0 (0.0%) |
| 75 Years and over | 11 (47.8%) | 0 (0.0%) |
Disability Class: Self-Care Difficulty
| Age Bracket | Male | Female |
| 5 to 17 Years | 0 (0.0%) | 0 (0.0%) |
| 18 to 34 Years | 0 (0.0%) | 0 (0.0%) |
| 35 to 64 Years | 0 (0.0%) | 0 (0.0%) |
| 65 to 74 Years | 0 (0.0%) | 0 (0.0%) |
| 75 Years and over | 0 (0.0%) | 0 (0.0%) |
Technology Access in Santa Susana
Computing Device Access in Santa Susana
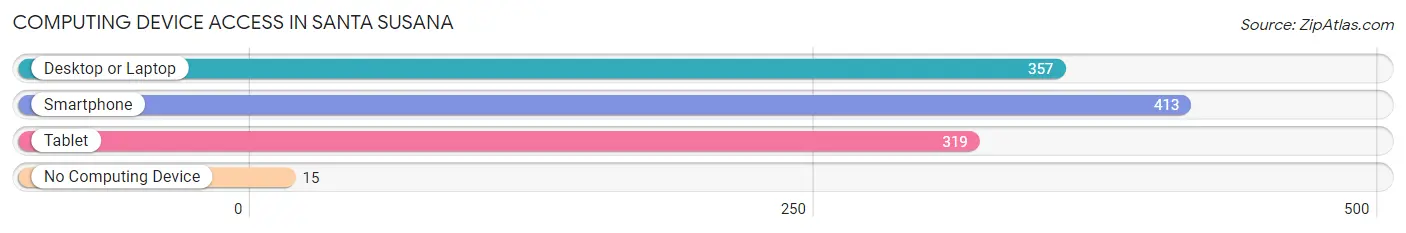
| Device Type | # Households | % Households |
| Desktop or Laptop | 357 | 79.5% |
| Smartphone | 413 | 92.0% |
| Tablet | 319 | 71.1% |
| No Computing Device | 15 | 3.3% |
| Total | 449 | 100.0% |
Internet Access in Santa Susana
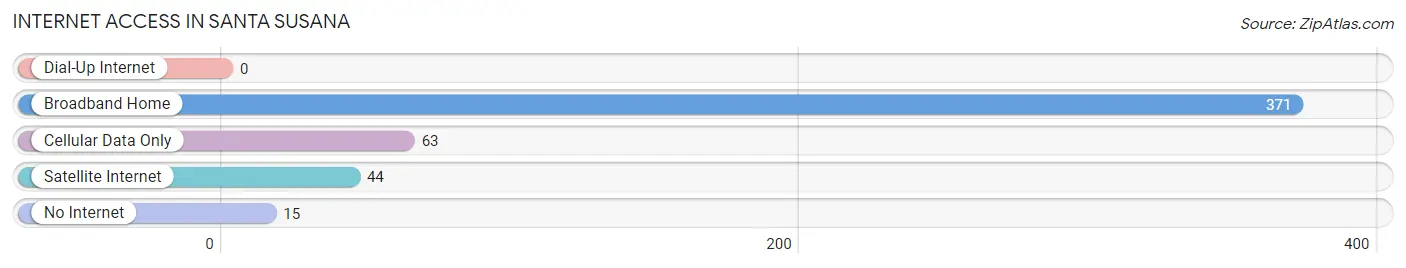
| Internet Type | # Households | % Households |
| Dial-Up Internet | 0 | 0.0% |
| Broadband Home | 371 | 82.6% |
| Cellular Data Only | 63 | 14.0% |
| Satellite Internet | 44 | 9.8% |
| No Internet | 15 | 3.3% |
| Total | 449 | 100.0% |
Santa Susana Summary
Santa Susana, California is a small unincorporated community located in the Simi Valley of Ventura County, California. It is located approximately 30 miles northwest of downtown Los Angeles and is bordered by the cities of Simi Valley, Chatsworth, and West Hills. The population of Santa Susana was estimated to be 1,945 in 2019.
History
The area now known as Santa Susana was originally inhabited by the Chumash people, who lived in the area for thousands of years before the arrival of Europeans. The first Europeans to settle in the area were Spanish missionaries, who established the Mission San Fernando Rey de España in 1797. The mission was the first of its kind in the area and served as a base for the Spanish colonization of California.
In 1845, the Mexican government granted the land that is now Santa Susana to Don Antonio del Valle, who established a large ranch in the area. The ranch was later sold to the San Fernando Homestead Association, which subdivided the land and sold it to settlers. The area was known as "Santa Susana" after the nearby Santa Susana Mountains.
In the late 19th century, the area began to develop as a small agricultural community. The Santa Susana Railroad was built in 1887, connecting the area to Los Angeles and Ventura. The railroad allowed for the development of the area's agricultural industry, which included citrus and avocado groves, as well as dairy farms.
In the early 20th century, the area began to develop as a residential community. The Santa Susana Knolls area was developed in the 1920s, and the Santa Susana Pass State Historic Park was established in the 1930s.
Geography
Santa Susana is located in the Simi Valley of Ventura County, California. It is bordered by the cities of Simi Valley, Chatsworth, and West Hills. The Santa Susana Mountains are located to the north of the community, and the Santa Susana Pass State Historic Park is located to the east.
The area has a Mediterranean climate, with hot, dry summers and mild, wet winters. The average annual temperature is 68°F (20°C), and the average annual precipitation is 17.5 inches (44.5 cm).
Economy
The economy of Santa Susana is largely based on agriculture and light industry. The area is home to several large agricultural operations, including citrus and avocado groves, as well as dairy farms. The area is also home to several light industrial businesses, including aerospace and defense contractors.
Demographics
As of 2019, the population of Santa Susana was estimated to be 1,945. The racial makeup of the community was 79.3% White, 8.2% Hispanic or Latino, 6.2% Asian, and 4.3% African American. The median household income was $76,944, and the median home value was $619,000. The median age was 44.7 years.
Common Questions
What is Per Capita Income in Santa Susana?
Per Capita income in Santa Susana is $57,937.
What is Income or Wage Gap in Santa Susana?
Income or Wage Gap in Santa Susana is 44.1%.
Women in Santa Susana earn 55.9 cents for every dollar earned by a man.
What is Inequality or Gini Index in Santa Susana?
Inequality or Gini Index in Santa Susana is 0.51.
What is the Total Population of Santa Susana?
Total Population of Santa Susana is 1,132.
What is the Total Male Population of Santa Susana?
Total Male Population of Santa Susana is 569.
What is the Total Female Population of Santa Susana?
Total Female Population of Santa Susana is 563.
What is the Ratio of Males per 100 Females in Santa Susana?
There are 101.07 Males per 100 Females in Santa Susana.
What is the Ratio of Females per 100 Males in Santa Susana?
There are 98.95 Females per 100 Males in Santa Susana.
What is the Median Population Age in Santa Susana?
Median Population Age in Santa Susana is 45.5 Years.
What is the Average Family Size in Santa Susana
Average Family Size in Santa Susana is 3.5 People.
What is the Average Household Size in Santa Susana
Average Household Size in Santa Susana is 2.5 People.
How Large is the Labor Force in Santa Susana?
There are 638 People in the Labor Forcein in Santa Susana.
What is the Percentage of People in the Labor Force in Santa Susana?
75.7% of People are in the Labor Force in Santa Susana.
What is the Unemployment Rate in Santa Susana?
Unemployment Rate in Santa Susana is 9.6%.