Cities with the Highest Percentage of Filipino Population in California
RELATED REPORTS & OPTIONS
Filipino
California
Compare Cities
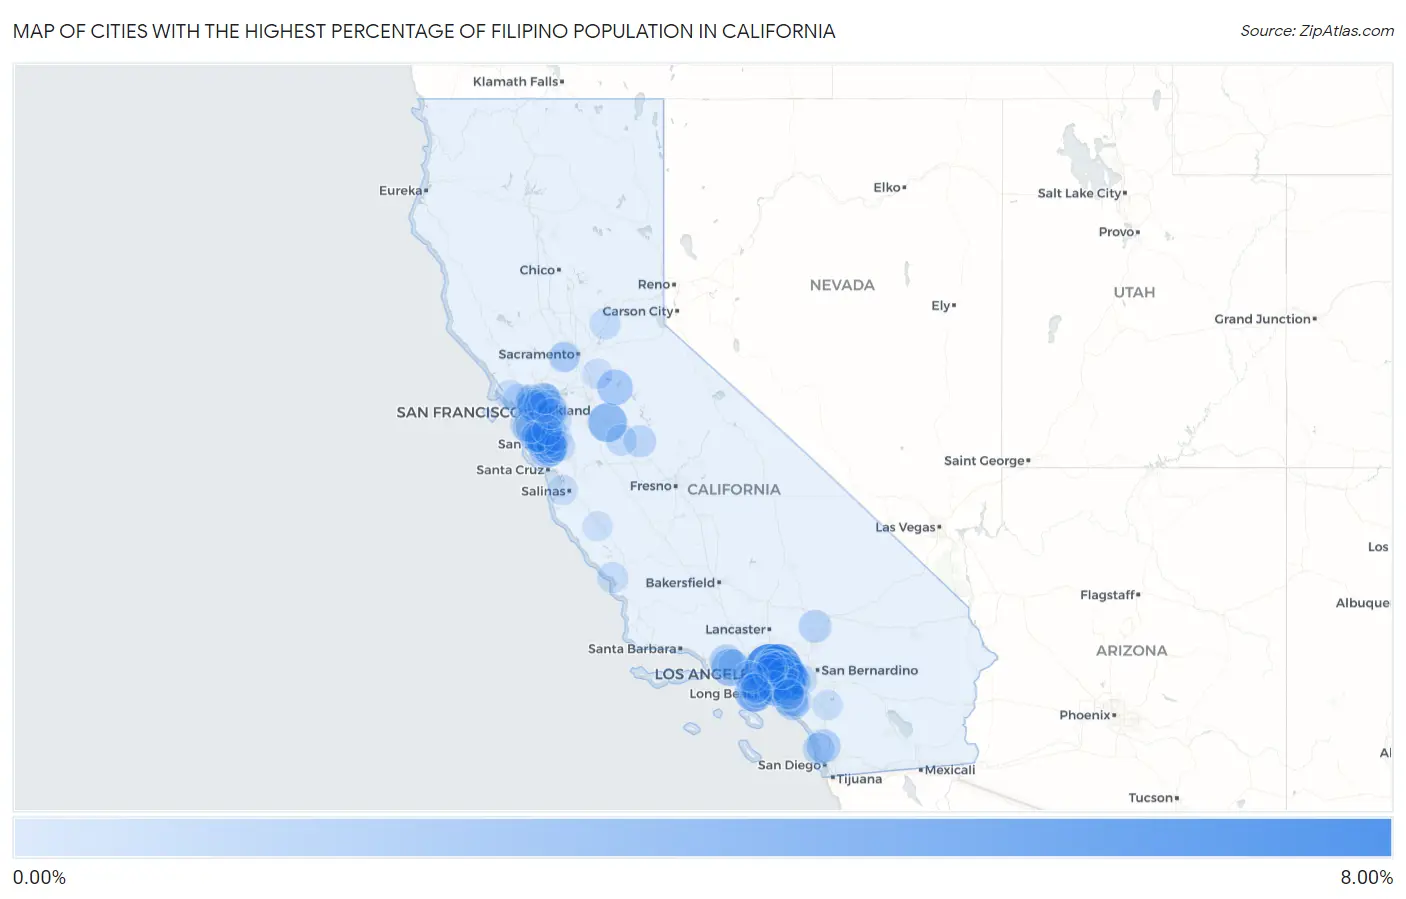
Map of Cities with the Highest Percentage of Filipino Population in California
0.00%
8.00%
Cities with the Highest Percentage of Filipino Population in California
| City | Filipino | vs State | vs National | |
| 1. | San Marino | 7.10% | 0.31%(+6.79)#1 | 0.085%(+7.01)#2 |
| 2. | Arcadia | 5.35% | 0.31%(+5.05)#2 | 0.085%(+5.27)#6 |
| 3. | Bradbury | 5.35% | 0.31%(+5.04)#3 | 0.085%(+5.26)#7 |
| 4. | Rowland Heights | 4.59% | 0.31%(+4.29)#4 | 0.085%(+4.51)#8 |
| 5. | Walnut | 4.36% | 0.31%(+4.06)#5 | 0.085%(+4.28)#9 |
| 6. | Diamond Bar | 3.68% | 0.31%(+3.37)#6 | 0.085%(+3.60)#12 |
| 7. | East San Gabriel | 3.54% | 0.31%(+3.23)#7 | 0.085%(+3.45)#14 |
| 8. | Airport | 3.53% | 0.31%(+3.23)#8 | 0.085%(+3.45)#15 |
| 9. | Palos Verdes Estates | 3.22% | 0.31%(+2.92)#9 | 0.085%(+3.14)#21 |
| 10. | Saratoga | 3.14% | 0.31%(+2.84)#10 | 0.085%(+3.06)#24 |
| 11. | Cerritos | 3.05% | 0.31%(+2.75)#11 | 0.085%(+2.97)#26 |
| 12. | Westlake Village | 2.93% | 0.31%(+2.62)#12 | 0.085%(+2.85)#28 |
| 13. | Cupertino | 2.81% | 0.31%(+2.51)#13 | 0.085%(+2.73)#30 |
| 14. | Hacienda Heights | 2.60% | 0.31%(+2.30)#14 | 0.085%(+2.52)#33 |
| 15. | Temple City | 2.54% | 0.31%(+2.23)#15 | 0.085%(+2.45)#34 |
| 16. | Chino Hills | 2.46% | 0.31%(+2.16)#16 | 0.085%(+2.38)#36 |
| 17. | Rancho Calaveras | 2.43% | 0.31%(+2.12)#17 | 0.085%(+2.35)#38 |
| 18. | Los Altos Hills | 2.42% | 0.31%(+2.11)#18 | 0.085%(+2.33)#39 |
| 19. | Irvine | 2.33% | 0.31%(+2.02)#19 | 0.085%(+2.25)#43 |
| 20. | University Of California-Santa Barbara | 2.14% | 0.31%(+1.83)#20 | 0.085%(+2.06)#50 |
| 21. | Reliez Valley | 2.13% | 0.31%(+1.82)#21 | 0.085%(+2.05)#51 |
| 22. | San Miguel Cdp Contra Costa County | 2.00% | 0.31%(+1.69)#22 | 0.085%(+1.91)#57 |
| 23. | Rancho Palos Verdes | 1.99% | 0.31%(+1.69)#23 | 0.085%(+1.91)#59 |
| 24. | Mountain View | 1.93% | 0.31%(+1.63)#24 | 0.085%(+1.85)#61 |
| 25. | Highlands | 1.90% | 0.31%(+1.60)#25 | 0.085%(+1.82)#64 |
| 26. | Albany | 1.90% | 0.31%(+1.60)#26 | 0.085%(+1.82)#65 |
| 27. | South Monrovia Island | 1.89% | 0.31%(+1.58)#27 | 0.085%(+1.80)#66 |
| 28. | Fairbanks Ranch | 1.86% | 0.31%(+1.55)#28 | 0.085%(+1.77)#69 |
| 29. | Fremont | 1.78% | 0.31%(+1.47)#29 | 0.085%(+1.69)#73 |
| 30. | Sierra Madre | 1.77% | 0.31%(+1.46)#30 | 0.085%(+1.68)#74 |
| 31. | Santa Rosa Valley | 1.75% | 0.31%(+1.45)#31 | 0.085%(+1.67)#75 |
| 32. | San Dimas | 1.67% | 0.31%(+1.36)#32 | 0.085%(+1.58)#79 |
| 33. | San Gabriel | 1.67% | 0.31%(+1.36)#33 | 0.085%(+1.58)#80 |
| 34. | Alamo | 1.59% | 0.31%(+1.28)#34 | 0.085%(+1.50)#86 |
| 35. | Laguna Woods | 1.54% | 0.31%(+1.23)#35 | 0.085%(+1.45)#91 |
| 36. | Silver Lakes | 1.52% | 0.31%(+1.21)#36 | 0.085%(+1.43)#94 |
| 37. | Palo Alto | 1.47% | 0.31%(+1.16)#37 | 0.085%(+1.38)#97 |
| 38. | Alhambra | 1.46% | 0.31%(+1.16)#38 | 0.085%(+1.38)#98 |
| 39. | Los Altos | 1.46% | 0.31%(+1.15)#39 | 0.085%(+1.37)#99 |
| 40. | Cypress | 1.41% | 0.31%(+1.11)#40 | 0.085%(+1.33)#104 |
| 41. | University Of California Merced | 1.39% | 0.31%(+1.08)#41 | 0.085%(+1.31)#109 |
| 42. | Millbrae | 1.39% | 0.31%(+1.08)#42 | 0.085%(+1.30)#110 |
| 43. | Monrovia | 1.36% | 0.31%(+1.06)#43 | 0.085%(+1.28)#116 |
| 44. | Monte Sereno | 1.36% | 0.31%(+1.06)#44 | 0.085%(+1.28)#117 |
| 45. | Brea | 1.35% | 0.31%(+1.04)#45 | 0.085%(+1.26)#120 |
| 46. | Foster City | 1.34% | 0.31%(+1.03)#46 | 0.085%(+1.25)#121 |
| 47. | Yorba Linda | 1.29% | 0.31%(+0.983)#47 | 0.085%(+1.21)#131 |
| 48. | Del Mar | 1.29% | 0.31%(+0.982)#48 | 0.085%(+1.20)#132 |
| 49. | South Pasadena | 1.28% | 0.31%(+0.976)#49 | 0.085%(+1.20)#134 |
| 50. | La Palma | 1.26% | 0.31%(+0.949)#50 | 0.085%(+1.17)#136 |
| 51. | Emeryville | 1.25% | 0.31%(+0.939)#51 | 0.085%(+1.16)#138 |
| 52. | Hillsborough | 1.23% | 0.31%(+0.919)#52 | 0.085%(+1.14)#142 |
| 53. | Piedmont | 1.21% | 0.31%(+0.902)#53 | 0.085%(+1.12)#145 |
| 54. | Sunnyvale | 1.20% | 0.31%(+0.888)#54 | 0.085%(+1.11)#148 |
| 55. | Kentfield | 1.16% | 0.31%(+0.853)#55 | 0.085%(+1.08)#152 |
| 56. | Livingston | 1.09% | 0.31%(+0.787)#56 | 0.085%(+1.01)#167 |
| 57. | Santa Clara | 1.09% | 0.31%(+0.787)#57 | 0.085%(+1.01)#168 |
| 58. | Eastvale | 1.09% | 0.31%(+0.782)#58 | 0.085%(+1.00)#169 |
| 59. | Manhattan Beach | 1.07% | 0.31%(+0.766)#59 | 0.085%(+0.989)#173 |
| 60. | Villa Park | 1.07% | 0.31%(+0.759)#60 | 0.085%(+0.982)#175 |
| 61. | West Menlo Park | 1.06% | 0.31%(+0.751)#61 | 0.085%(+0.974)#176 |
| 62. | Campbell | 1.04% | 0.31%(+0.733)#62 | 0.085%(+0.955)#182 |
| 63. | East Richmond Heights | 1.00% | 0.31%(+0.697)#63 | 0.085%(+0.920)#187 |
| 64. | Danville | 0.99% | 0.31%(+0.687)#64 | 0.085%(+0.909)#188 |
| 65. | Meadow Vista | 0.98% | 0.31%(+0.668)#65 | 0.085%(+0.890)#193 |
| 66. | Orinda | 0.97% | 0.31%(+0.663)#66 | 0.085%(+0.886)#195 |
| 67. | Cayucos | 0.93% | 0.31%(+0.625)#67 | 0.085%(+0.847)#204 |
| 68. | Lake Forest | 0.93% | 0.31%(+0.624)#68 | 0.085%(+0.846)#205 |
| 69. | Artesia | 0.92% | 0.31%(+0.611)#69 | 0.085%(+0.833)#209 |
| 70. | Woodside | 0.91% | 0.31%(+0.606)#70 | 0.085%(+0.828)#211 |
| 71. | Oak Park | 0.91% | 0.31%(+0.603)#71 | 0.085%(+0.825)#212 |
| 72. | Tustin | 0.90% | 0.31%(+0.597)#72 | 0.085%(+0.819)#213 |
| 73. | Rolling Hills Estates | 0.90% | 0.31%(+0.594)#73 | 0.085%(+0.816)#215 |
| 74. | Pleasanton | 0.88% | 0.31%(+0.575)#74 | 0.085%(+0.797)#221 |
| 75. | North Tustin | 0.87% | 0.31%(+0.560)#75 | 0.085%(+0.783)#224 |
| 76. | Davis | 0.87% | 0.31%(+0.559)#76 | 0.085%(+0.781)#225 |
| 77. | Monterey Park | 0.86% | 0.31%(+0.557)#77 | 0.085%(+0.780)#226 |
| 78. | Stanford | 0.84% | 0.31%(+0.533)#78 | 0.085%(+0.756)#234 |
| 79. | West Covina | 0.81% | 0.31%(+0.506)#79 | 0.085%(+0.729)#243 |
| 80. | Milpitas | 0.81% | 0.31%(+0.505)#80 | 0.085%(+0.727)#246 |
| 81. | Berkeley | 0.81% | 0.31%(+0.501)#81 | 0.085%(+0.723)#248 |
| 82. | San Ramon | 0.80% | 0.31%(+0.498)#82 | 0.085%(+0.720)#250 |
| 83. | Clay | 0.80% | 0.31%(+0.496)#83 | 0.085%(+0.718)#251 |
| 84. | Redondo Beach | 0.80% | 0.31%(+0.489)#84 | 0.085%(+0.711)#254 |
| 85. | San Mateo | 0.79% | 0.31%(+0.486)#85 | 0.085%(+0.708)#255 |
| 86. | French Valley | 0.79% | 0.31%(+0.486)#86 | 0.085%(+0.708)#256 |
| 87. | San Jose | 0.78% | 0.31%(+0.471)#87 | 0.085%(+0.693)#260 |
| 88. | Moraga | 0.77% | 0.31%(+0.458)#88 | 0.085%(+0.680)#264 |
| 89. | Marina | 0.75% | 0.31%(+0.443)#89 | 0.085%(+0.666)#270 |
| 90. | Lagunitas Forest Knolls | 0.74% | 0.31%(+0.437)#90 | 0.085%(+0.659)#273 |
| 91. | Pasadena | 0.74% | 0.31%(+0.436)#91 | 0.085%(+0.658)#275 |
| 92. | Norris Canyon | 0.73% | 0.31%(+0.427)#92 | 0.085%(+0.649)#279 |
| 93. | East Pasadena | 0.73% | 0.31%(+0.424)#93 | 0.085%(+0.646)#283 |
| 94. | Pleasant Hill | 0.73% | 0.31%(+0.423)#94 | 0.085%(+0.646)#284 |
| 95. | Culver City | 0.72% | 0.31%(+0.411)#95 | 0.085%(+0.634)#288 |
| 96. | Pine Canyon | 0.72% | 0.31%(+0.410)#96 | 0.085%(+0.632)#289 |
| 97. | Santa Monica | 0.71% | 0.31%(+0.401)#97 | 0.085%(+0.624)#293 |
| 98. | University Of California Davis | 0.70% | 0.31%(+0.398)#98 | 0.085%(+0.620)#295 |
| 99. | Torrance | 0.69% | 0.31%(+0.382)#99 | 0.085%(+0.605)#300 |
| 100. | Newark | 0.67% | 0.31%(+0.367)#100 | 0.085%(+0.589)#311 |
Common Questions
What are the Top 10 Cities with the Highest Percentage of Filipino Population in California?
Top 10 Cities with the Highest Percentage of Filipino Population in California are:
#1
7.10%
#2
5.35%
#3
5.35%
#4
4.59%
#5
4.36%
#6
3.68%
#7
3.54%
#8
3.53%
#9
3.22%
#10
3.14%
What city has the Highest Percentage of Filipino Population in California?
San Marino has the Highest Percentage of Filipino Population in California with 7.10%.
What is the Percentage of Filipino Population in the State of California?
Percentage of Filipino Population in California is 0.31%.
What is the Percentage of Filipino Population in the United States?
Percentage of Filipino Population in the United States is 0.085%.