Zip Codes with the Highest Percentage of Population Employed in Installation, Maintenance & Repair in San Luis Obispo, CA
RELATED REPORTS & OPTIONS
Installation, Maintenance & Repair
San Luis Obispo
Compare Zip Codes
Map of Zip Codes with the Highest Percentage of Population Employed in Installation, Maintenance & Repair in San Luis Obispo
0.28%
1.9%
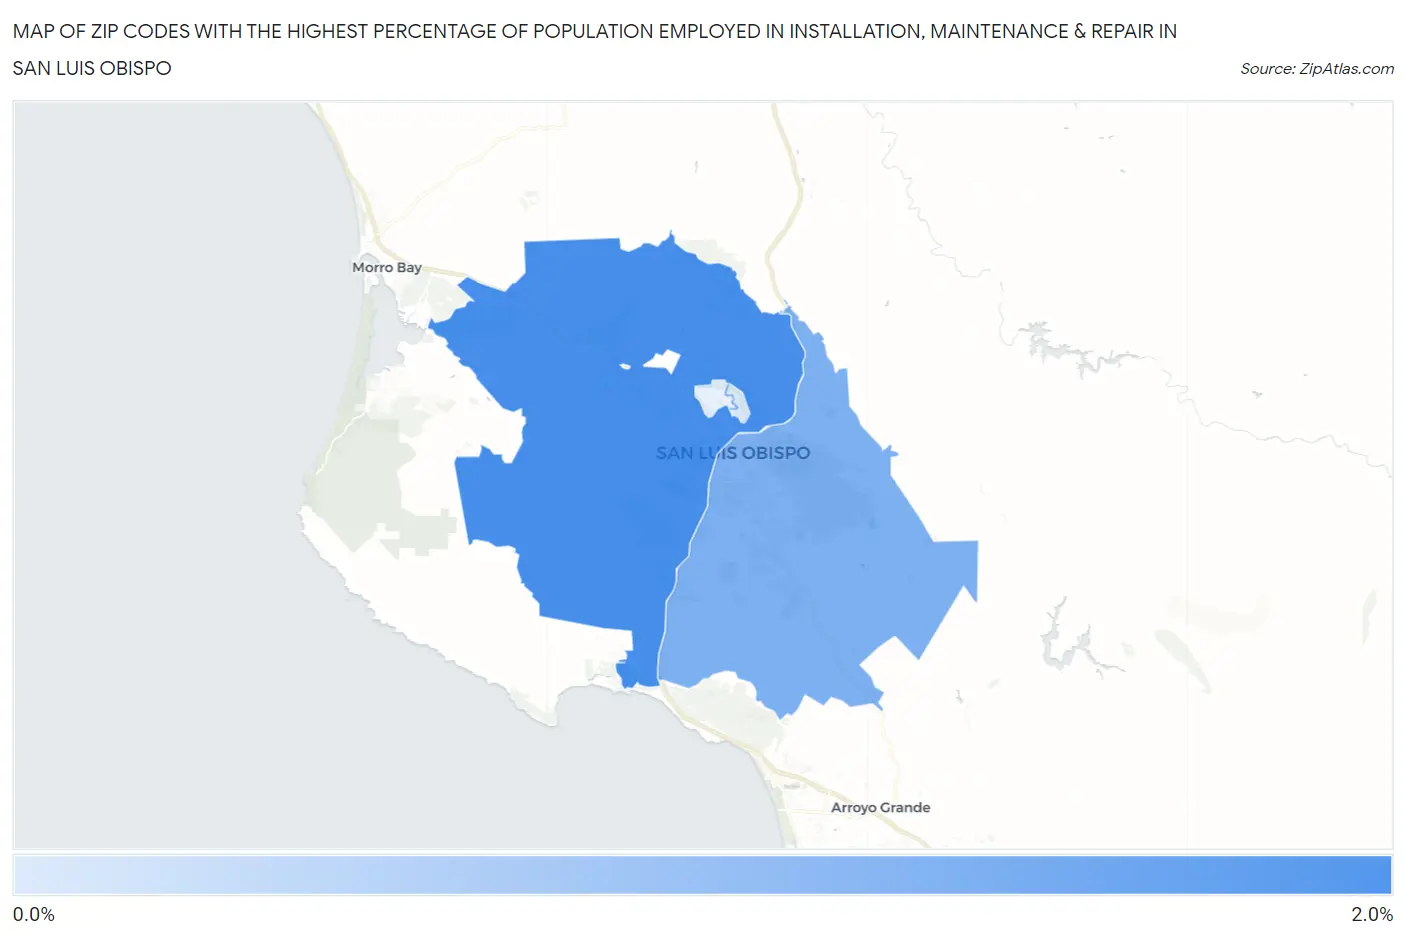
Zip Codes with the Highest Percentage of Population Employed in Installation, Maintenance & Repair in San Luis Obispo, CA
| Zip Code | % Employed | vs State | vs National | |
| 1. | 93405 | 1.9% | 2.6%(-0.624)#997 | 3.1%(-1.14)#22,323 |
| 2. | 93401 | 1.4% | 2.6%(-1.20)#1,156 | 3.1%(-1.71)#24,709 |
| 3. | 93410 | 0.28% | 2.6%(-2.28)#1,418 | 3.1%(-2.79)#27,593 |
1
Common Questions
What are the Top 3 Zip Codes with the Highest Percentage of Population Employed in Installation, Maintenance & Repair in San Luis Obispo, CA?
Top 3 Zip Codes with the Highest Percentage of Population Employed in Installation, Maintenance & Repair in San Luis Obispo, CA are:
What zip code has the Highest Percentage of Population Employed in Installation, Maintenance & Repair in San Luis Obispo, CA?
93405 has the Highest Percentage of Population Employed in Installation, Maintenance & Repair in San Luis Obispo, CA with 1.9%.
What is the Percentage of Population Employed in Installation, Maintenance & Repair in San Luis Obispo, CA?
Percentage of Population Employed in Installation, Maintenance & Repair in San Luis Obispo is 1.4%.
What is the Percentage of Population Employed in Installation, Maintenance & Repair in California?
Percentage of Population Employed in Installation, Maintenance & Repair in California is 2.6%.
What is the Percentage of Population Employed in Installation, Maintenance & Repair in the United States?
Percentage of Population Employed in Installation, Maintenance & Repair in the United States is 3.1%.