Idaho Map & Demographics
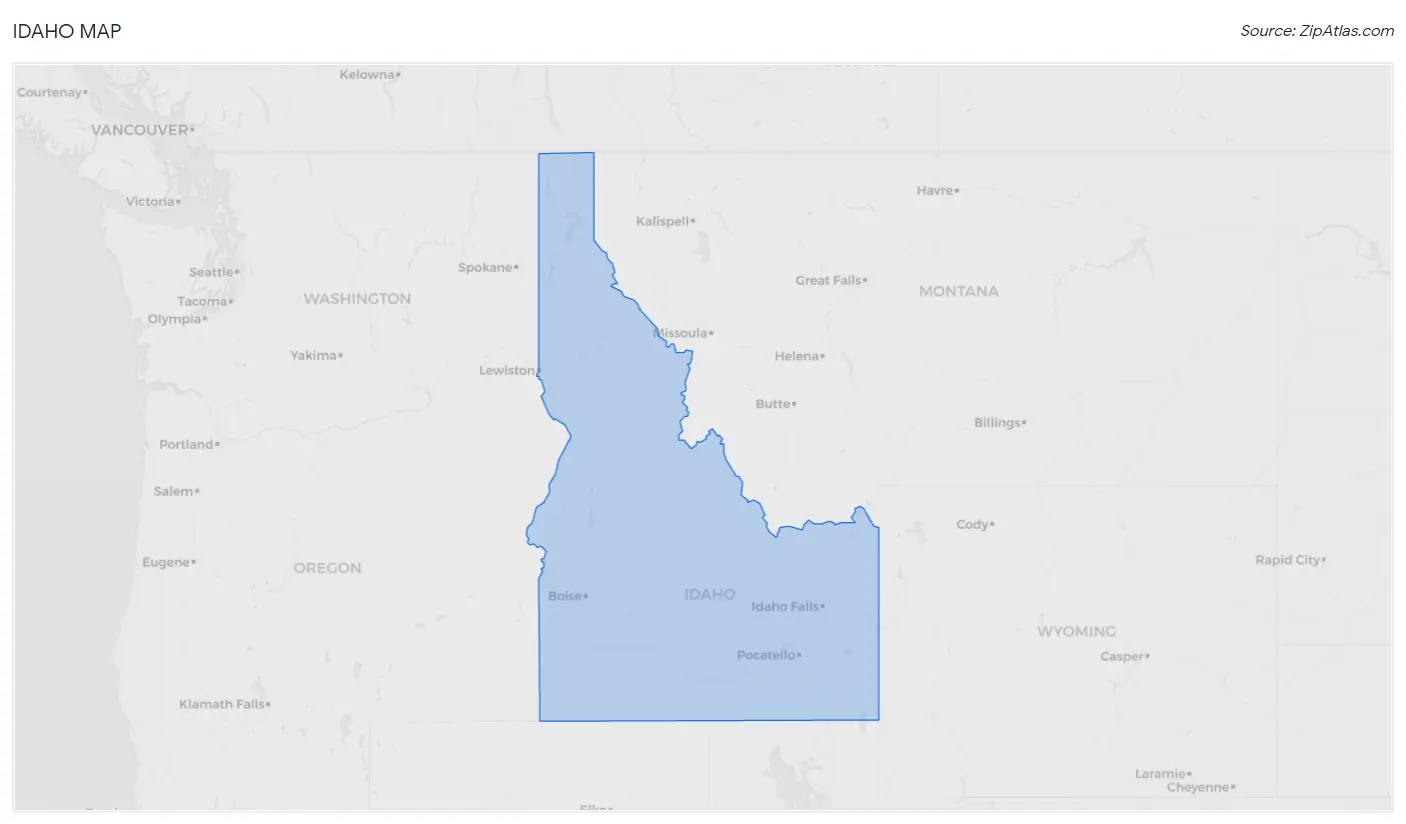
Idaho Map
Idaho Overview
Jul 3, 1890
INCORPORATED
83,568
TOTAL AREA [ SQ MI ]
82,643
LAND AREA [ SQ MI ]
926
WATER AREA [ SQ MI ]
5,000
ELEVATION AVG [ FT ]
12,662
ELEVATION HIGH [ FT ]
710
ELEVATION LOW [ FT ]
22.4
POP DENSITY [ PPL / SQ MI ]
$34,919
PER CAPITA INCOME
$83,640
AVG FAMILY INCOME
$70,214
AVG HOUSEHOLD INCOME
36.3%
WAGE / INCOME GAP [ % ]
63.7¢/ $1
WAGE / INCOME GAP [ $ ]
$10,506
FAMILY INCOME DEFICIT
0.44
INEQUALITY / GINI INDEX
83646
LARGEST ZIP CODE
Boise City
LARGEST CITY
Ada County
LARGEST COUNTY
1,854,109
TOTAL POPULATION
933,728
MALE POPULATION
920,381
FEMALE POPULATION
101.45
MALES / 100 FEMALES
98.57
FEMALES / 100 MALES
36.9
MEDIAN AGE
3.2
AVG FAMILY SIZE
2.7
AVG HOUSEHOLD SIZE
912,969
LABOR FORCE [ PEOPLE ]
62.9%
PERCENT IN LABOR FORCE
3.8%
UNEMPLOYMENT RATE
Idaho Area Codes
Income in Idaho
Income Overview in Idaho
Per Capita Income in Idaho is $34,919, while median incomes of families and households are $83,640 and $70,214 respectively.
| Characteristic | Number | Measure |
| Per Capita Income | 1,854,109 | $34,919 |
| Median Family Income | 462,093 | $83,640 |
| Mean Family Income | 462,093 | $107,118 |
| Median Household Income | 675,323 | $70,214 |
| Mean Household Income | 675,323 | $92,780 |
| Income Deficit | 462,093 | $10,506 |
| Wage / Income Gap (%) | 1,854,109 | 36.34% |
| Wage / Income Gap ($) | 1,854,109 | 63.66¢ per $1 |
| Gini / Inequality Index | 1,854,109 | 0.44 |
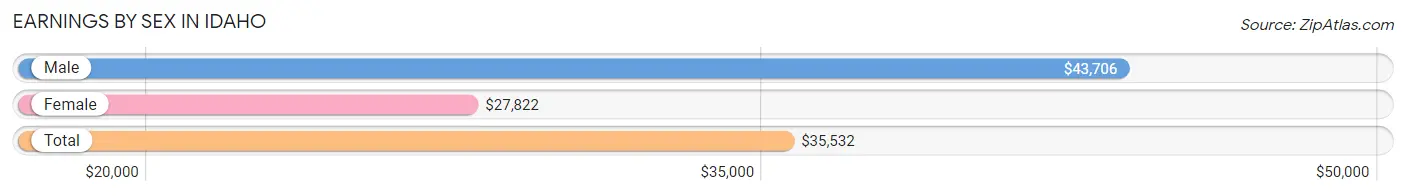
Earnings by Sex in Idaho
Average Earnings in Idaho are $35,532, $43,706 for men and $27,822 for women, a difference of 36.3%.
| Sex | Number | Average Earnings |
| Male | 535,463 (54.3%) | $43,706 |
| Female | 450,194 (45.7%) | $27,822 |
| Total | 985,657 (100.0%) | $35,532 |
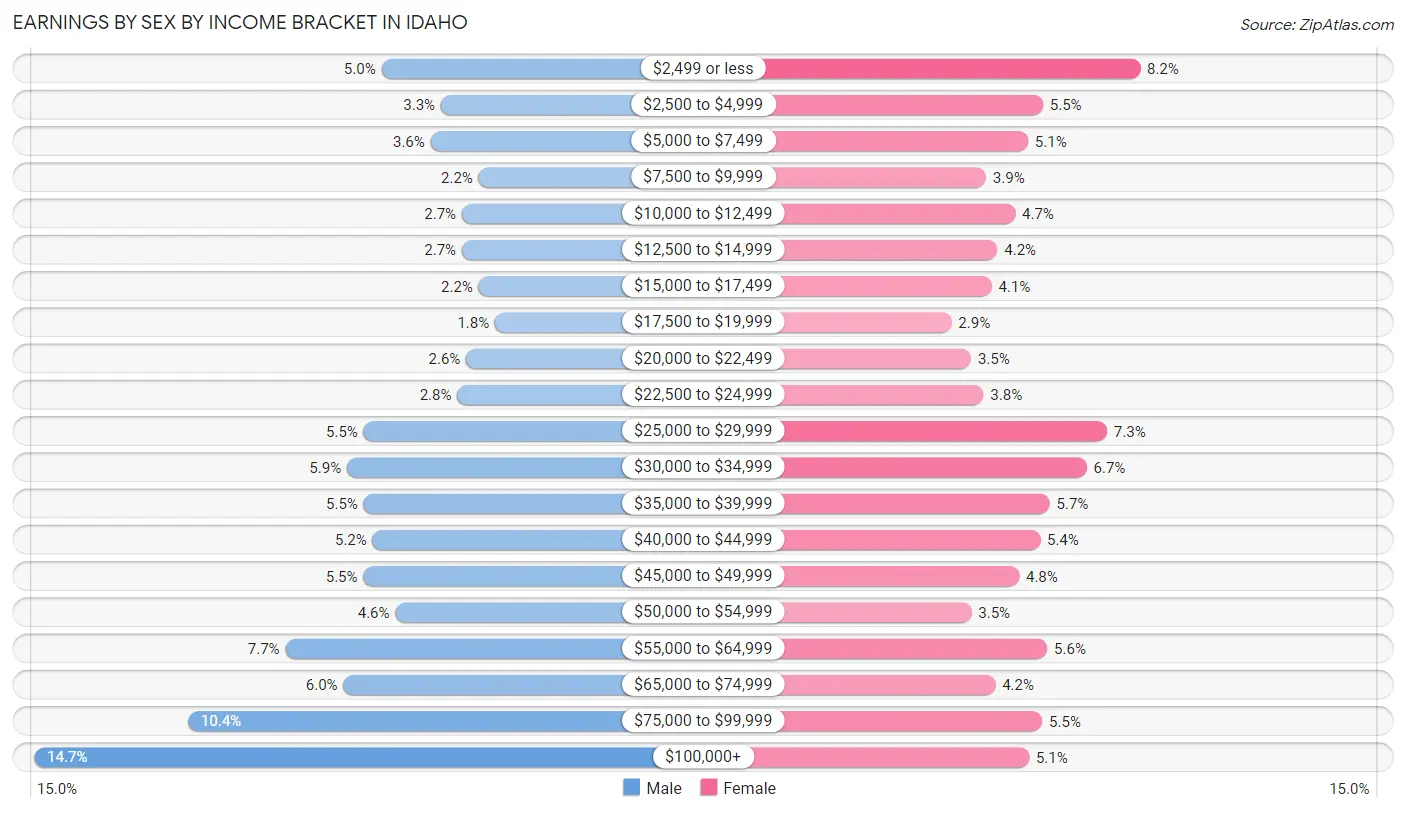
Earnings by Sex by Income Bracket in Idaho
The most common earnings brackets in Idaho are $100,000+ for men (78,890 | 14.7%) and $2,499 or less for women (37,112 | 8.2%).
| Income | Male | Female |
| $2,499 or less | 26,630 (5.0%) | 37,112 (8.2%) |
| $2,500 to $4,999 | 17,652 (3.3%) | 24,807 (5.5%) |
| $5,000 to $7,499 | 19,214 (3.6%) | 22,930 (5.1%) |
| $7,500 to $9,999 | 12,009 (2.2%) | 17,606 (3.9%) |
| $10,000 to $12,499 | 14,489 (2.7%) | 21,310 (4.7%) |
| $12,500 to $14,999 | 14,501 (2.7%) | 19,055 (4.2%) |
| $15,000 to $17,499 | 11,986 (2.2%) | 18,326 (4.1%) |
| $17,500 to $19,999 | 9,525 (1.8%) | 13,232 (2.9%) |
| $20,000 to $22,499 | 13,878 (2.6%) | 15,723 (3.5%) |
| $22,500 to $24,999 | 15,231 (2.8%) | 17,285 (3.8%) |
| $25,000 to $29,999 | 29,271 (5.5%) | 32,924 (7.3%) |
| $30,000 to $34,999 | 31,832 (5.9%) | 30,332 (6.7%) |
| $35,000 to $39,999 | 29,308 (5.5%) | 25,652 (5.7%) |
| $40,000 to $44,999 | 27,974 (5.2%) | 24,466 (5.4%) |
| $45,000 to $49,999 | 29,356 (5.5%) | 21,775 (4.8%) |
| $50,000 to $54,999 | 24,542 (4.6%) | 15,779 (3.5%) |
| $55,000 to $64,999 | 41,096 (7.7%) | 25,345 (5.6%) |
| $65,000 to $74,999 | 32,349 (6.0%) | 18,759 (4.2%) |
| $75,000 to $99,999 | 55,730 (10.4%) | 24,716 (5.5%) |
| $100,000+ | 78,890 (14.7%) | 23,060 (5.1%) |
| Total | 535,463 (100.0%) | 450,194 (100.0%) |
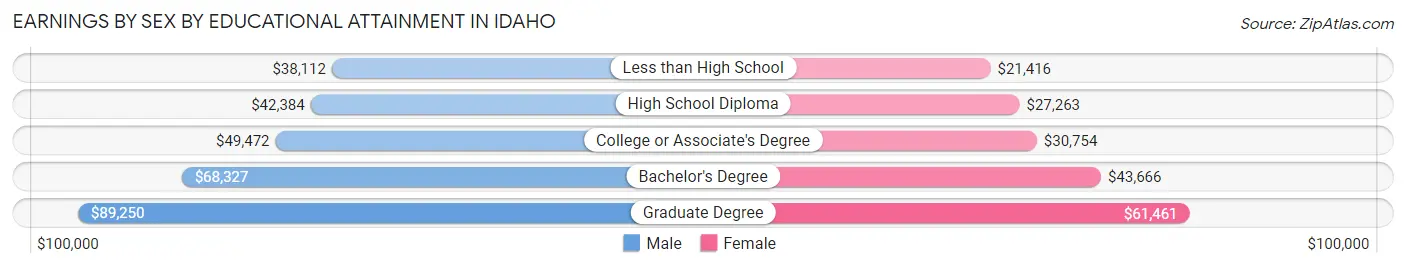
Earnings by Sex by Educational Attainment in Idaho
Average earnings in Idaho are $51,453 for men and $33,631 for women, a difference of 34.6%. Men with an educational attainment of graduate degree enjoy the highest average annual earnings of $89,250, while those with less than high school education earn the least with $38,112. Women with an educational attainment of graduate degree earn the most with the average annual earnings of $61,461, while those with less than high school education have the smallest earnings of $21,416.
| Educational Attainment | Male Income | Female Income |
| Less than High School | $38,112 | $21,416 |
| High School Diploma | $42,384 | $27,263 |
| College or Associate's Degree | $49,472 | $30,754 |
| Bachelor's Degree | $68,327 | $43,666 |
| Graduate Degree | $89,250 | $61,461 |
| Total | $51,453 | $33,631 |
Family Income in Idaho
Family Income Brackets in Idaho
According to the Idaho family income data, there are 99,350 families falling into the $100,000 to $149,999 income range, which is the most common income bracket and makes up 21.5% of all families. Conversely, the $10,000 to $14,999 income bracket is the least frequent group with only 7,393 families (1.6%) belonging to this category.
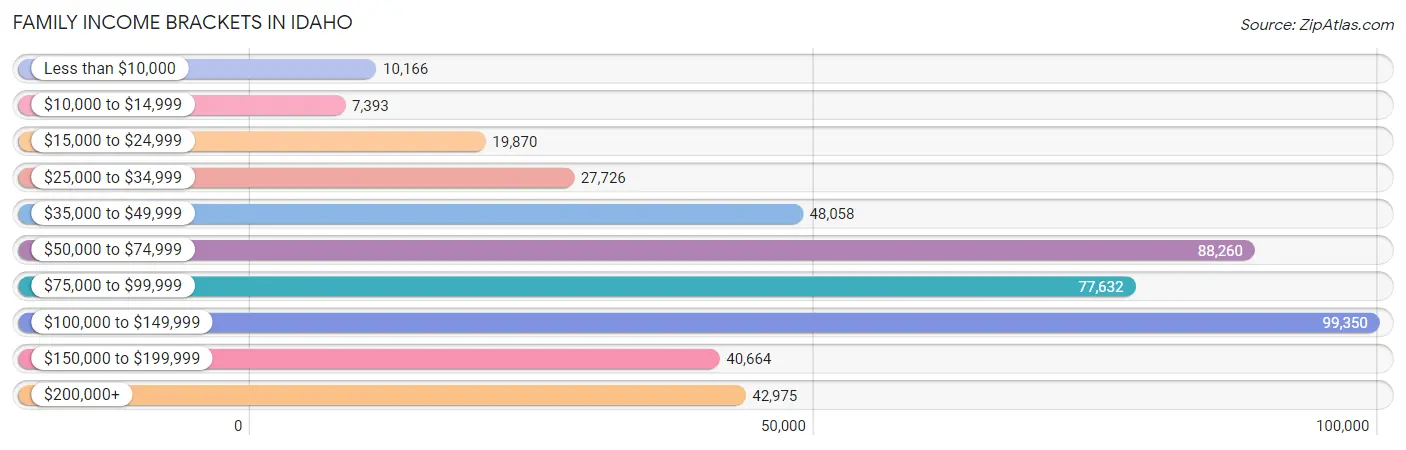
| Income Bracket | # Families | % Families |
| Less than $10,000 | 10,166 | 2.2% |
| $10,000 to $14,999 | 7,393 | 1.6% |
| $15,000 to $24,999 | 19,870 | 4.3% |
| $25,000 to $34,999 | 27,726 | 6.0% |
| $35,000 to $49,999 | 48,058 | 10.4% |
| $50,000 to $74,999 | 88,260 | 19.1% |
| $75,000 to $99,999 | 77,632 | 16.8% |
| $100,000 to $149,999 | 99,350 | 21.5% |
| $150,000 to $199,999 | 40,664 | 8.8% |
| $200,000+ | 42,975 | 9.3% |
Family Income by Famaliy Size in Idaho
7+ person families (12,258 | 2.6%) account for the highest median family income in Idaho with $100,126 per family, while 2-person families (223,692 | 48.4%) have the highest median income of $37,694 per family member.
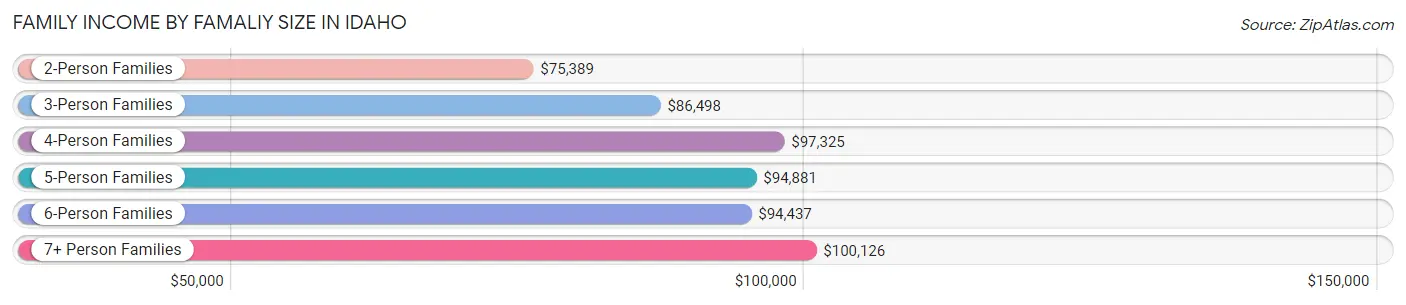
| Income Bracket | # Families | Median Income |
| 2-Person Families | 223,692 (48.4%) | $75,389 |
| 3-Person Families | 90,509 (19.6%) | $86,498 |
| 4-Person Families | 74,205 (16.1%) | $97,325 |
| 5-Person Families | 41,414 (9.0%) | $94,881 |
| 6-Person Families | 20,015 (4.3%) | $94,437 |
| 7+ Person Families | 12,258 (2.6%) | $100,126 |
| Total | 462,093 (100.0%) | $83,640 |
Family Income by Number of Earners in Idaho
The median family income in Idaho is $83,640, with families comprising 3+ earners (55,384) having the highest median family income of $124,456, while families with no earners (71,064) have the lowest median family income of $57,011, accounting for 12.0% and 15.4% of families, respectively.
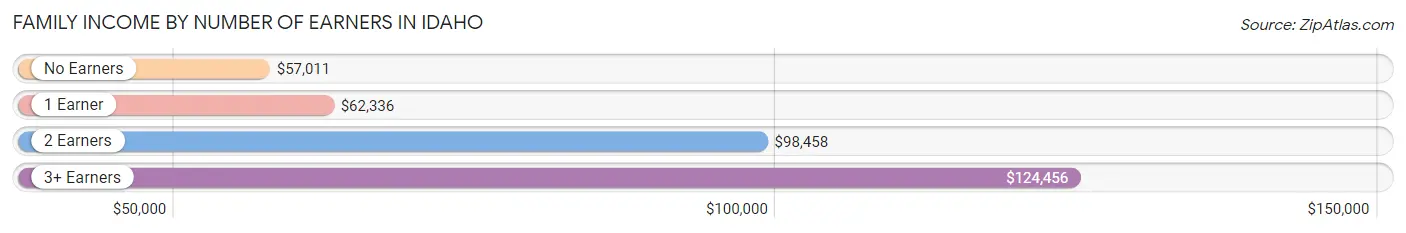
| Number of Earners | # Families | Median Income |
| No Earners | 71,064 (15.4%) | $57,011 |
| 1 Earner | 140,430 (30.4%) | $62,336 |
| 2 Earners | 195,215 (42.2%) | $98,458 |
| 3+ Earners | 55,384 (12.0%) | $124,456 |
| Total | 462,093 (100.0%) | $83,640 |
Household Income in Idaho
Household Income Brackets in Idaho
With 129,662 households falling in the category, the $50,000 to $74,999 income range is the most frequent in Idaho, accounting for 19.2% of all households. In contrast, only 22,286 households (3.3%) fall into the $10,000 to $14,999 income bracket, making it the least populous group.
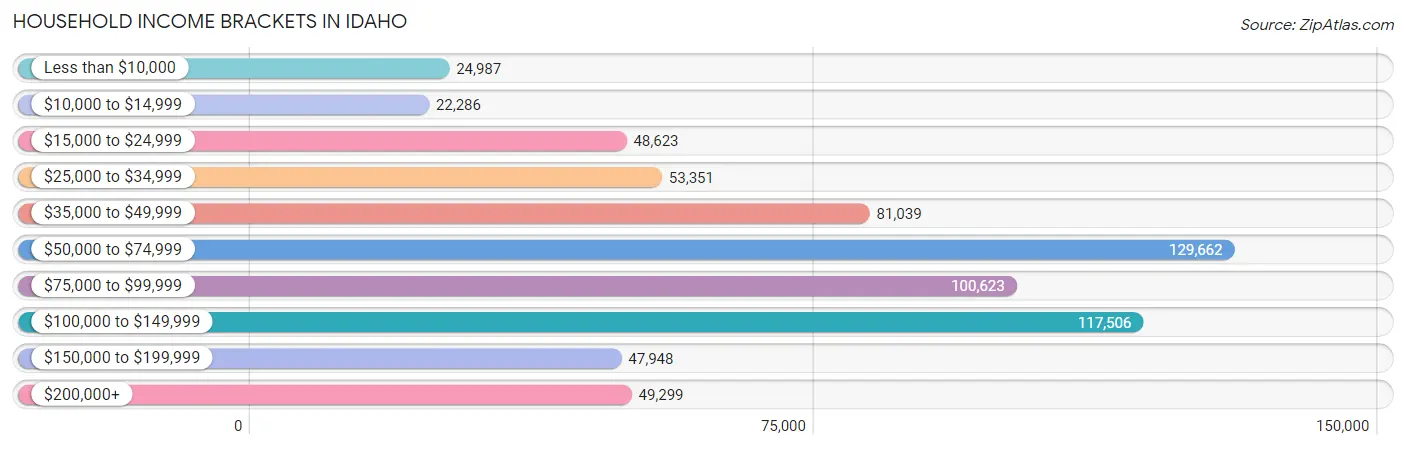
| Income Bracket | # Households | % Households |
| Less than $10,000 | 24,987 | 3.7% |
| $10,000 to $14,999 | 22,286 | 3.3% |
| $15,000 to $24,999 | 48,623 | 7.2% |
| $25,000 to $34,999 | 53,351 | 7.9% |
| $35,000 to $49,999 | 81,039 | 12.0% |
| $50,000 to $74,999 | 129,662 | 19.2% |
| $75,000 to $99,999 | 100,623 | 14.9% |
| $100,000 to $149,999 | 117,506 | 17.4% |
| $150,000 to $199,999 | 47,948 | 7.1% |
| $200,000+ | 49,299 | 7.3% |
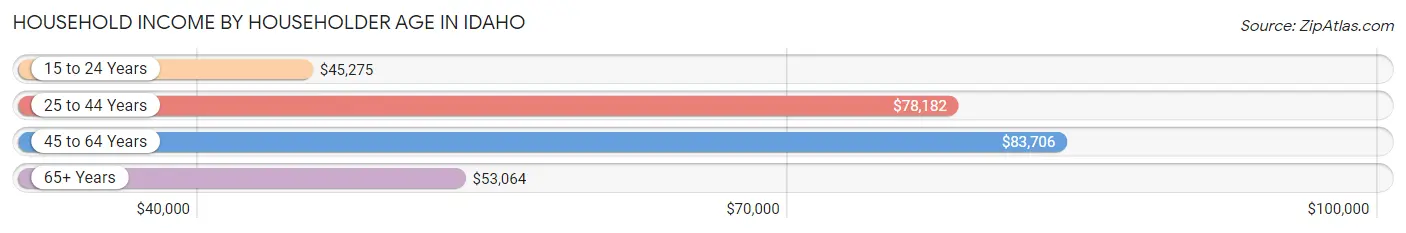
Household Income by Householder Age in Idaho
The median household income in Idaho is $70,214, with the highest median household income of $83,706 found in the 45 to 64 years age bracket for the primary householder. A total of 235,292 households (34.8%) fall into this category. Meanwhile, the 15 to 24 years age bracket for the primary householder has the lowest median household income of $45,275, with 33,605 households (5.0%) in this group.
| Income Bracket | # Households | Median Income |
| 15 to 24 Years | 33,605 (5.0%) | $45,275 |
| 25 to 44 Years | 223,074 (33.0%) | $78,182 |
| 45 to 64 Years | 235,292 (34.8%) | $83,706 |
| 65+ Years | 183,352 (27.2%) | $53,064 |
| Total | 675,323 (100.0%) | $70,214 |
Poverty in Idaho
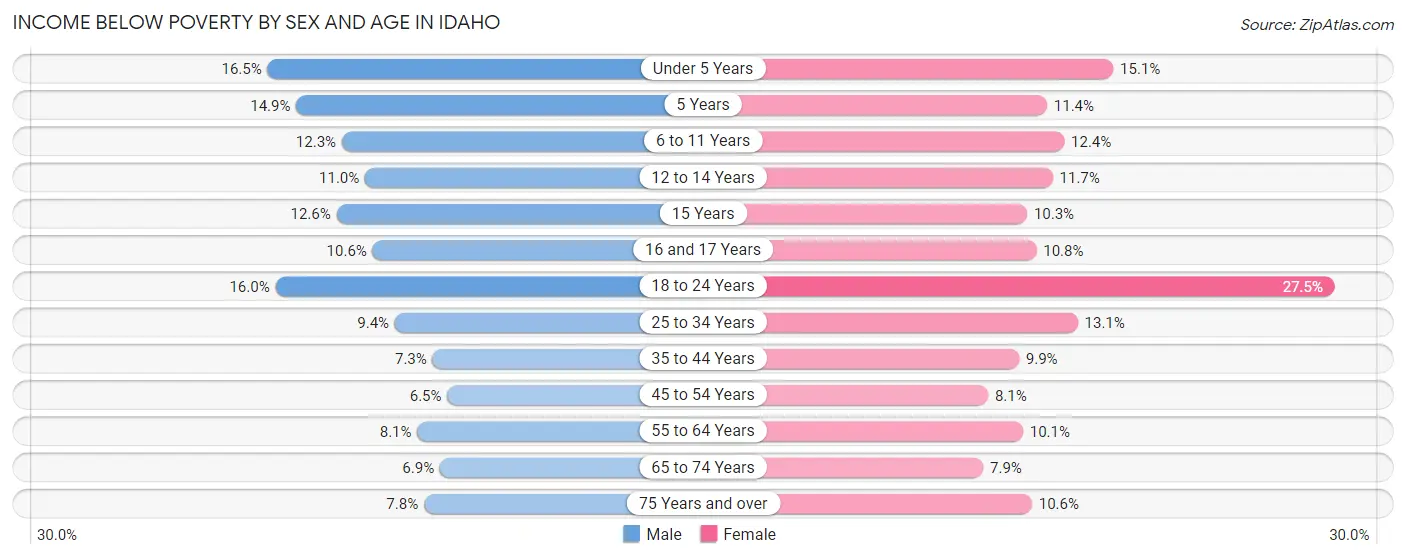
Income Below Poverty by Sex and Age in Idaho
With 9.8% poverty level for males and 12.2% for females among the residents of Idaho, under 5 year old males and 18 to 24 year old females are the most vulnerable to poverty, with 9,289 males (16.5%) and 22,297 females (27.5%) in their respective age groups living below the poverty level.
| Age Bracket | Male | Female |
| Under 5 Years | 9,289 (16.5%) | 8,232 (15.1%) |
| 5 Years | 1,881 (14.9%) | 1,353 (11.4%) |
| 6 to 11 Years | 9,575 (12.3%) | 9,072 (12.4%) |
| 12 to 14 Years | 4,559 (11.0%) | 4,731 (11.7%) |
| 15 Years | 1,836 (12.6%) | 1,485 (10.3%) |
| 16 and 17 Years | 2,877 (10.6%) | 2,645 (10.8%) |
| 18 to 24 Years | 13,401 (16.0%) | 22,297 (27.5%) |
| 25 to 34 Years | 11,165 (9.4%) | 15,232 (13.1%) |
| 35 to 44 Years | 8,676 (7.3%) | 11,422 (9.9%) |
| 45 to 54 Years | 6,822 (6.5%) | 8,245 (8.1%) |
| 55 to 64 Years | 8,855 (8.1%) | 11,215 (10.1%) |
| 65 to 74 Years | 6,131 (6.9%) | 7,314 (7.9%) |
| 75 Years and over | 3,978 (7.8%) | 6,500 (10.6%) |
| Total | 89,045 (9.8%) | 109,743 (12.2%) |
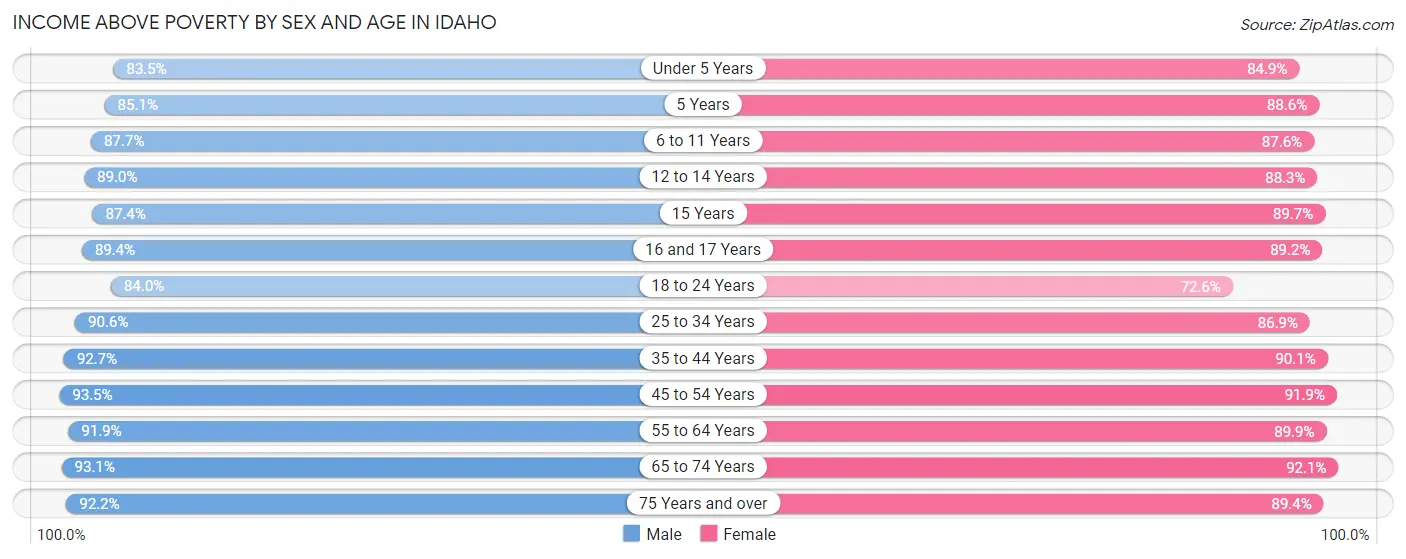
Income Above Poverty by Sex and Age in Idaho
According to the poverty statistics in Idaho, males aged 45 to 54 years and females aged 65 to 74 years are the age groups that are most secure financially, with 93.5% of males and 92.1% of females in these age groups living above the poverty line.
| Age Bracket | Male | Female |
| Under 5 Years | 47,123 (83.5%) | 46,262 (84.9%) |
| 5 Years | 10,768 (85.1%) | 10,495 (88.6%) |
| 6 to 11 Years | 68,055 (87.7%) | 64,180 (87.6%) |
| 12 to 14 Years | 36,725 (89.0%) | 35,557 (88.3%) |
| 15 Years | 12,697 (87.4%) | 12,912 (89.7%) |
| 16 and 17 Years | 24,201 (89.4%) | 21,776 (89.2%) |
| 18 to 24 Years | 70,191 (84.0%) | 58,922 (72.6%) |
| 25 to 34 Years | 107,851 (90.6%) | 100,784 (86.9%) |
| 35 to 44 Years | 110,553 (92.7%) | 104,477 (90.1%) |
| 45 to 54 Years | 98,742 (93.5%) | 93,047 (91.9%) |
| 55 to 64 Years | 100,094 (91.9%) | 100,038 (89.9%) |
| 65 to 74 Years | 83,158 (93.1%) | 85,583 (92.1%) |
| 75 Years and over | 47,309 (92.2%) | 54,950 (89.4%) |
| Total | 817,467 (90.2%) | 788,983 (87.8%) |
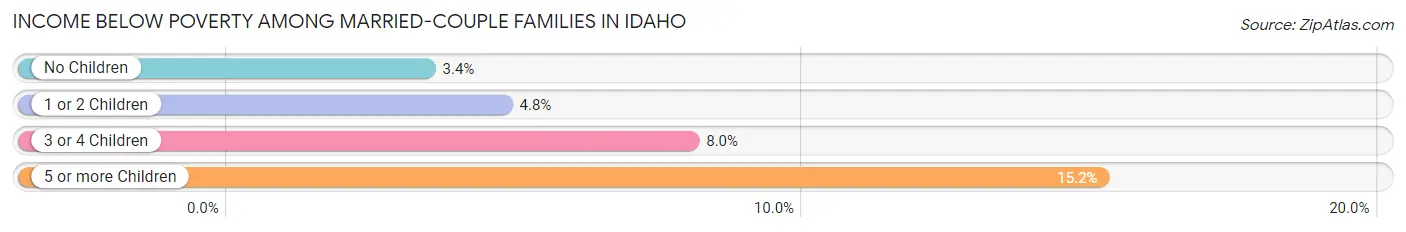
Income Below Poverty Among Married-Couple Families in Idaho
The poverty statistics for married-couple families in Idaho show that 4.6% or 17,018 of the total 372,111 families live below the poverty line. Families with 5 or more children have the highest poverty rate of 15.2%, comprising of 1,030 families. On the other hand, families with no children have the lowest poverty rate of 3.4%, which includes 7,371 families.
| Children | Above Poverty | Below Poverty |
| No Children | 206,999 (96.6%) | 7,371 (3.4%) |
| 1 or 2 Children | 102,811 (95.2%) | 5,166 (4.8%) |
| 3 or 4 Children | 39,523 (92.0%) | 3,451 (8.0%) |
| 5 or more Children | 5,760 (84.8%) | 1,030 (15.2%) |
| Total | 355,093 (95.4%) | 17,018 (4.6%) |
Income Below Poverty Among Single-Parent Households in Idaho
According to the poverty data in Idaho, 10.9% or 3,452 single-father households and 22.8% or 13,332 single-mother households are living below the poverty line. Among single-father households, those with 5 or more children have the highest poverty rate, with 42 households (27.3%) experiencing poverty. Likewise, among single-mother households, those with 3 or 4 children have the highest poverty rate, with 3,224 households (49.2%) falling below the poverty line.
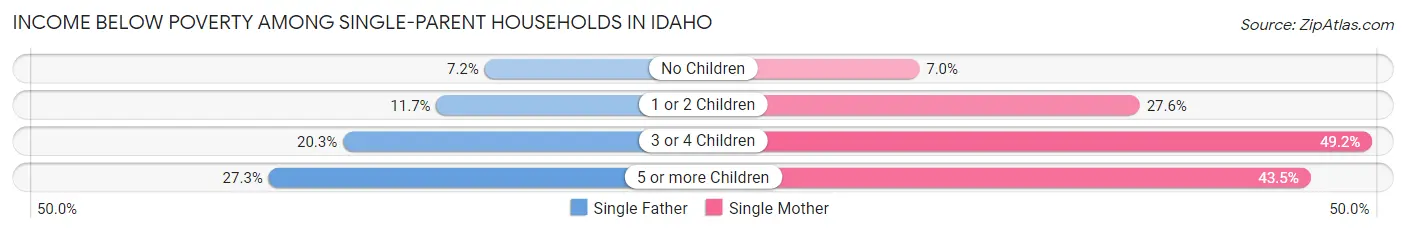
| Children | Single Father | Single Mother |
| No Children | 833 (7.2%) | 1,482 (7.0%) |
| 1 or 2 Children | 1,936 (11.7%) | 8,266 (27.6%) |
| 3 or 4 Children | 641 (20.3%) | 3,224 (49.2%) |
| 5 or more Children | 42 (27.3%) | 360 (43.5%) |
| Total | 3,452 (10.9%) | 13,332 (22.8%) |
Income Below Poverty Among Married-Couple vs Single-Parent Households in Idaho
The poverty data for Idaho shows that 17,018 of the married-couple family households (4.6%) and 16,784 of the single-parent households (18.6%) are living below the poverty level. Within the married-couple family households, those with 5 or more children have the highest poverty rate, with 1,030 households (15.2%) falling below the poverty line. Among the single-parent households, those with 5 or more children have the highest poverty rate, with 402 household (40.9%) living below poverty.
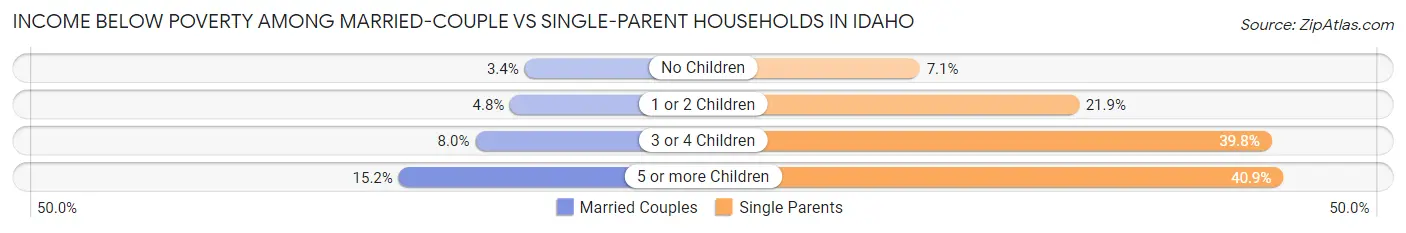
| Children | Married-Couple Families | Single-Parent Households |
| No Children | 7,371 (3.4%) | 2,315 (7.1%) |
| 1 or 2 Children | 5,166 (4.8%) | 10,202 (21.9%) |
| 3 or 4 Children | 3,451 (8.0%) | 3,865 (39.8%) |
| 5 or more Children | 1,030 (15.2%) | 402 (40.9%) |
| Total | 17,018 (4.6%) | 16,784 (18.6%) |
Largest Zip Codes by Population in Idaho
The largest zip codes in Idaho by population are 83646 (72,804), 83301 (61,291), 83709 (58,321), 83686 (56,267), and 83642 (54,645).
1.83646
72,804 (3.93%)
2.83301
61,291 (3.31%)
3.83709
58,321 (3.15%)
4.83686
56,267 (3.03%)
5.83642
54,645 (2.95%)
6.83854
50,378 (2.72%)
7.83440
49,410 (2.66%)
8.83401
47,381 (2.56%)
9.83704
40,520 (2.19%)
10.83605
39,636 (2.14%)
11.83201
39,170 (2.11%)
12.83815
38,934 (2.10%)
13.83501
37,136 (2.00%)
14.83687
37,095 (2.00%)
15.83651
36,863 (1.99%)
16.83706
36,806 (1.99%)
17.83634
34,650 (1.87%)
18.83607
34,178 (1.84%)
19.83616
33,860 (1.83%)
20.83713
29,722 (1.60%)
21.83221
28,822 (1.55%)
22.83402
28,037 (1.51%)
23.83705
27,849 (1.50%)
24.83814
26,611 (1.44%)
25.83714
26,202 (1.41%)
26.83404
25,947 (1.40%)
27.83442
24,445 (1.32%)
28.83843
24,223 (1.31%)
29.83835
23,229 (1.25%)
30.83702
23,113 (1.25%)
Largest Cities by Population in Idaho
The largest cities in Idaho by population are Boise City (234,192), Meridian (119,872), Nampa (102,598), Idaho Falls (65,685), and Caldwell (61,212).
234,192 (12.63%)
2.Meridian
119,872 (6.47%)
3.Nampa
102,598 (5.53%)
65,685 (3.54%)
5.Caldwell
61,212 (3.30%)
56,582 (3.05%)
54,599 (2.94%)
52,315 (2.82%)
40,002 (2.16%)
10.Rexburg
38,803 (2.09%)
11.Lewiston
34,270 (1.85%)
12.Eagle
30,635 (1.65%)
13.Moscow
25,616 (1.38%)
14.Kuna
24,845 (1.34%)
15.Ammon
17,921 (0.97%)
16,026 (0.86%)
17.Hayden
15,703 (0.85%)
18.Chubbuck
15,638 (0.84%)
19.Jerome
12,482 (0.67%)
20.Blackfoot
12,349 (0.67%)
21.Garden City
12,301 (0.66%)
22.Star
11,971 (0.65%)
23.Burley
11,506 (0.62%)
24.Middleton
9,614 (0.52%)
25.Rathdrum
9,556 (0.52%)
26.Hailey
9,238 (0.50%)
27.Sandpoint
8,899 (0.48%)
28.Payette
8,182 (0.44%)
29.Emmett
7,694 (0.41%)
30.Fruitland
6,169 (0.33%)
Largest Counties by Population in Idaho
The largest counties in Idaho by population are Ada County (497,494), Canyon County (235,006), Kootenai County (173,396), Bonneville County (124,490), and Twin Falls County (90,592).
497,494 (26.83%)
235,006 (12.67%)
173,396 (9.35%)
124,490 (6.71%)
90,592 (4.89%)
87,434 (4.72%)
52,487 (2.83%)
48,253 (2.60%)
47,976 (2.59%)
42,200 (2.28%)
11.Latah County
39,872 (2.15%)
31,383 (1.69%)
28,752 (1.55%)
25,571 (1.38%)
24,859 (1.34%)
24,474 (1.32%)
24,248 (1.31%)
21,626 (1.17%)
19.Gem County
19,250 (1.04%)
20.Idaho County
16,787 (0.91%)
15,520 (0.84%)
14,376 (0.78%)
13,519 (0.73%)
13,399 (0.72%)
12,335 (0.67%)
12,043 (0.65%)
11,830 (0.64%)
28.Teton County
11,813 (0.64%)
10,612 (0.57%)
9,731 (0.52%)
Race in Idaho
The most populous races in Idaho are White / Caucasian (1,574,859 | 84.9%), Hispanic or Latino (242,236 | 13.1%), and Two or more Races (132,577 | 7.1%).
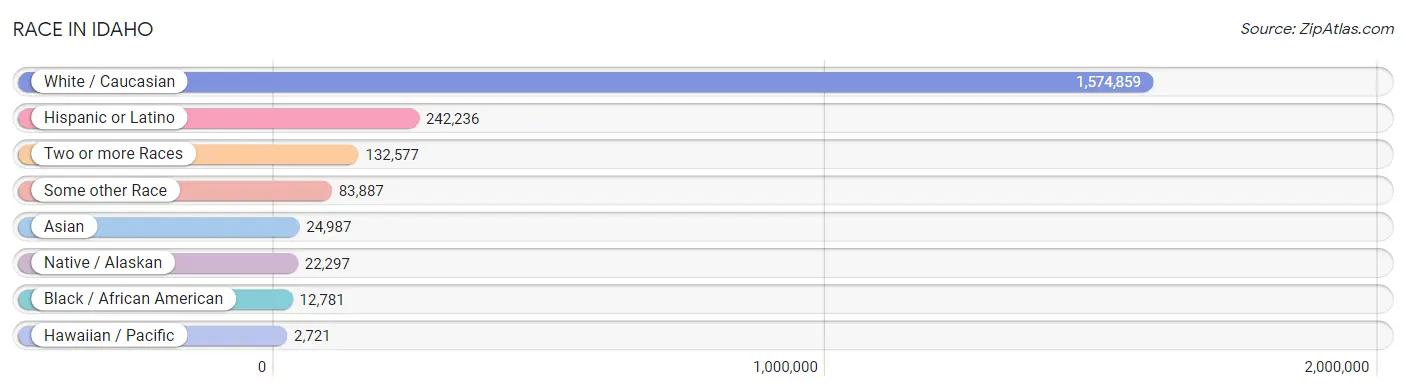
| Race | # Population | % Population |
| Asian | 24,987 | 1.3% |
| Black / African American | 12,781 | 0.7% |
| Hawaiian / Pacific | 2,721 | 0.2% |
| Hispanic or Latino | 242,236 | 13.1% |
| Native / Alaskan | 22,297 | 1.2% |
| White / Caucasian | 1,574,859 | 84.9% |
| Two or more Races | 132,577 | 7.1% |
| Some other Race | 83,887 | 4.5% |
| Total | 1,854,109 | 100.0% |
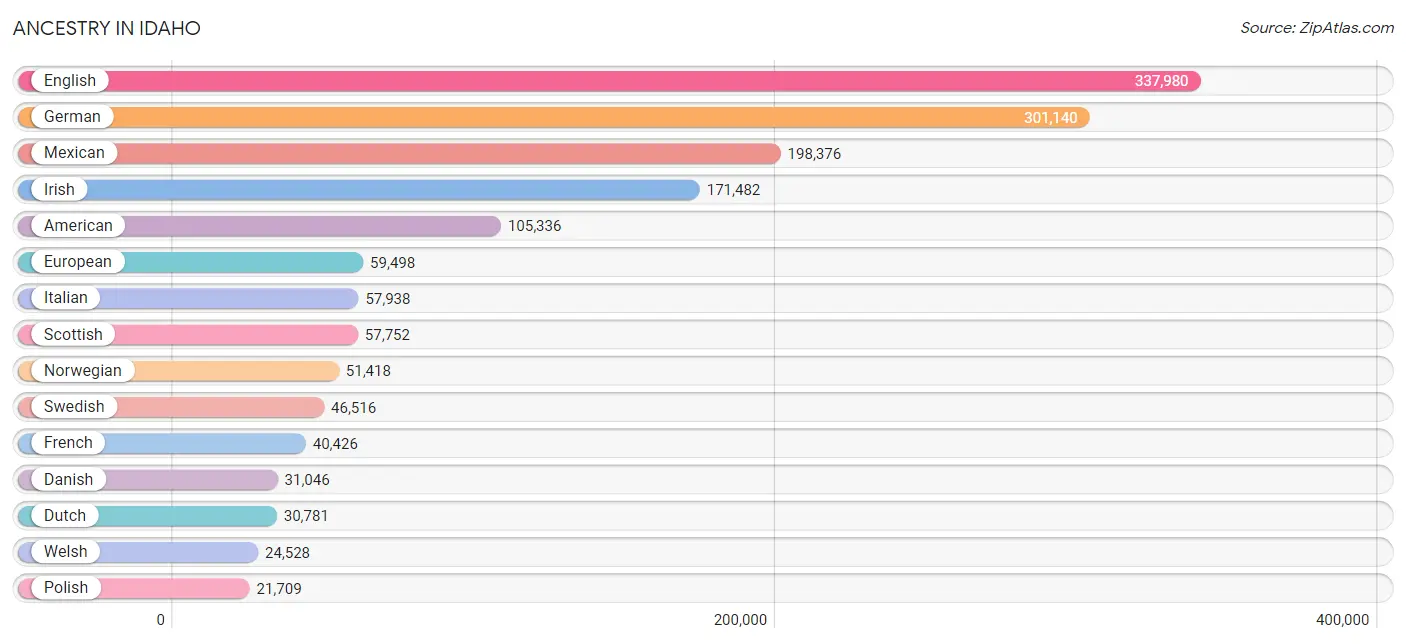
Ancestry in Idaho
The most populous ancestries reported in Idaho are English (337,980 | 18.2%), German (301,140 | 16.2%), Mexican (198,376 | 10.7%), Irish (171,482 | 9.2%), and American (105,336 | 5.7%), together accounting for 60.1% of all Idaho residents.
| Ancestry | # Population | % Population |
| Afghan | 496 | 0.0% |
| African | 1,553 | 0.1% |
| Alaska Native | 85 | 0.0% |
| Alaskan Athabascan | 12 | 0.0% |
| Albanian | 126 | 0.0% |
| Aleut | 86 | 0.0% |
| American | 105,336 | 5.7% |
| Apache | 1,175 | 0.1% |
| Arab | 5,084 | 0.3% |
| Arapaho | 27 | 0.0% |
| Argentinean | 690 | 0.0% |
| Armenian | 928 | 0.1% |
| Assyrian / Chaldean / Syriac | 44 | 0.0% |
| Australian | 705 | 0.0% |
| Austrian | 2,960 | 0.2% |
| Bahamian | 4 | 0.0% |
| Bangladeshi | 233 | 0.0% |
| Barbadian | 9 | 0.0% |
| Basque | 8,440 | 0.5% |
| Belgian | 1,319 | 0.1% |
| Belizean | 28 | 0.0% |
| Bhutanese | 9,926 | 0.5% |
| Blackfeet | 1,394 | 0.1% |
| Bolivian | 75 | 0.0% |
| Brazilian | 953 | 0.1% |
| British | 15,877 | 0.9% |
| Bulgarian | 695 | 0.0% |
| Burmese | 4,665 | 0.3% |
| Cajun | 95 | 0.0% |
| Cambodian | 52 | 0.0% |
| Canadian | 4,791 | 0.3% |
| Cape Verdean | 43 | 0.0% |
| Carpatho Rusyn | 60 | 0.0% |
| Celtic | 395 | 0.0% |
| Central American | 7,915 | 0.4% |
| Central American Indian | 974 | 0.1% |
| Cherokee | 7,116 | 0.4% |
| Cheyenne | 137 | 0.0% |
| Chickasaw | 237 | 0.0% |
| Chilean | 653 | 0.0% |
| Chinese | 104 | 0.0% |
| Chippewa | 1,185 | 0.1% |
| Choctaw | 1,442 | 0.1% |
| Colombian | 1,997 | 0.1% |
| Colville | 344 | 0.0% |
| Comanche | 197 | 0.0% |
| Costa Rican | 390 | 0.0% |
| Cree | 687 | 0.0% |
| Creek | 320 | 0.0% |
| Croatian | 1,921 | 0.1% |
| Crow | 170 | 0.0% |
| Cuban | 1,185 | 0.1% |
| Czech | 5,883 | 0.3% |
| Czechoslovakian | 1,629 | 0.1% |
| Danish | 31,046 | 1.7% |
| Delaware | 140 | 0.0% |
| Dominican | 707 | 0.0% |
| Dutch | 30,781 | 1.7% |
| Dutch West Indian | 32 | 0.0% |
| Eastern European | 2,743 | 0.2% |
| Ecuadorian | 766 | 0.0% |
| Egyptian | 286 | 0.0% |
| English | 337,980 | 18.2% |
| Estonian | 11 | 0.0% |
| Ethiopian | 298 | 0.0% |
| European | 59,498 | 3.2% |
| Fijian | 244 | 0.0% |
| Filipino | 220 | 0.0% |
| Finnish | 5,505 | 0.3% |
| French | 40,426 | 2.2% |
| French American Indian | 197 | 0.0% |
| French Canadian | 8,405 | 0.4% |
| German | 301,140 | 16.2% |
| German Russian | 224 | 0.0% |
| Ghanaian | 150 | 0.0% |
| Greek | 4,895 | 0.3% |
| Guamanian / Chamorro | 646 | 0.0% |
| Guatemalan | 2,951 | 0.2% |
| Haitian | 460 | 0.0% |
| Hmong | 314 | 0.0% |
| Honduran | 858 | 0.1% |
| Hopi | 176 | 0.0% |
| Houma | 7 | 0.0% |
| Hungarian | 4,575 | 0.3% |
| Icelander | 557 | 0.0% |
| Indian (Asian) | 7,795 | 0.4% |
| Indonesian | 393 | 0.0% |
| Inupiat | 558 | 0.0% |
| Iranian | 955 | 0.1% |
| Iraqi | 1,023 | 0.1% |
| Irish | 171,482 | 9.2% |
| Iroquois | 296 | 0.0% |
| Israeli | 282 | 0.0% |
| Italian | 57,938 | 3.1% |
| Jamaican | 266 | 0.0% |
| Japanese | 153 | 0.0% |
| Jordanian | 76 | 0.0% |
| Kenyan | 8 | 0.0% |
| Kiowa | 11 | 0.0% |
| Korean | 10,612 | 0.6% |
| Laotian | 585 | 0.0% |
| Latvian | 259 | 0.0% |
| Lebanese | 1,429 | 0.1% |
| Lithuanian | 1,603 | 0.1% |
| Lumbee | 40 | 0.0% |
| Luxembourger | 288 | 0.0% |
| Macedonian | 138 | 0.0% |
| Malaysian | 1,634 | 0.1% |
| Maltese | 84 | 0.0% |
| Marshallese | 3 | 0.0% |
| Menominee | 7 | 0.0% |
| Mexican | 198,376 | 10.7% |
| Mexican American Indian | 3,130 | 0.2% |
| Mongolian | 102 | 0.0% |
| Moroccan | 97 | 0.0% |
| Native Hawaiian | 3,431 | 0.2% |
| Navajo | 1,927 | 0.1% |
| New Zealander | 247 | 0.0% |
| Nicaraguan | 589 | 0.0% |
| Nigerian | 597 | 0.0% |
| Northern European | 6,350 | 0.3% |
| Norwegian | 51,418 | 2.8% |
| Okinawan | 92 | 0.0% |
| Osage | 329 | 0.0% |
| Ottawa | 55 | 0.0% |
| Paiute | 213 | 0.0% |
| Pakistani | 1,775 | 0.1% |
| Palestinian | 17 | 0.0% |
| Panamanian | 280 | 0.0% |
| Paraguayan | 145 | 0.0% |
| Pennsylvania German | 290 | 0.0% |
| Peruvian | 2,398 | 0.1% |
| Pima | 25 | 0.0% |
| Polish | 21,709 | 1.2% |
| Portuguese | 7,168 | 0.4% |
| Potawatomi | 306 | 0.0% |
| Pueblo | 400 | 0.0% |
| Puerto Rican | 6,536 | 0.4% |
| Puget Sound Salish | 228 | 0.0% |
| Romanian | 2,414 | 0.1% |
| Russian | 9,464 | 0.5% |
| Salvadoran | 2,763 | 0.2% |
| Samoan | 1,079 | 0.1% |
| Scandinavian | 16,797 | 0.9% |
| Scotch-Irish | 16,378 | 0.9% |
| Scottish | 57,752 | 3.1% |
| Seminole | 153 | 0.0% |
| Senegalese | 21 | 0.0% |
| Serbian | 498 | 0.0% |
| Shoshone | 1,130 | 0.1% |
| Sierra Leonean | 72 | 0.0% |
| Sioux | 2,030 | 0.1% |
| Slavic | 463 | 0.0% |
| Slovak | 1,167 | 0.1% |
| Slovene | 488 | 0.0% |
| Somali | 376 | 0.0% |
| South African | 222 | 0.0% |
| South American | 8,121 | 0.4% |
| South American Indian | 455 | 0.0% |
| Spaniard | 6,187 | 0.3% |
| Spanish | 4,682 | 0.3% |
| Spanish American | 197 | 0.0% |
| Spanish American Indian | 258 | 0.0% |
| Sri Lankan | 2,573 | 0.1% |
| Subsaharan African | 4,247 | 0.2% |
| Sudanese | 522 | 0.0% |
| Swedish | 46,516 | 2.5% |
| Swiss | 11,904 | 0.6% |
| Syrian | 523 | 0.0% |
| Taiwanese | 72 | 0.0% |
| Thai | 3,760 | 0.2% |
| Tlingit-Haida | 293 | 0.0% |
| Tohono O'Odham | 11 | 0.0% |
| Tongan | 646 | 0.0% |
| Trinidadian and Tobagonian | 163 | 0.0% |
| Tsimshian | 60 | 0.0% |
| Turkish | 251 | 0.0% |
| U.S. Virgin Islander | 1 | 0.0% |
| Ugandan | 10 | 0.0% |
| Ukrainian | 4,213 | 0.2% |
| Uruguayan | 29 | 0.0% |
| Ute | 39 | 0.0% |
| Venezuelan | 1,326 | 0.1% |
| Welsh | 24,528 | 1.3% |
| West Indian | 154 | 0.0% |
| Yakama | 247 | 0.0% |
| Yaqui | 433 | 0.0% |
| Yugoslavian | 1,812 | 0.1% |
| Yuman | 14 | 0.0% |
| Yup'ik | 7 | 0.0% | View All 190 Rows |
Immigrants in Idaho
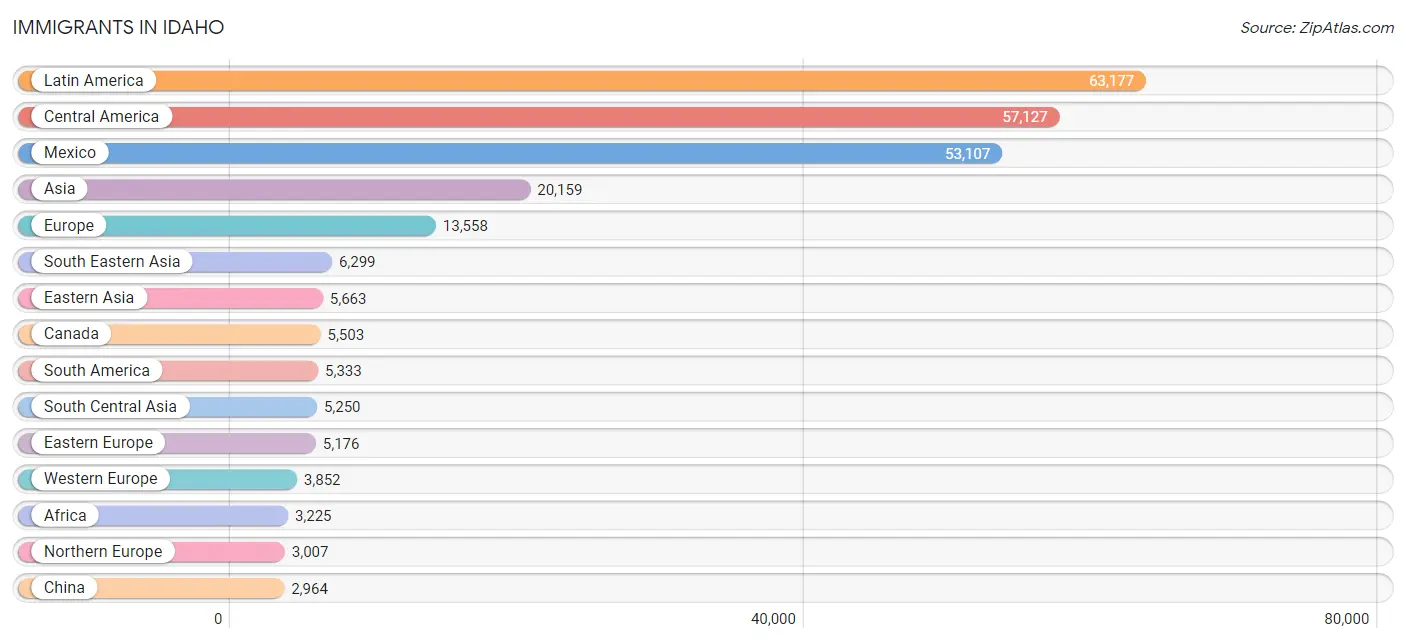
The most numerous immigrant groups reported in Idaho came from Latin America (63,177 | 3.4%), Central America (57,127 | 3.1%), Mexico (53,107 | 2.9%), Asia (20,159 | 1.1%), and Europe (13,558 | 0.7%), together accounting for 11.2% of all Idaho residents.
| Immigration Origin | # Population | % Population |
| Afghanistan | 465 | 0.0% |
| Africa | 3,225 | 0.2% |
| Albania | 13 | 0.0% |
| Argentina | 384 | 0.0% |
| Armenia | 10 | 0.0% |
| Asia | 20,159 | 1.1% |
| Australia | 434 | 0.0% |
| Austria | 293 | 0.0% |
| Azores | 139 | 0.0% |
| Bangladesh | 76 | 0.0% |
| Belarus | 50 | 0.0% |
| Belgium | 96 | 0.0% |
| Bolivia | 29 | 0.0% |
| Bosnia and Herzegovina | 675 | 0.0% |
| Brazil | 816 | 0.0% |
| Bulgaria | 273 | 0.0% |
| Cabo Verde | 12 | 0.0% |
| Cambodia | 77 | 0.0% |
| Cameroon | 4 | 0.0% |
| Canada | 5,503 | 0.3% |
| Caribbean | 717 | 0.0% |
| Central America | 57,127 | 3.1% |
| Chile | 322 | 0.0% |
| China | 2,964 | 0.2% |
| Colombia | 1,289 | 0.1% |
| Congo | 226 | 0.0% |
| Costa Rica | 340 | 0.0% |
| Croatia | 195 | 0.0% |
| Cuba | 253 | 0.0% |
| Czechoslovakia | 166 | 0.0% |
| Denmark | 49 | 0.0% |
| Dominican Republic | 77 | 0.0% |
| Eastern Africa | 1,135 | 0.1% |
| Eastern Asia | 5,663 | 0.3% |
| Eastern Europe | 5,176 | 0.3% |
| Ecuador | 363 | 0.0% |
| Egypt | 235 | 0.0% |
| El Salvador | 861 | 0.1% |
| England | 1,595 | 0.1% |
| Eritrea | 65 | 0.0% |
| Ethiopia | 295 | 0.0% |
| Europe | 13,558 | 0.7% |
| Fiji | 9 | 0.0% |
| France | 397 | 0.0% |
| Germany | 2,535 | 0.1% |
| Ghana | 97 | 0.0% |
| Greece | 142 | 0.0% |
| Guatemala | 2,023 | 0.1% |
| Guyana | 32 | 0.0% |
| Haiti | 283 | 0.0% |
| Honduras | 547 | 0.0% |
| Hong Kong | 313 | 0.0% |
| Hungary | 226 | 0.0% |
| India | 2,143 | 0.1% |
| Indonesia | 307 | 0.0% |
| Iran | 622 | 0.0% |
| Iraq | 1,626 | 0.1% |
| Ireland | 96 | 0.0% |
| Israel | 126 | 0.0% |
| Italy | 378 | 0.0% |
| Jamaica | 64 | 0.0% |
| Japan | 867 | 0.1% |
| Jordan | 37 | 0.0% |
| Kazakhstan | 83 | 0.0% |
| Kenya | 80 | 0.0% |
| Korea | 1,802 | 0.1% |
| Kuwait | 166 | 0.0% |
| Laos | 956 | 0.1% |
| Latin America | 63,177 | 3.4% |
| Latvia | 38 | 0.0% |
| Lebanon | 184 | 0.0% |
| Liberia | 5 | 0.0% |
| Lithuania | 24 | 0.0% |
| Malaysia | 211 | 0.0% |
| Mexico | 53,107 | 2.9% |
| Micronesia | 3 | 0.0% |
| Middle Africa | 807 | 0.0% |
| Moldova | 119 | 0.0% |
| Morocco | 14 | 0.0% |
| Nepal | 1,091 | 0.1% |
| Netherlands | 375 | 0.0% |
| Nicaragua | 95 | 0.0% |
| Nigeria | 246 | 0.0% |
| North Macedonia | 121 | 0.0% |
| Northern Africa | 454 | 0.0% |
| Northern Europe | 3,007 | 0.2% |
| Norway | 165 | 0.0% |
| Oceania | 753 | 0.0% |
| Pakistan | 173 | 0.0% |
| Panama | 142 | 0.0% |
| Peru | 1,398 | 0.1% |
| Philippines | 2,230 | 0.1% |
| Poland | 216 | 0.0% |
| Portugal | 346 | 0.0% |
| Romania | 520 | 0.0% |
| Russia | 1,012 | 0.1% |
| Saudi Arabia | 318 | 0.0% |
| Scotland | 158 | 0.0% |
| Serbia | 77 | 0.0% |
| Sierra Leone | 50 | 0.0% |
| Singapore | 331 | 0.0% |
| Somalia | 201 | 0.0% |
| South Africa | 314 | 0.0% |
| South America | 5,333 | 0.3% |
| South Central Asia | 5,250 | 0.3% |
| South Eastern Asia | 6,299 | 0.3% |
| Southern Europe | 1,351 | 0.1% |
| Spain | 474 | 0.0% |
| Sri Lanka | 72 | 0.0% |
| Sudan | 134 | 0.0% |
| Sweden | 63 | 0.0% |
| Switzerland | 156 | 0.0% |
| Syria | 294 | 0.0% |
| Taiwan | 432 | 0.0% |
| Thailand | 679 | 0.0% |
| Trinidad and Tobago | 17 | 0.0% |
| Turkey | 36 | 0.0% |
| Ukraine | 1,274 | 0.1% |
| Uruguay | 25 | 0.0% |
| Uzbekistan | 118 | 0.0% |
| Venezuela | 389 | 0.0% |
| Vietnam | 1,257 | 0.1% |
| West Indies | 23 | 0.0% |
| Western Africa | 410 | 0.0% |
| Western Asia | 2,947 | 0.2% |
| Western Europe | 3,852 | 0.2% |
| Yemen | 31 | 0.0% |
| Zaire | 577 | 0.0% |
| Zimbabwe | 50 | 0.0% | View All 129 Rows |
Sex and Age in Idaho
Sex and Age in Idaho
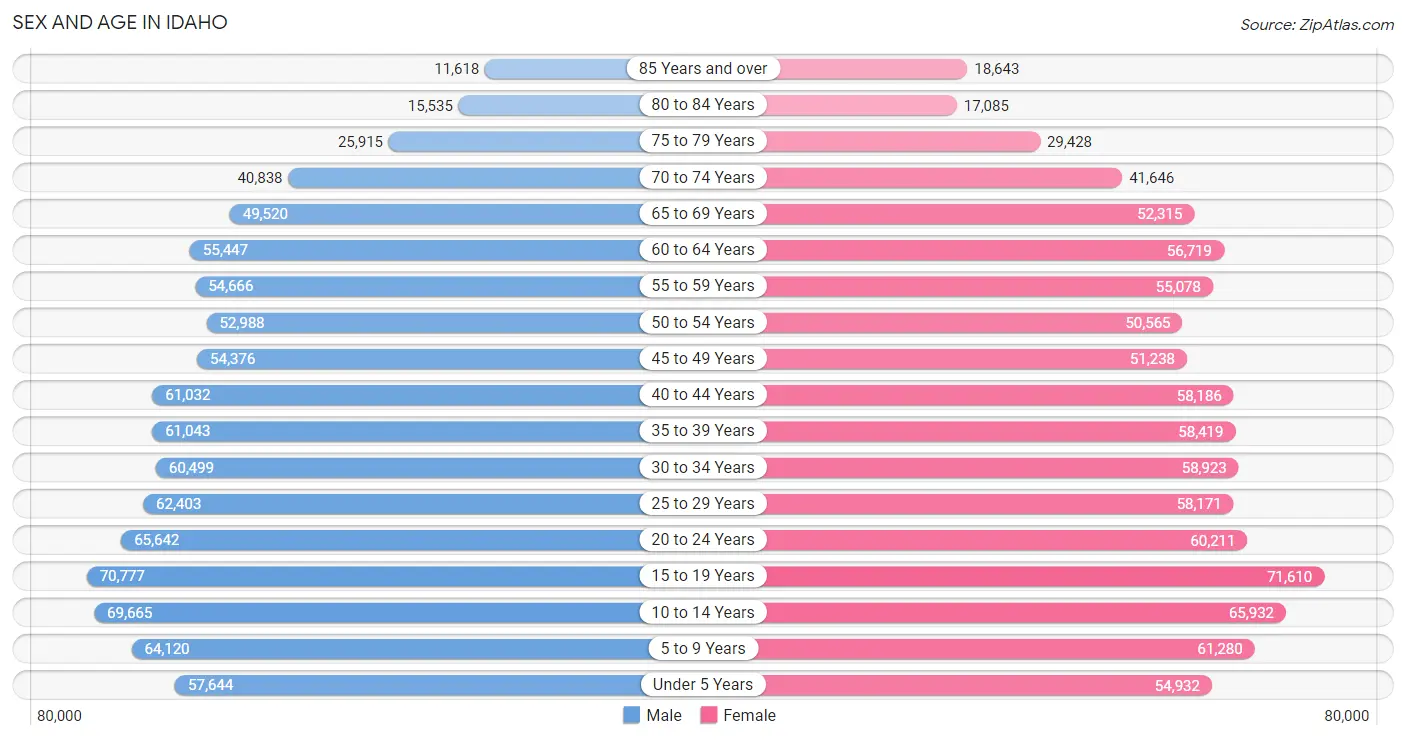
The most populous age groups in Idaho are 15 to 19 Years (70,777 | 7.6%) for men and 15 to 19 Years (71,610 | 7.8%) for women.
| Age Bracket | Male | Female |
| Under 5 Years | 57,644 (6.2%) | 54,932 (6.0%) |
| 5 to 9 Years | 64,120 (6.9%) | 61,280 (6.7%) |
| 10 to 14 Years | 69,665 (7.5%) | 65,932 (7.2%) |
| 15 to 19 Years | 70,777 (7.6%) | 71,610 (7.8%) |
| 20 to 24 Years | 65,642 (7.0%) | 60,211 (6.5%) |
| 25 to 29 Years | 62,403 (6.7%) | 58,171 (6.3%) |
| 30 to 34 Years | 60,499 (6.5%) | 58,923 (6.4%) |
| 35 to 39 Years | 61,043 (6.5%) | 58,419 (6.4%) |
| 40 to 44 Years | 61,032 (6.5%) | 58,186 (6.3%) |
| 45 to 49 Years | 54,376 (5.8%) | 51,238 (5.6%) |
| 50 to 54 Years | 52,988 (5.7%) | 50,565 (5.5%) |
| 55 to 59 Years | 54,666 (5.9%) | 55,078 (6.0%) |
| 60 to 64 Years | 55,447 (5.9%) | 56,719 (6.2%) |
| 65 to 69 Years | 49,520 (5.3%) | 52,315 (5.7%) |
| 70 to 74 Years | 40,838 (4.4%) | 41,646 (4.5%) |
| 75 to 79 Years | 25,915 (2.8%) | 29,428 (3.2%) |
| 80 to 84 Years | 15,535 (1.7%) | 17,085 (1.9%) |
| 85 Years and over | 11,618 (1.2%) | 18,643 (2.0%) |
| Total | 933,728 (100.0%) | 920,381 (100.0%) |
Families and Households in Idaho
Median Family Size in Idaho
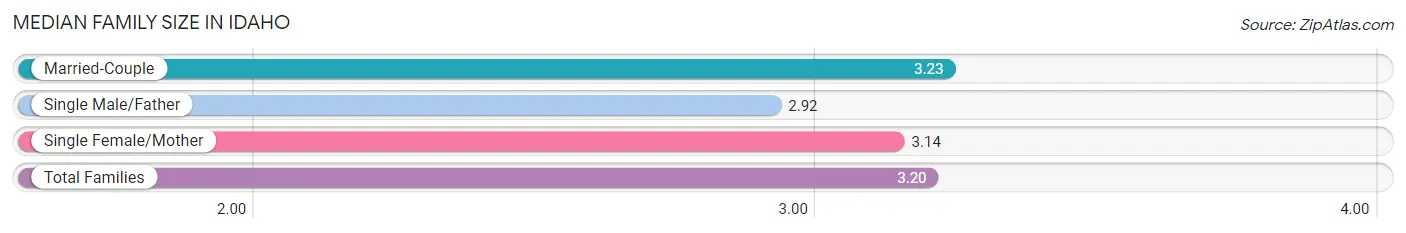
The median family size in Idaho is 3.20 persons per family, with married-couple families (372,111 | 80.5%) accounting for the largest median family size of 3.23 persons per family. On the other hand, single male/father families (31,562 | 6.8%) represent the smallest median family size with 2.92 persons per family.
| Family Type | # Families | Family Size |
| Married-Couple | 372,111 (80.5%) | 3.23 |
| Single Male/Father | 31,562 (6.8%) | 2.92 |
| Single Female/Mother | 58,420 (12.6%) | 3.14 |
| Total Families | 462,093 (100.0%) | 3.20 |
Median Household Size in Idaho
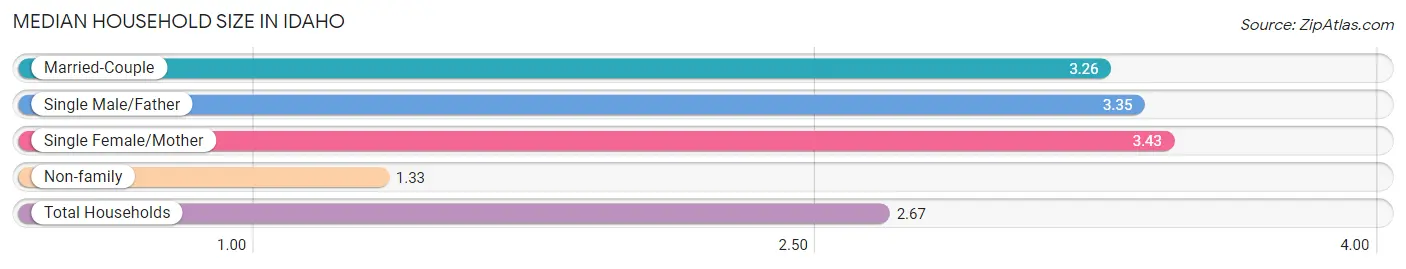
The median household size in Idaho is 2.67 persons per household, with single female/mother households (58,420 | 8.6%) accounting for the largest median household size of 3.43 persons per household. non-family households (213,230 | 31.6%) represent the smallest median household size with 1.33 persons per household.
| Household Type | # Households | Household Size |
| Married-Couple | 372,111 (55.1%) | 3.26 |
| Single Male/Father | 31,562 (4.7%) | 3.35 |
| Single Female/Mother | 58,420 (8.6%) | 3.43 |
| Non-family | 213,230 (31.6%) | 1.33 |
| Total Households | 675,323 (100.0%) | 2.67 |
Household Size by Marriage Status in Idaho
Out of a total of 675,323 households in Idaho, 462,093 (68.4%) are family households, while 213,230 (31.6%) are nonfamily households. The most numerous type of family households are 2-person households, comprising 210,940, and the most common type of nonfamily households are 1-person households, comprising 167,052.
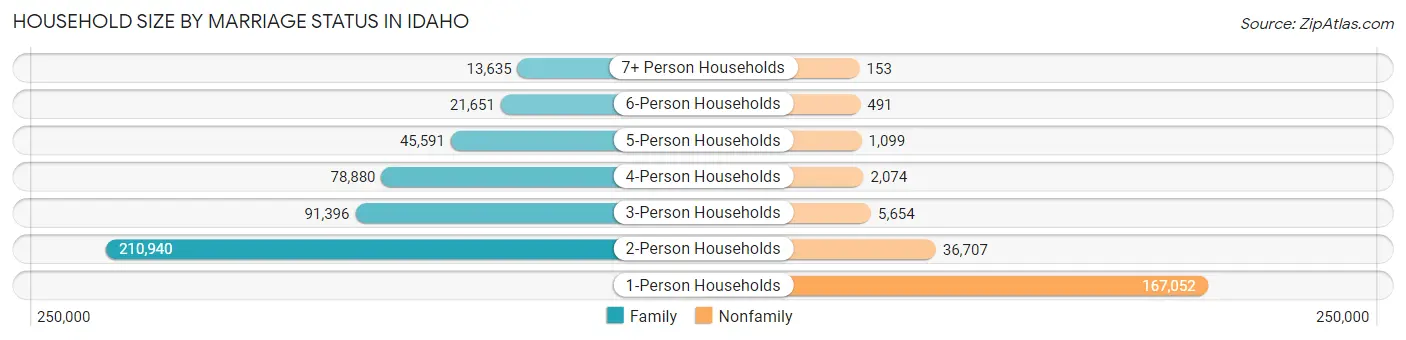
| Household Size | Family Households | Nonfamily Households |
| 1-Person Households | - | 167,052 (24.7%) |
| 2-Person Households | 210,940 (31.2%) | 36,707 (5.4%) |
| 3-Person Households | 91,396 (13.5%) | 5,654 (0.8%) |
| 4-Person Households | 78,880 (11.7%) | 2,074 (0.3%) |
| 5-Person Households | 45,591 (6.8%) | 1,099 (0.2%) |
| 6-Person Households | 21,651 (3.2%) | 491 (0.1%) |
| 7+ Person Households | 13,635 (2.0%) | 153 (0.0%) |
| Total | 462,093 (68.4%) | 213,230 (31.6%) |
Female Fertility in Idaho
Fertility by Age in Idaho
Average fertility rate in Idaho is 56.0 births per 1,000 women. Women in the age bracket of 20 to 34 years have the highest fertility rate with 102.0 births per 1,000 women. Women in the age bracket of 20 to 34 years acount for 75.3% of all women with births.
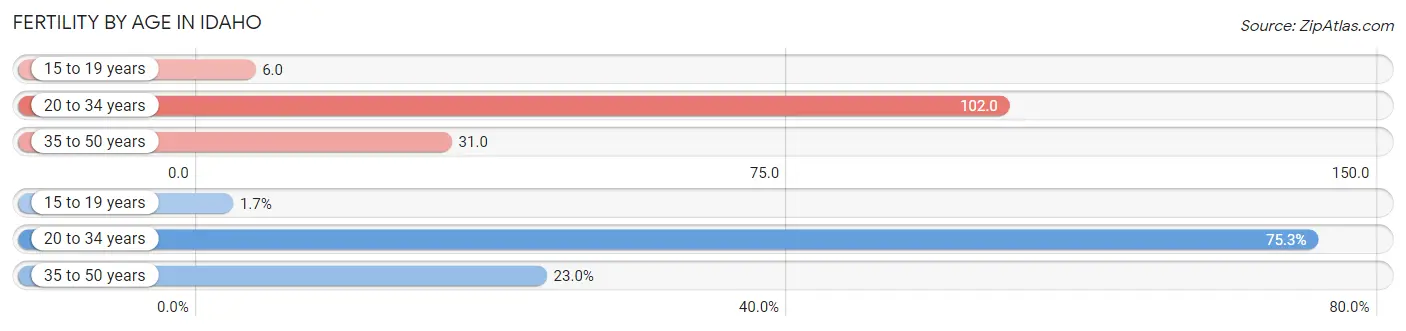
| Age Bracket | Women with Births | Births / 1,000 Women |
| 15 to 19 years | 407 (1.7%) | 6.0 |
| 20 to 34 years | 18,149 (75.3%) | 102.0 |
| 35 to 50 years | 5,537 (23.0%) | 31.0 |
| Total | 24,093 (100.0%) | 56.0 |
Fertility by Age by Marriage Status in Idaho
80.8% of women with births (24,093) in Idaho are married. The highest percentage of unmarried women with births falls into 15 to 19 years age bracket with 84.5% of them unmarried at the time of birth, while the lowest percentage of unmarried women with births belong to 35 to 50 years age bracket with 14.3% of them unmarried.
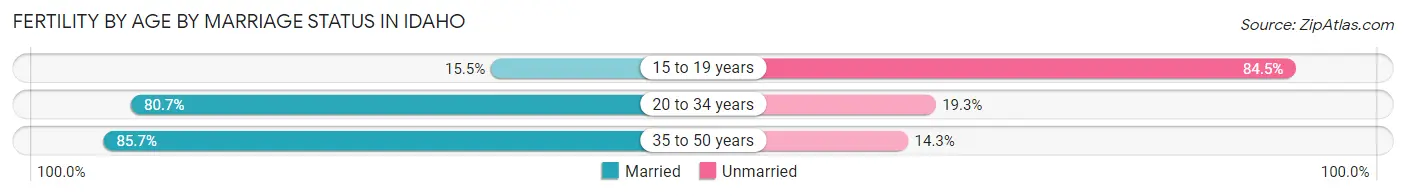
| Age Bracket | Married | Unmarried |
| 15 to 19 years | 63 (15.5%) | 344 (84.5%) |
| 20 to 34 years | 14,646 (80.7%) | 3,503 (19.3%) |
| 35 to 50 years | 4,745 (85.7%) | 792 (14.3%) |
| Total | 19,467 (80.8%) | 4,626 (19.2%) |
Fertility by Education in Idaho
Average fertility rate in Idaho is 56.0 births per 1,000 women. Women with the education attainment of bachelor's degree have the highest fertility rate of 79.0 births per 1,000 women, while women with the education attainment of less than high school have the lowest fertility at 30.0 births per 1,000 women. Women with the education attainment of college or associate's degree represent 33.0% of all women with births.
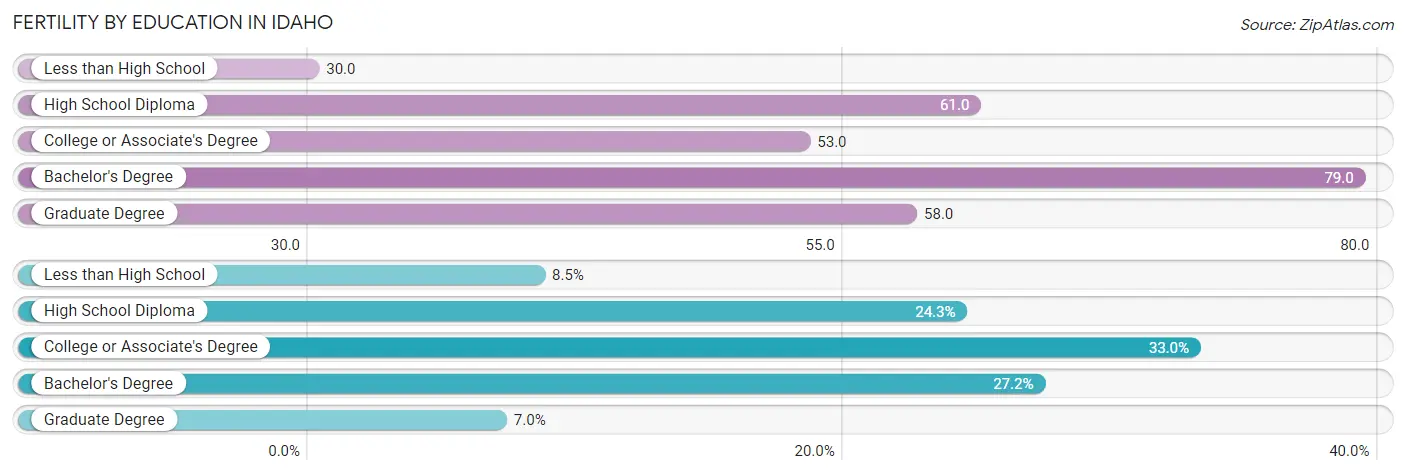
| Educational Attainment | Women with Births | Births / 1,000 Women |
| Less than High School | 2,038 (8.5%) | 30.0 |
| High School Diploma | 5,850 (24.3%) | 61.0 |
| College or Associate's Degree | 7,959 (33.0%) | 53.0 |
| Bachelor's Degree | 6,553 (27.2%) | 79.0 |
| Graduate Degree | 1,693 (7.0%) | 58.0 |
| Total | 24,093 (100.0%) | 56.0 |
Fertility by Education by Marriage Status in Idaho
19.2% of women with births in Idaho are unmarried. Women with the educational attainment of bachelor's degree are most likely to be married with 94.7% of them married at childbirth, while women with the educational attainment of less than high school are least likely to be married with 38.1% of them unmarried at childbirth.
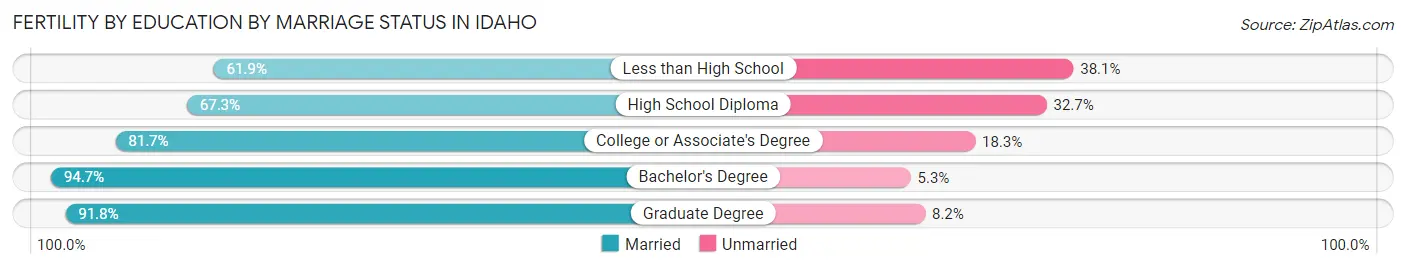
| Educational Attainment | Married | Unmarried |
| Less than High School | 1,262 (61.9%) | 776 (38.1%) |
| High School Diploma | 3,937 (67.3%) | 1,913 (32.7%) |
| College or Associate's Degree | 6,503 (81.7%) | 1,456 (18.3%) |
| Bachelor's Degree | 6,206 (94.7%) | 347 (5.3%) |
| Graduate Degree | 1,554 (91.8%) | 139 (8.2%) |
| Total | 19,467 (80.8%) | 4,626 (19.2%) |
Employment Characteristics in Idaho
Employment by Class of Employer in Idaho
Among the 862,707 employed individuals in Idaho, private company employees (560,823 | 65.0%), self-employed (not incorporated) (64,157 | 7.4%), and not-for-profit organizations (62,028 | 7.2%) make up the most common classes of employment.
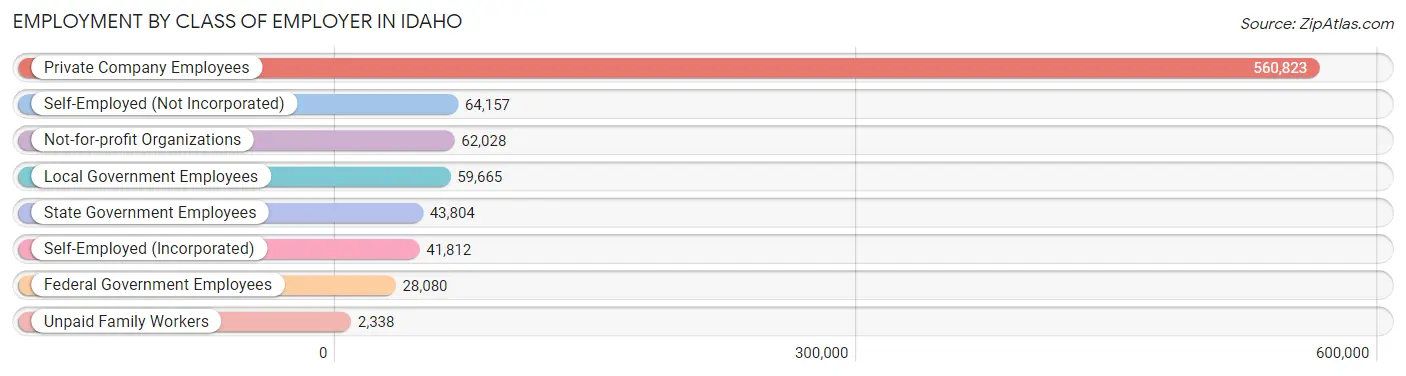
| Employer Class | # Employees | % Employees |
| Private Company Employees | 560,823 | 65.0% |
| Self-Employed (Incorporated) | 41,812 | 4.9% |
| Self-Employed (Not Incorporated) | 64,157 | 7.4% |
| Not-for-profit Organizations | 62,028 | 7.2% |
| Local Government Employees | 59,665 | 6.9% |
| State Government Employees | 43,804 | 5.1% |
| Federal Government Employees | 28,080 | 3.3% |
| Unpaid Family Workers | 2,338 | 0.3% |
| Total | 862,707 | 100.0% |
Employment Status by Age in Idaho
According to the labor force statistics for Idaho, out of the total population over 16 years of age (1,451,461), 62.9% or 912,969 individuals are in the labor force, with 3.8% or 34,693 of them unemployed. The age group with the highest labor force participation rate is 35 to 44 years, with 82.4% or 196,672 individuals in the labor force. Within the labor force, the 16 to 19 years age range has the highest percentage of unemployed individuals, with 12.6% or 7,082 of them being unemployed.
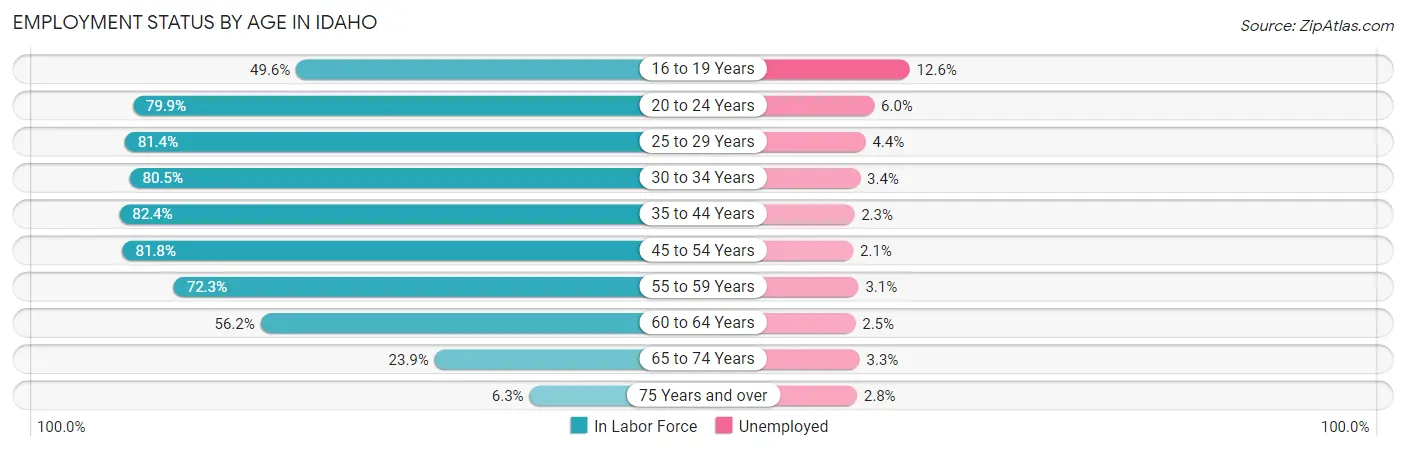
| Age Bracket | In Labor Force | Unemployed |
| 16 to 19 Years | 56,203 (49.6%) | 7,082 (12.6%) |
| 20 to 24 Years | 100,557 (79.9%) | 6,033 (6.0%) |
| 25 to 29 Years | 98,147 (81.4%) | 4,318 (4.4%) |
| 30 to 34 Years | 96,135 (80.5%) | 3,269 (3.4%) |
| 35 to 44 Years | 196,672 (82.4%) | 4,523 (2.3%) |
| 45 to 54 Years | 171,099 (81.8%) | 3,593 (2.1%) |
| 55 to 59 Years | 79,345 (72.3%) | 2,460 (3.1%) |
| 60 to 64 Years | 63,037 (56.2%) | 1,576 (2.5%) |
| 65 to 74 Years | 44,052 (23.9%) | 1,454 (3.3%) |
| 75 Years and over | 7,448 (6.3%) | 209 (2.8%) |
| Total | 912,969 (62.9%) | 34,693 (3.8%) |
Employment Status by Educational Attainment in Idaho
According to labor force statistics for Idaho, 77.4% of individuals (704,149) out of the total population between 25 and 64 years of age (909,753) are in the labor force, with 2.8% or 19,716 of them being unemployed. The group with the highest labor force participation rate are those with the educational attainment of bachelor's degree or higher, with 84.3% or 234,600 individuals in the labor force. Within the labor force, individuals with less than high school education have the highest percentage of unemployment, with 4.1% or 2,172 of them being unemployed.
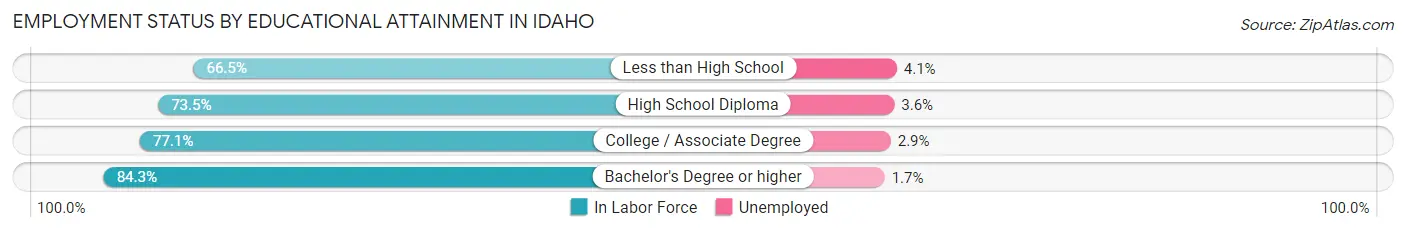
| Educational Attainment | In Labor Force | Unemployed |
| Less than High School | 52,974 (66.5%) | 3,266 (4.1%) |
| High School Diploma | 171,207 (73.5%) | 8,386 (3.6%) |
| College / Associate Degree | 245,846 (77.1%) | 9,247 (2.9%) |
| Bachelor's Degree or higher | 234,600 (84.3%) | 4,731 (1.7%) |
| Total | 704,149 (77.4%) | 25,473 (2.8%) |
Employment Occupations by Sex in Idaho
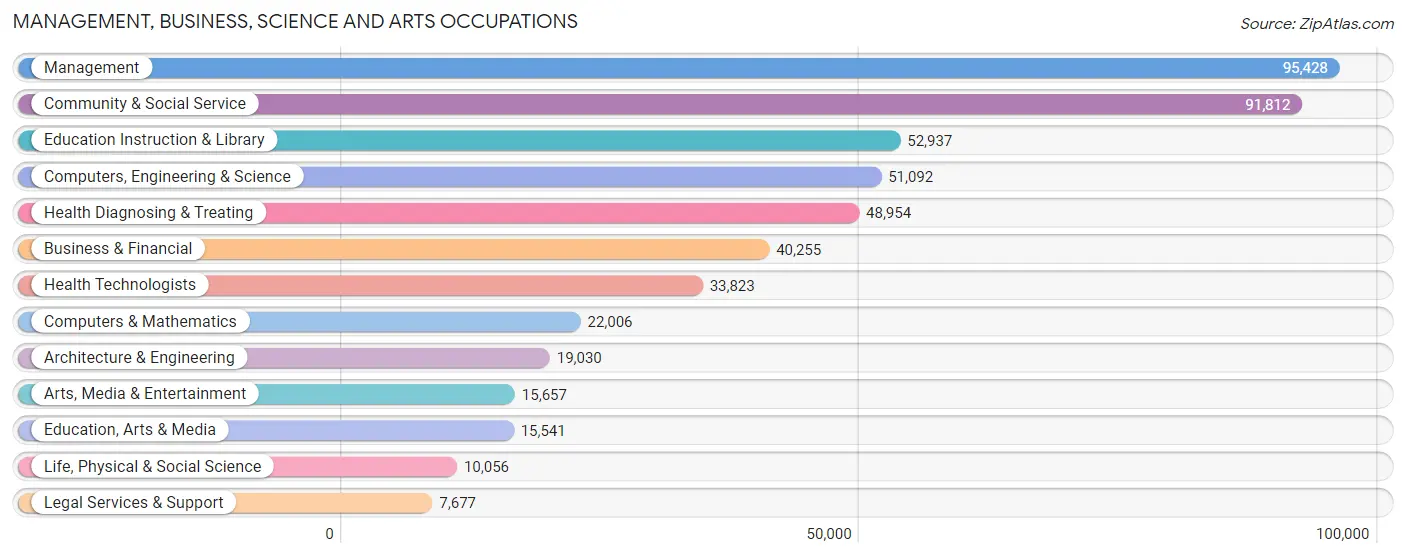
Management, Business, Science and Arts Occupations
The most common Management, Business, Science and Arts occupations in Idaho are Management (95,428 | 10.9%), Community & Social Service (91,812 | 10.5%), Education Instruction & Library (52,937 | 6.1%), Computers, Engineering & Science (51,092 | 5.9%), and Health Diagnosing & Treating (48,954 | 5.6%).
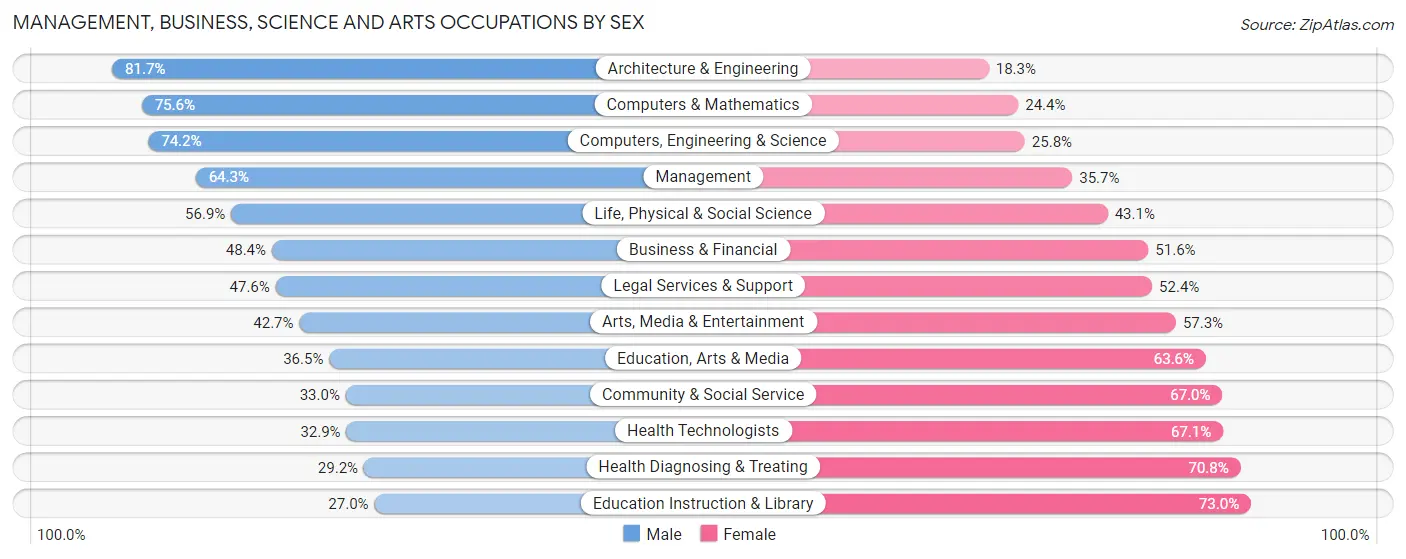
Management, Business, Science and Arts Occupations by Sex
Within the Management, Business, Science and Arts occupations in Idaho, the most male-oriented occupations are Architecture & Engineering (81.7%), Computers & Mathematics (75.6%), and Computers, Engineering & Science (74.2%), while the most female-oriented occupations are Education Instruction & Library (73.0%), Health Diagnosing & Treating (70.8%), and Health Technologists (67.1%).
| Occupation | Male | Female |
| Management | 61,362 (64.3%) | 34,066 (35.7%) |
| Business & Financial | 19,493 (48.4%) | 20,762 (51.6%) |
| Computers, Engineering & Science | 37,903 (74.2%) | 13,189 (25.8%) |
| Computers & Mathematics | 16,627 (75.6%) | 5,379 (24.4%) |
| Architecture & Engineering | 15,553 (81.7%) | 3,477 (18.3%) |
| Life, Physical & Social Science | 5,723 (56.9%) | 4,333 (43.1%) |
| Community & Social Service | 30,311 (33.0%) | 61,501 (67.0%) |
| Education, Arts & Media | 5,664 (36.4%) | 9,877 (63.5%) |
| Legal Services & Support | 3,657 (47.6%) | 4,020 (52.4%) |
| Education Instruction & Library | 14,308 (27.0%) | 38,629 (73.0%) |
| Arts, Media & Entertainment | 6,682 (42.7%) | 8,975 (57.3%) |
| Health Diagnosing & Treating | 14,305 (29.2%) | 34,649 (70.8%) |
| Health Technologists | 11,115 (32.9%) | 22,708 (67.1%) |
| Total (Category) | 163,374 (49.9%) | 164,167 (50.1%) |
| Total (Overall) | 475,187 (54.4%) | 398,276 (45.6%) |
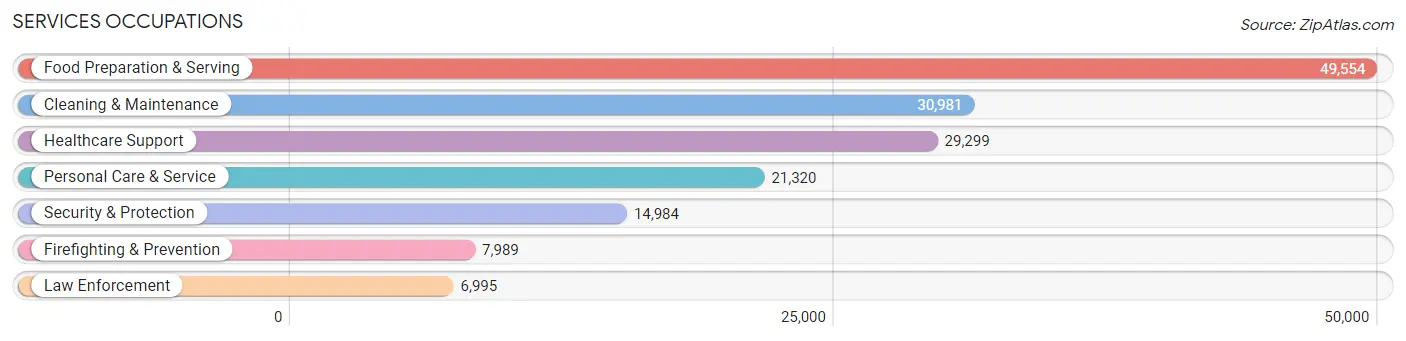
Services Occupations
The most common Services occupations in Idaho are Food Preparation & Serving (49,554 | 5.7%), Cleaning & Maintenance (30,981 | 3.5%), Healthcare Support (29,299 | 3.4%), Personal Care & Service (21,320 | 2.4%), and Security & Protection (14,984 | 1.7%).
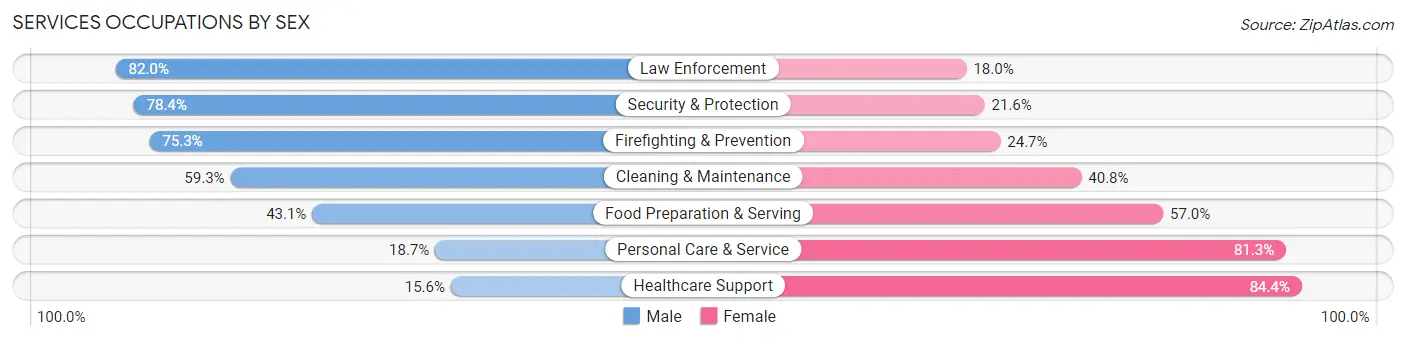
Services Occupations by Sex
Within the Services occupations in Idaho, the most male-oriented occupations are Law Enforcement (82.0%), Security & Protection (78.4%), and Firefighting & Prevention (75.3%), while the most female-oriented occupations are Healthcare Support (84.4%), Personal Care & Service (81.3%), and Food Preparation & Serving (57.0%).
| Occupation | Male | Female |
| Healthcare Support | 4,574 (15.6%) | 24,725 (84.4%) |
| Security & Protection | 11,749 (78.4%) | 3,235 (21.6%) |
| Firefighting & Prevention | 6,014 (75.3%) | 1,975 (24.7%) |
| Law Enforcement | 5,735 (82.0%) | 1,260 (18.0%) |
| Food Preparation & Serving | 21,335 (43.0%) | 28,219 (57.0%) |
| Cleaning & Maintenance | 18,357 (59.3%) | 12,624 (40.7%) |
| Personal Care & Service | 3,988 (18.7%) | 17,332 (81.3%) |
| Total (Category) | 60,003 (41.1%) | 86,135 (58.9%) |
| Total (Overall) | 475,187 (54.4%) | 398,276 (45.6%) |
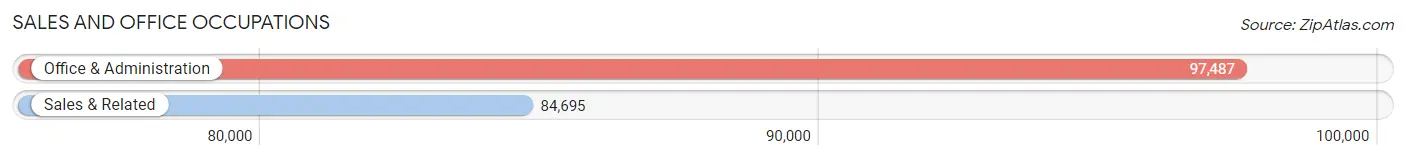
Sales and Office Occupations
The most common Sales and Office occupations in Idaho are Office & Administration (97,487 | 11.2%), and Sales & Related (84,695 | 9.7%).
Sales and Office Occupations by Sex
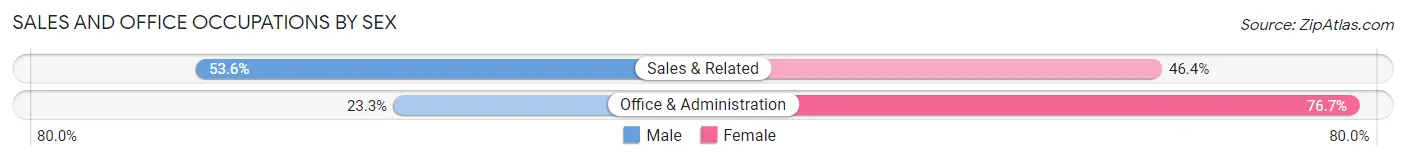
| Occupation | Male | Female |
| Sales & Related | 45,417 (53.6%) | 39,278 (46.4%) |
| Office & Administration | 22,745 (23.3%) | 74,742 (76.7%) |
| Total (Category) | 68,162 (37.4%) | 114,020 (62.6%) |
| Total (Overall) | 475,187 (54.4%) | 398,276 (45.6%) |
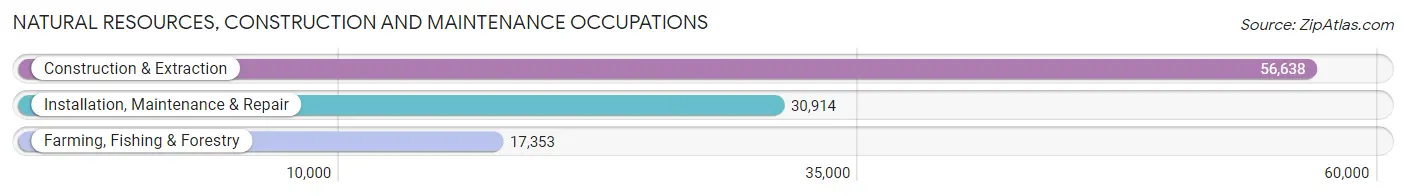
Natural Resources, Construction and Maintenance Occupations
The most common Natural Resources, Construction and Maintenance occupations in Idaho are Construction & Extraction (56,638 | 6.5%), Installation, Maintenance & Repair (30,914 | 3.5%), and Farming, Fishing & Forestry (17,353 | 2.0%).
Natural Resources, Construction and Maintenance Occupations by Sex
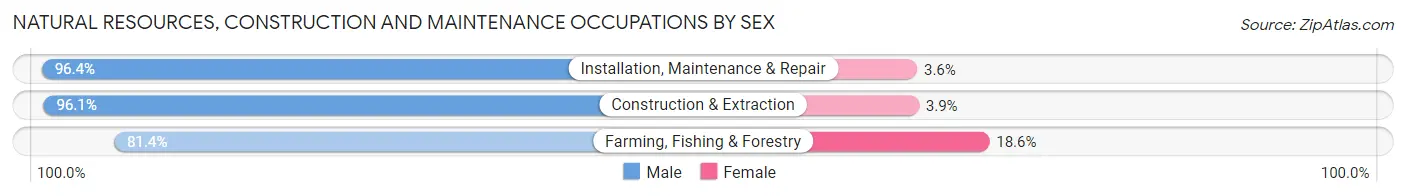
| Occupation | Male | Female |
| Farming, Fishing & Forestry | 14,125 (81.4%) | 3,228 (18.6%) |
| Construction & Extraction | 54,405 (96.1%) | 2,233 (3.9%) |
| Installation, Maintenance & Repair | 29,812 (96.4%) | 1,102 (3.6%) |
| Total (Category) | 98,342 (93.7%) | 6,563 (6.3%) |
| Total (Overall) | 475,187 (54.4%) | 398,276 (45.6%) |
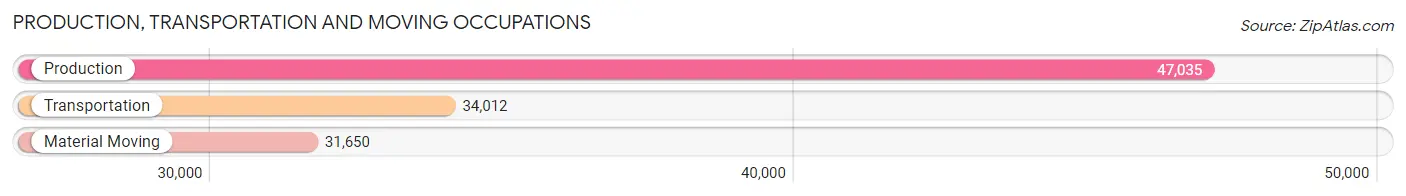
Production, Transportation and Moving Occupations
The most common Production, Transportation and Moving occupations in Idaho are Production (47,035 | 5.4%), Transportation (34,012 | 3.9%), and Material Moving (31,650 | 3.6%).
Production, Transportation and Moving Occupations by Sex
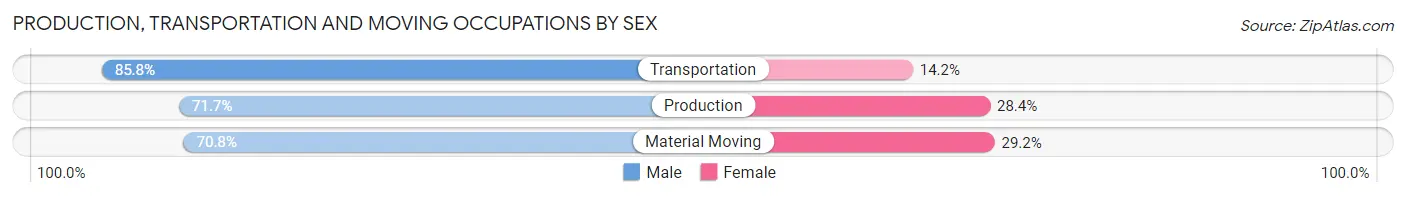
| Occupation | Male | Female |
| Production | 33,701 (71.7%) | 13,334 (28.3%) |
| Transportation | 29,192 (85.8%) | 4,820 (14.2%) |
| Material Moving | 22,413 (70.8%) | 9,237 (29.2%) |
| Total (Category) | 85,306 (75.7%) | 27,391 (24.3%) |
| Total (Overall) | 475,187 (54.4%) | 398,276 (45.6%) |
Employment Industries by Sex in Idaho
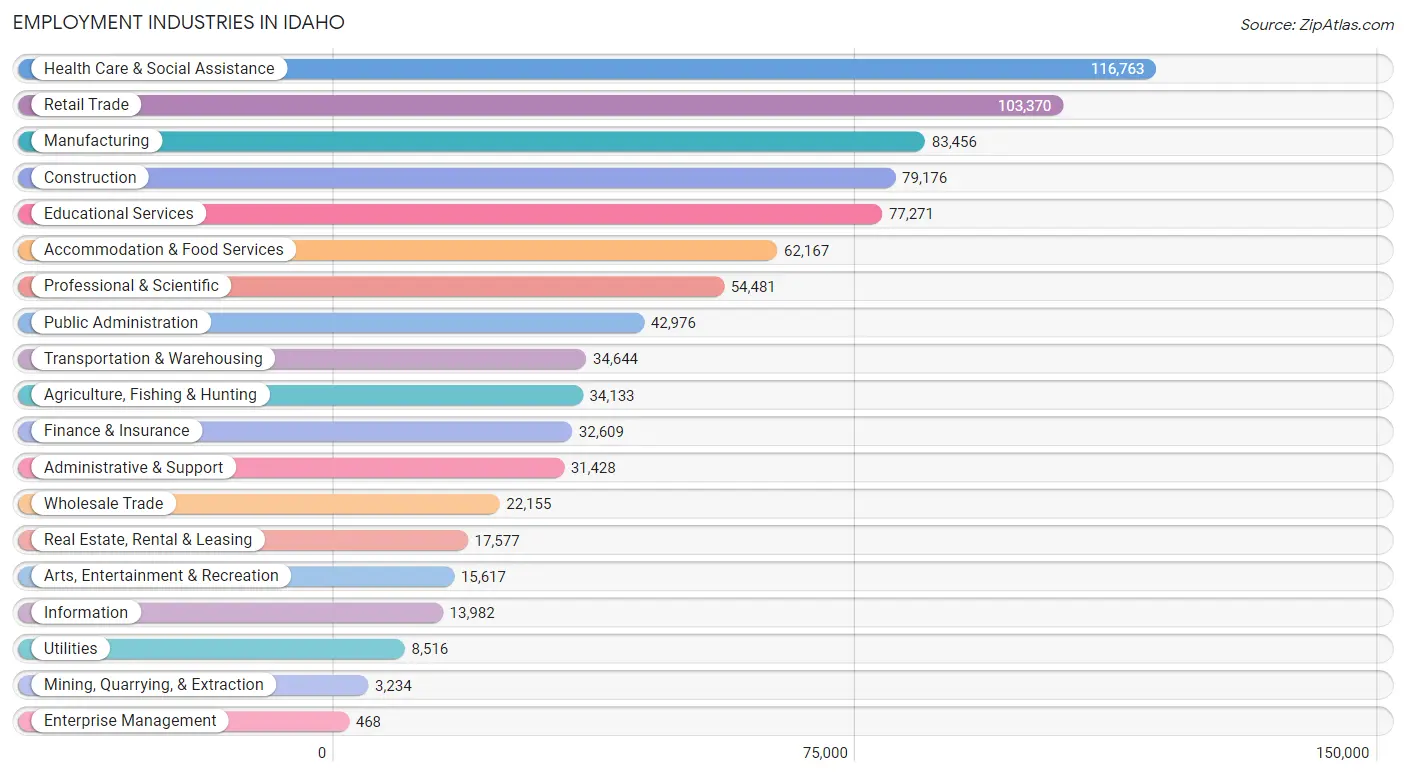
Employment Industries in Idaho
The major employment industries in Idaho include Health Care & Social Assistance (116,763 | 13.4%), Retail Trade (103,370 | 11.8%), Manufacturing (83,456 | 9.6%), Construction (79,176 | 9.1%), and Educational Services (77,271 | 8.8%).
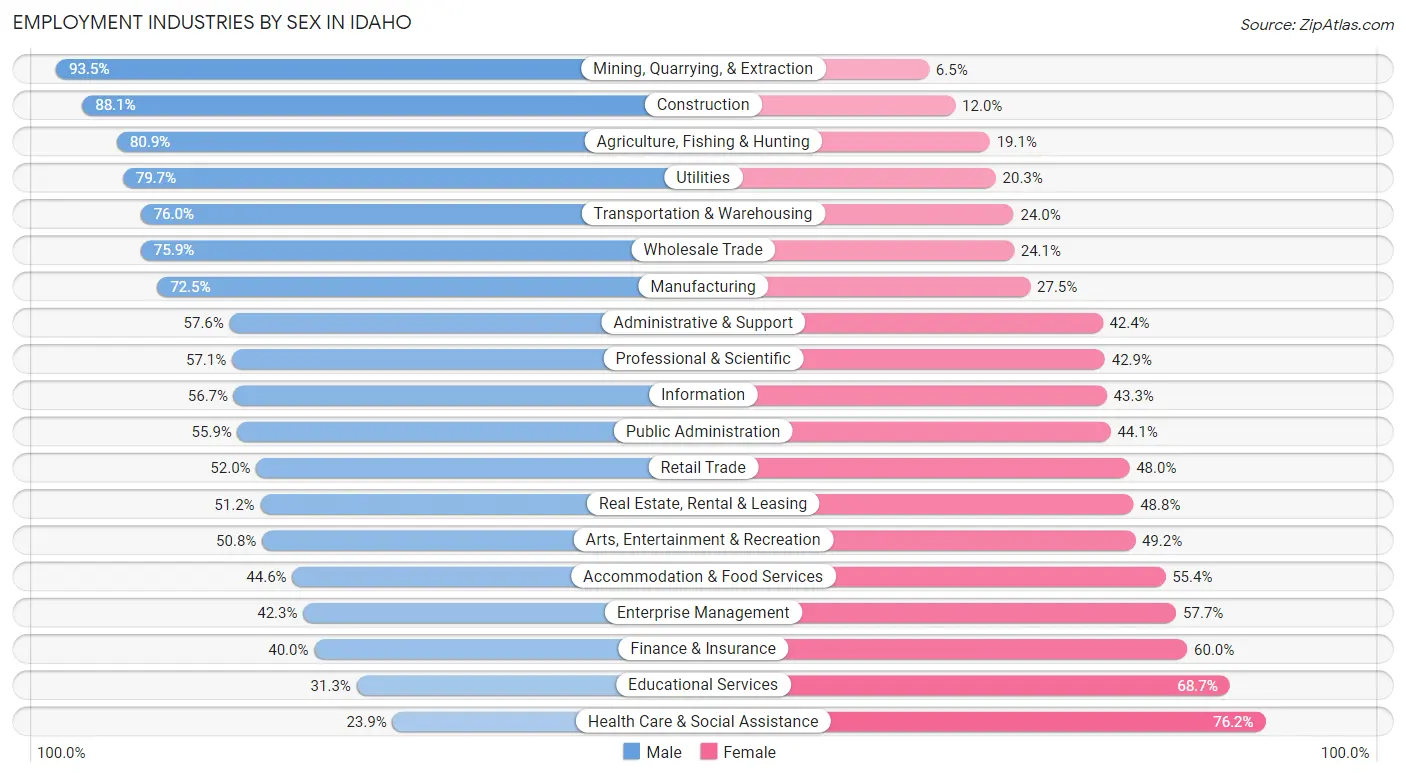
Employment Industries by Sex in Idaho
The Idaho industries that see more men than women are Mining, Quarrying, & Extraction (93.5%), Construction (88.0%), and Agriculture, Fishing & Hunting (80.9%), whereas the industries that tend to have a higher number of women are Health Care & Social Assistance (76.1%), Educational Services (68.7%), and Finance & Insurance (60.0%).
| Industry | Male | Female |
| Agriculture, Fishing & Hunting | 27,611 (80.9%) | 6,522 (19.1%) |
| Mining, Quarrying, & Extraction | 3,023 (93.5%) | 211 (6.5%) |
| Construction | 69,714 (88.0%) | 9,462 (11.9%) |
| Manufacturing | 60,535 (72.5%) | 22,921 (27.5%) |
| Wholesale Trade | 16,819 (75.9%) | 5,336 (24.1%) |
| Retail Trade | 53,771 (52.0%) | 49,599 (48.0%) |
| Transportation & Warehousing | 26,316 (76.0%) | 8,328 (24.0%) |
| Utilities | 6,785 (79.7%) | 1,731 (20.3%) |
| Information | 7,926 (56.7%) | 6,056 (43.3%) |
| Finance & Insurance | 13,058 (40.0%) | 19,551 (60.0%) |
| Real Estate, Rental & Leasing | 8,998 (51.2%) | 8,579 (48.8%) |
| Professional & Scientific | 31,093 (57.1%) | 23,388 (42.9%) |
| Enterprise Management | 198 (42.3%) | 270 (57.7%) |
| Administrative & Support | 18,090 (57.6%) | 13,338 (42.4%) |
| Educational Services | 24,163 (31.3%) | 53,108 (68.7%) |
| Health Care & Social Assistance | 27,851 (23.8%) | 88,912 (76.1%) |
| Arts, Entertainment & Recreation | 7,938 (50.8%) | 7,679 (49.2%) |
| Accommodation & Food Services | 27,708 (44.6%) | 34,459 (55.4%) |
| Public Administration | 24,025 (55.9%) | 18,951 (44.1%) |
| Total | 475,187 (54.4%) | 398,276 (45.6%) |
Education in Idaho
School Enrollment in Idaho
The most common levels of schooling among the 484,169 students in Idaho are middle school (107,950 | 22.3%), high school (105,920 | 21.9%), and college / undergraduate (105,527 | 21.8%).
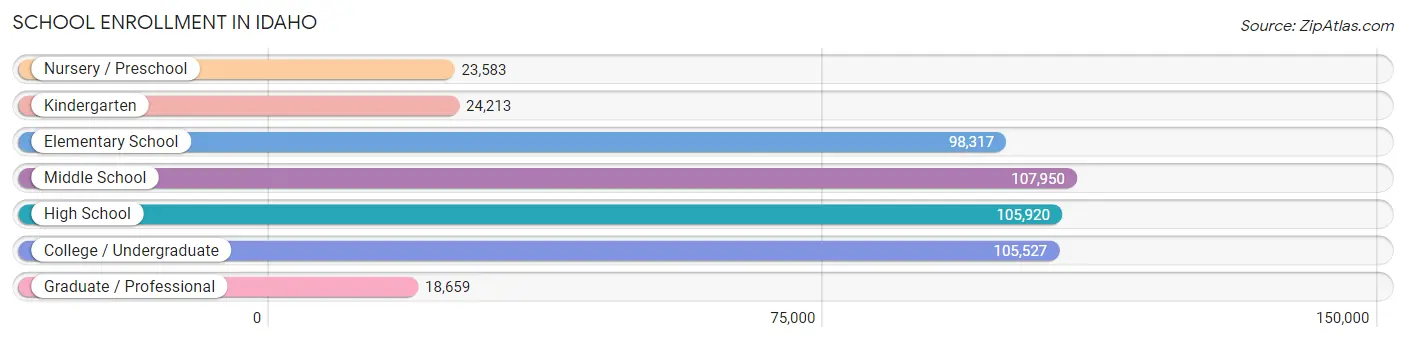
| School Level | # Students | % Students |
| Nursery / Preschool | 23,583 | 4.9% |
| Kindergarten | 24,213 | 5.0% |
| Elementary School | 98,317 | 20.3% |
| Middle School | 107,950 | 22.3% |
| High School | 105,920 | 21.9% |
| College / Undergraduate | 105,527 | 21.8% |
| Graduate / Professional | 18,659 | 3.8% |
| Total | 484,169 | 100.0% |
School Enrollment by Age by Funding Source in Idaho
Out of a total of 484,169 students who are enrolled in schools in Idaho, 86,666 (17.9%) attend a private institution, while the remaining 397,503 (82.1%) are enrolled in public schools. The age group of 3 to 4 year olds has the highest likelihood of being enrolled in private schools, with 9,330 (53.8% in the age bracket) enrolled. Conversely, the age group of 15 to 17 year olds has the lowest likelihood of being enrolled in a private school, with 70,358 (90.5% in the age bracket) attending a public institution.
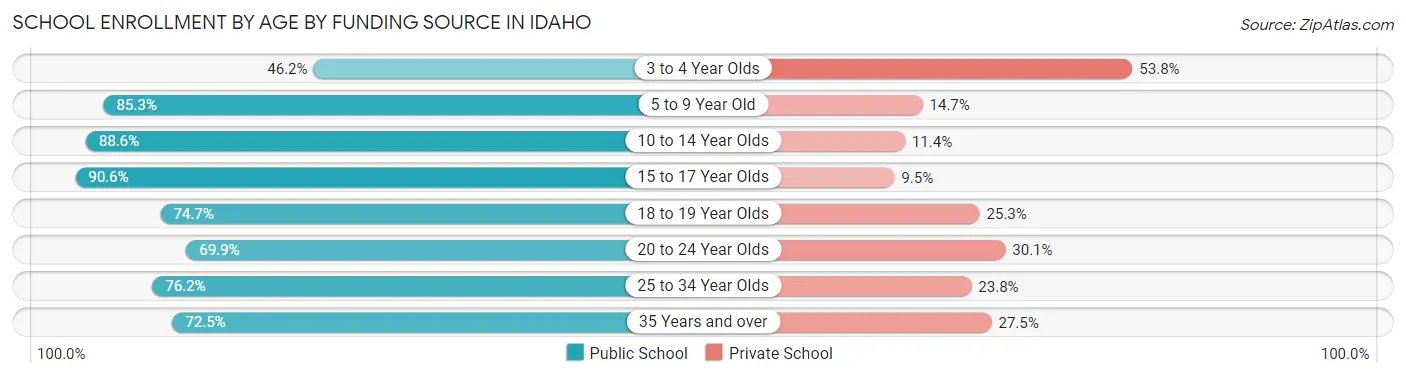
| Age Bracket | Public School | Private School |
| 3 to 4 Year Olds | 8,019 (46.2%) | 9,330 (53.8%) |
| 5 to 9 Year Old | 99,133 (85.3%) | 17,078 (14.7%) |
| 10 to 14 Year Olds | 117,862 (88.6%) | 15,192 (11.4%) |
| 15 to 17 Year Olds | 70,358 (90.5%) | 7,341 (9.5%) |
| 18 to 19 Year Olds | 31,925 (74.7%) | 10,825 (25.3%) |
| 20 to 24 Year Olds | 32,431 (69.9%) | 13,976 (30.1%) |
| 25 to 34 Year Olds | 22,066 (76.2%) | 6,890 (23.8%) |
| 35 Years and over | 15,756 (72.5%) | 5,987 (27.5%) |
| Total | 397,503 (82.1%) | 86,666 (17.9%) |
Educational Attainment by Field of Study in Idaho
Business (70,435 | 17.8%), education (55,037 | 13.9%), science & technology (46,797 | 11.8%), bio, nature & agricultural (34,798 | 8.8%), and arts & humanities (27,158 | 6.9%) are the most common fields of study among 395,909 individuals in Idaho who have obtained a bachelor's degree or higher.
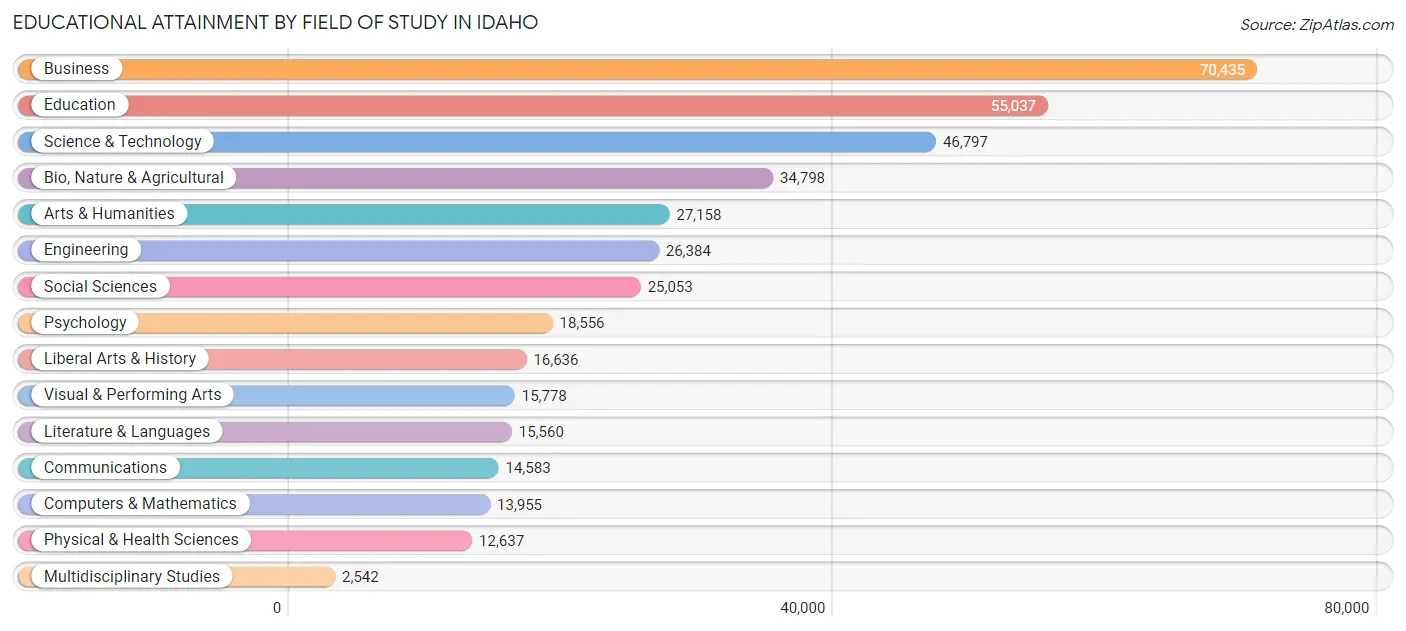
| Field of Study | # Graduates | % Graduates |
| Computers & Mathematics | 13,955 | 3.5% |
| Bio, Nature & Agricultural | 34,798 | 8.8% |
| Physical & Health Sciences | 12,637 | 3.2% |
| Psychology | 18,556 | 4.7% |
| Social Sciences | 25,053 | 6.3% |
| Engineering | 26,384 | 6.7% |
| Multidisciplinary Studies | 2,542 | 0.6% |
| Science & Technology | 46,797 | 11.8% |
| Business | 70,435 | 17.8% |
| Education | 55,037 | 13.9% |
| Literature & Languages | 15,560 | 3.9% |
| Liberal Arts & History | 16,636 | 4.2% |
| Visual & Performing Arts | 15,778 | 4.0% |
| Communications | 14,583 | 3.7% |
| Arts & Humanities | 27,158 | 6.9% |
| Total | 395,909 | 100.0% |
Transportation & Commute in Idaho
Vehicle Availability by Sex in Idaho
The most prevalent vehicle ownership categories in Idaho are males with 2 vehicles (179,470, accounting for 38.4%) and females with 2 vehicles (144,325, making up 46.8%).
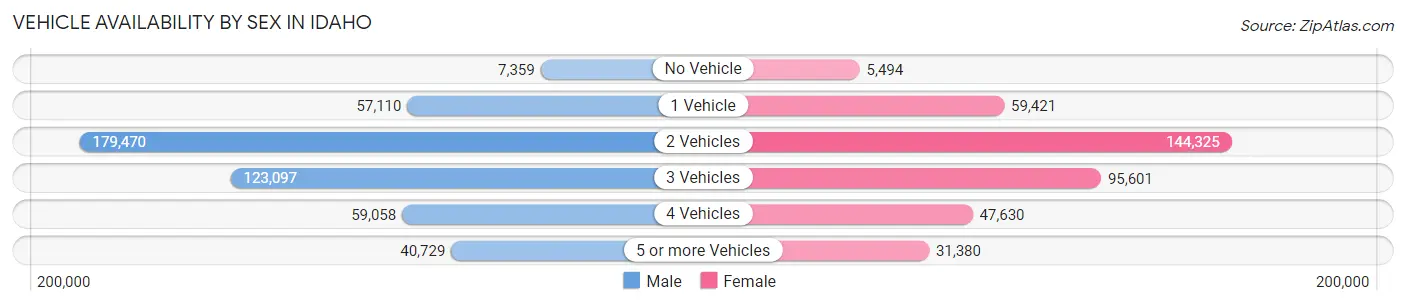
| Vehicles Available | Male | Female |
| No Vehicle | 7,359 (1.6%) | 5,494 (1.4%) |
| 1 Vehicle | 57,110 (12.2%) | 59,421 (15.5%) |
| 2 Vehicles | 179,470 (38.4%) | 144,325 (37.6%) |
| 3 Vehicles | 123,097 (26.4%) | 95,601 (24.9%) |
| 4 Vehicles | 59,058 (12.7%) | 47,630 (12.4%) |
| 5 or more Vehicles | 40,729 (8.7%) | 31,380 (8.2%) |
| Total | 466,823 (100.0%) | 383,851 (100.0%) |
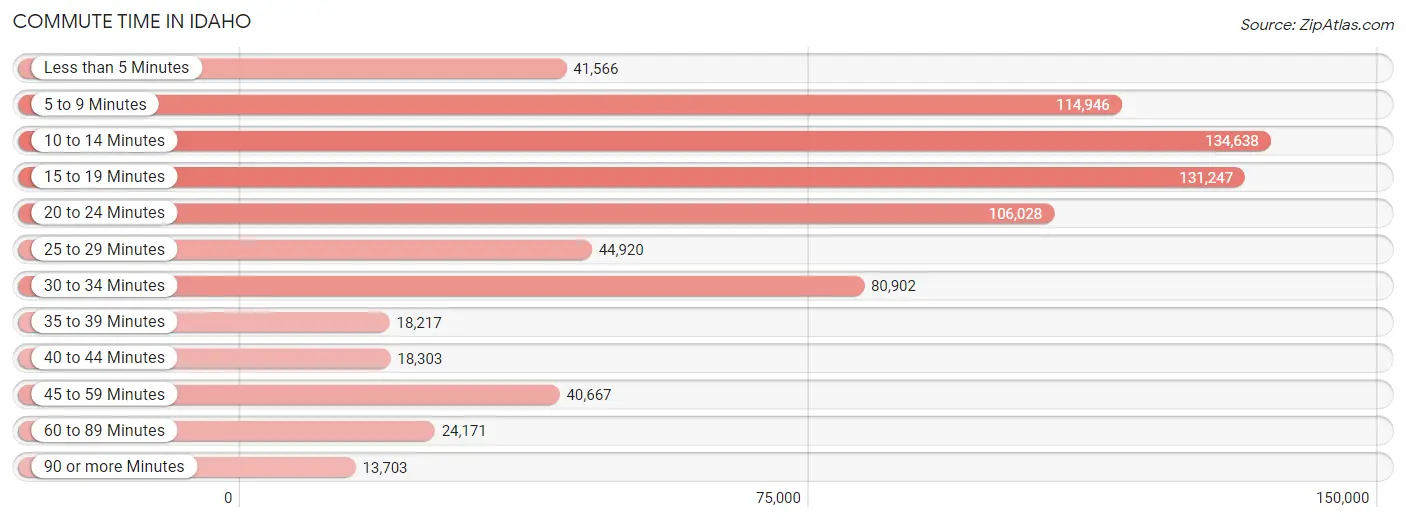
Commute Time in Idaho
The most frequently occuring commute durations in Idaho are 10 to 14 minutes (134,638 commuters, 17.5%), 15 to 19 minutes (131,247 commuters, 17.1%), and 5 to 9 minutes (114,946 commuters, 14.9%).
| Commute Time | # Commuters | % Commuters |
| Less than 5 Minutes | 41,566 | 5.4% |
| 5 to 9 Minutes | 114,946 | 14.9% |
| 10 to 14 Minutes | 134,638 | 17.5% |
| 15 to 19 Minutes | 131,247 | 17.1% |
| 20 to 24 Minutes | 106,028 | 13.8% |
| 25 to 29 Minutes | 44,920 | 5.8% |
| 30 to 34 Minutes | 80,902 | 10.5% |
| 35 to 39 Minutes | 18,217 | 2.4% |
| 40 to 44 Minutes | 18,303 | 2.4% |
| 45 to 59 Minutes | 40,667 | 5.3% |
| 60 to 89 Minutes | 24,171 | 3.1% |
| 90 or more Minutes | 13,703 | 1.8% |
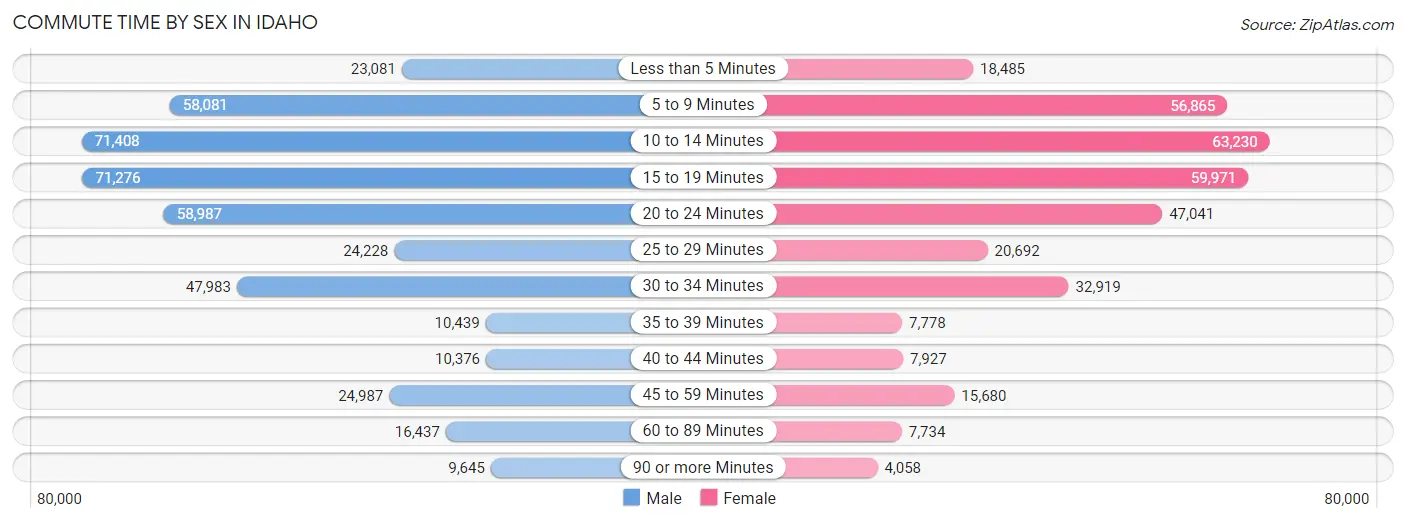
Commute Time by Sex in Idaho
The most common commute times in Idaho are 10 to 14 minutes (71,408 commuters, 16.7%) for males and 10 to 14 minutes (63,230 commuters, 18.5%) for females.
| Commute Time | Male | Female |
| Less than 5 Minutes | 23,081 (5.4%) | 18,485 (5.4%) |
| 5 to 9 Minutes | 58,081 (13.6%) | 56,865 (16.6%) |
| 10 to 14 Minutes | 71,408 (16.7%) | 63,230 (18.5%) |
| 15 to 19 Minutes | 71,276 (16.7%) | 59,971 (17.5%) |
| 20 to 24 Minutes | 58,987 (13.8%) | 47,041 (13.7%) |
| 25 to 29 Minutes | 24,228 (5.7%) | 20,692 (6.0%) |
| 30 to 34 Minutes | 47,983 (11.2%) | 32,919 (9.6%) |
| 35 to 39 Minutes | 10,439 (2.5%) | 7,778 (2.3%) |
| 40 to 44 Minutes | 10,376 (2.4%) | 7,927 (2.3%) |
| 45 to 59 Minutes | 24,987 (5.9%) | 15,680 (4.6%) |
| 60 to 89 Minutes | 16,437 (3.8%) | 7,734 (2.3%) |
| 90 or more Minutes | 9,645 (2.3%) | 4,058 (1.2%) |
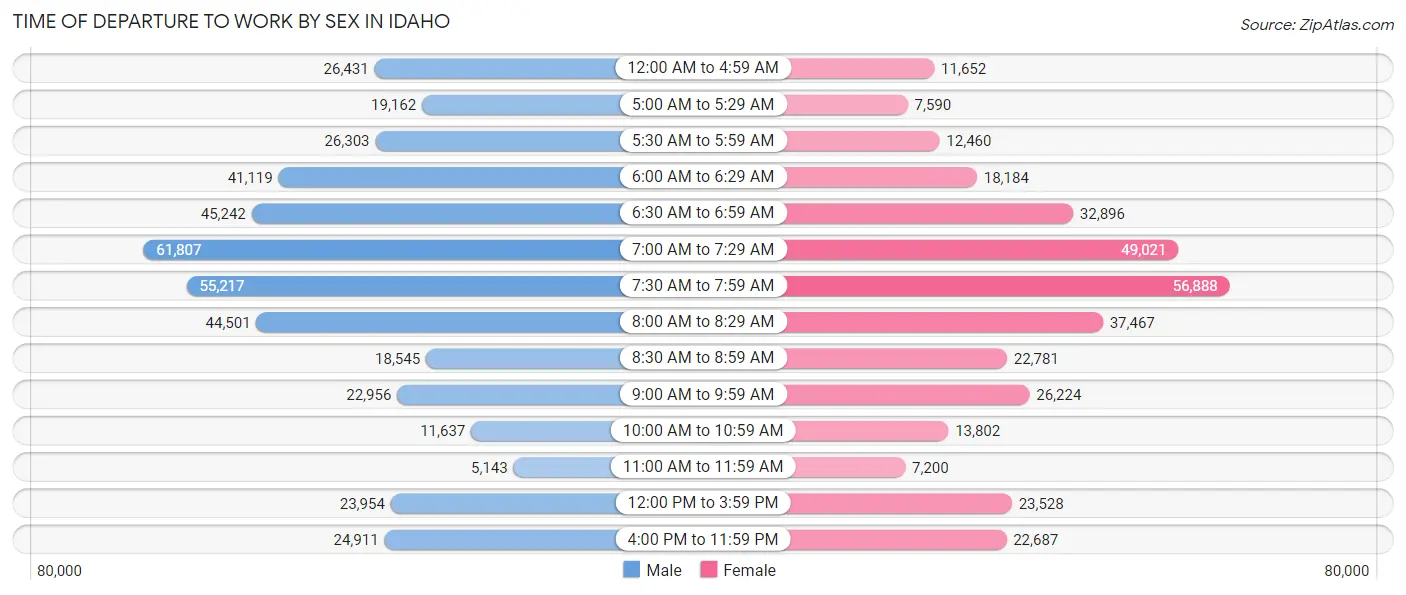
Time of Departure to Work by Sex in Idaho
The most frequent times of departure to work in Idaho are 7:00 AM to 7:29 AM (61,807, 14.5%) for males and 7:30 AM to 7:59 AM (56,888, 16.6%) for females.
| Time of Departure | Male | Female |
| 12:00 AM to 4:59 AM | 26,431 (6.2%) | 11,652 (3.4%) |
| 5:00 AM to 5:29 AM | 19,162 (4.5%) | 7,590 (2.2%) |
| 5:30 AM to 5:59 AM | 26,303 (6.2%) | 12,460 (3.6%) |
| 6:00 AM to 6:29 AM | 41,119 (9.6%) | 18,184 (5.3%) |
| 6:30 AM to 6:59 AM | 45,242 (10.6%) | 32,896 (9.6%) |
| 7:00 AM to 7:29 AM | 61,807 (14.5%) | 49,021 (14.3%) |
| 7:30 AM to 7:59 AM | 55,217 (12.9%) | 56,888 (16.6%) |
| 8:00 AM to 8:29 AM | 44,501 (10.4%) | 37,467 (10.9%) |
| 8:30 AM to 8:59 AM | 18,545 (4.3%) | 22,781 (6.7%) |
| 9:00 AM to 9:59 AM | 22,956 (5.4%) | 26,224 (7.7%) |
| 10:00 AM to 10:59 AM | 11,637 (2.7%) | 13,802 (4.0%) |
| 11:00 AM to 11:59 AM | 5,143 (1.2%) | 7,200 (2.1%) |
| 12:00 PM to 3:59 PM | 23,954 (5.6%) | 23,528 (6.9%) |
| 4:00 PM to 11:59 PM | 24,911 (5.8%) | 22,687 (6.6%) |
| Total | 426,928 (100.0%) | 342,380 (100.0%) |
Housing Occupancy in Idaho
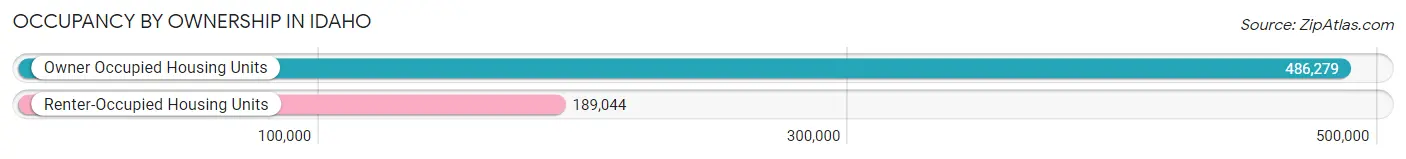
Occupancy by Ownership in Idaho
Of the total 675,323 dwellings in Idaho, owner-occupied units account for 486,279 (72.0%), while renter-occupied units make up 189,044 (28.0%).
| Occupancy | # Housing Units | % Housing Units |
| Owner Occupied Housing Units | 486,279 | 72.0% |
| Renter-Occupied Housing Units | 189,044 | 28.0% |
| Total Occupied Housing Units | 675,323 | 100.0% |
Occupancy by Household Size in Idaho
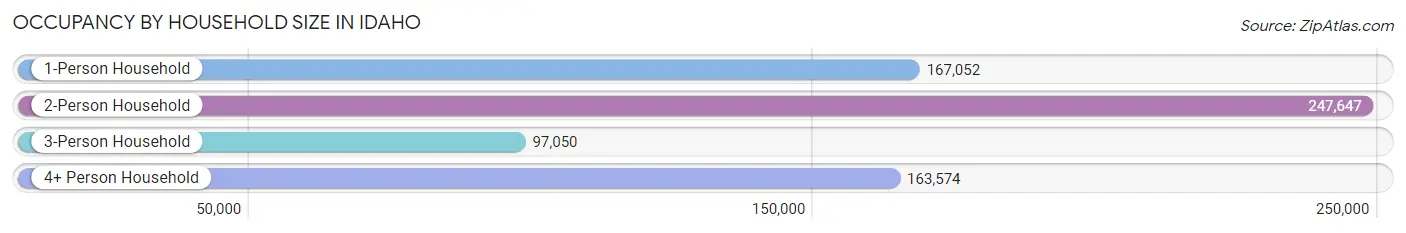
| Household Size | # Housing Units | % Housing Units |
| 1-Person Household | 167,052 | 24.7% |
| 2-Person Household | 247,647 | 36.7% |
| 3-Person Household | 97,050 | 14.4% |
| 4+ Person Household | 163,574 | 24.2% |
| Total Housing Units | 675,323 | 100.0% |
Occupancy by Ownership by Household Size in Idaho
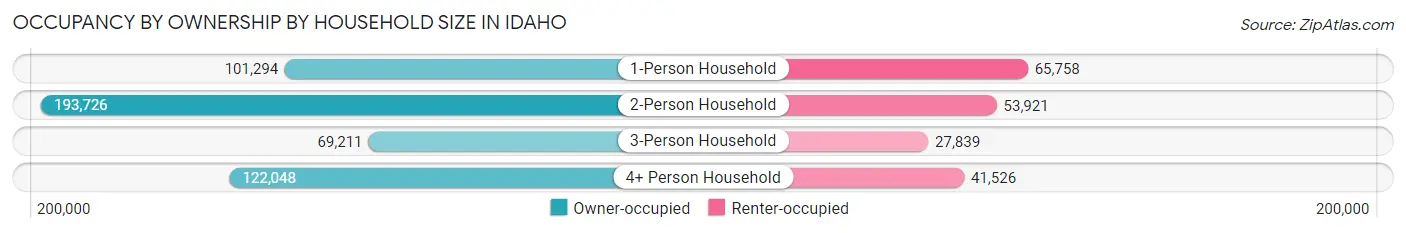
| Household Size | Owner-occupied | Renter-occupied |
| 1-Person Household | 101,294 (60.6%) | 65,758 (39.4%) |
| 2-Person Household | 193,726 (78.2%) | 53,921 (21.8%) |
| 3-Person Household | 69,211 (71.3%) | 27,839 (28.7%) |
| 4+ Person Household | 122,048 (74.6%) | 41,526 (25.4%) |
| Total Housing Units | 486,279 (72.0%) | 189,044 (28.0%) |
Occupancy by Educational Attainment in Idaho
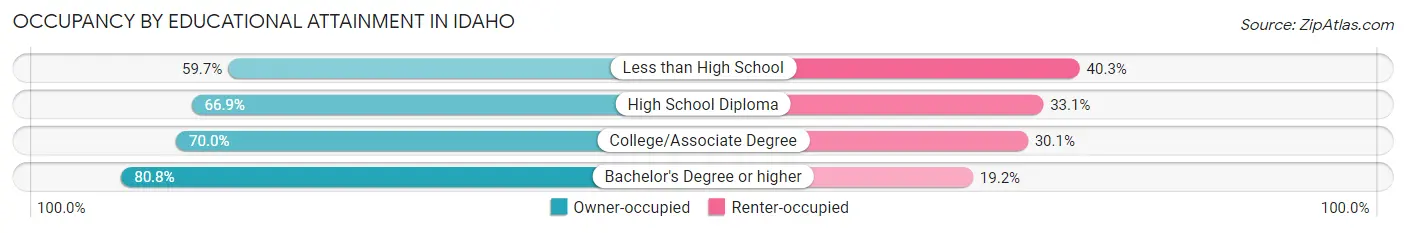
| Household Size | Owner-occupied | Renter-occupied |
| Less than High School | 28,889 (59.7%) | 19,535 (40.3%) |
| High School Diploma | 106,311 (66.9%) | 52,656 (33.1%) |
| College/Associate Degree | 174,305 (70.0%) | 74,891 (30.0%) |
| Bachelor's Degree or higher | 176,774 (80.8%) | 41,962 (19.2%) |
Occupancy by Age of Householder in Idaho
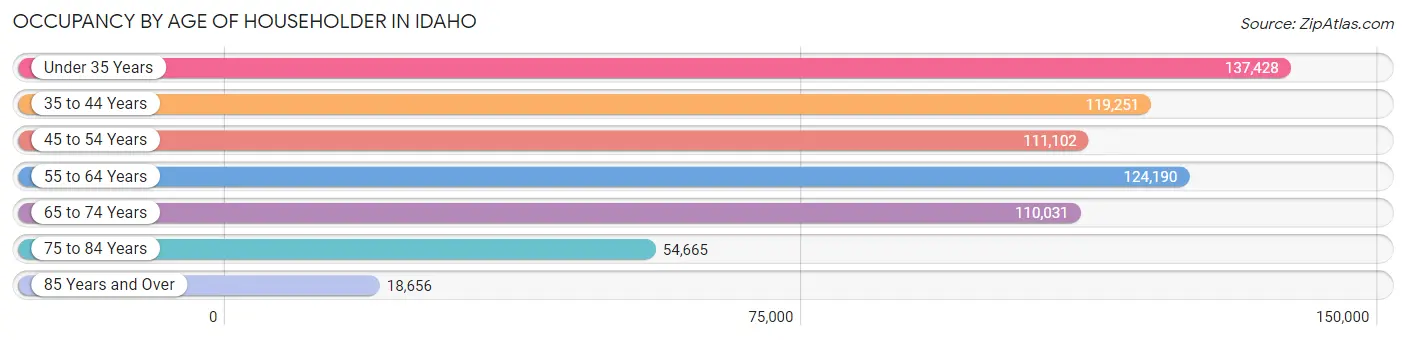
| Age Bracket | # Households | % Households |
| Under 35 Years | 137,428 | 20.3% |
| 35 to 44 Years | 119,251 | 17.7% |
| 45 to 54 Years | 111,102 | 16.5% |
| 55 to 64 Years | 124,190 | 18.4% |
| 65 to 74 Years | 110,031 | 16.3% |
| 75 to 84 Years | 54,665 | 8.1% |
| 85 Years and Over | 18,656 | 2.8% |
| Total | 675,323 | 100.0% |
Housing Finances in Idaho
Median Income by Occupancy in Idaho
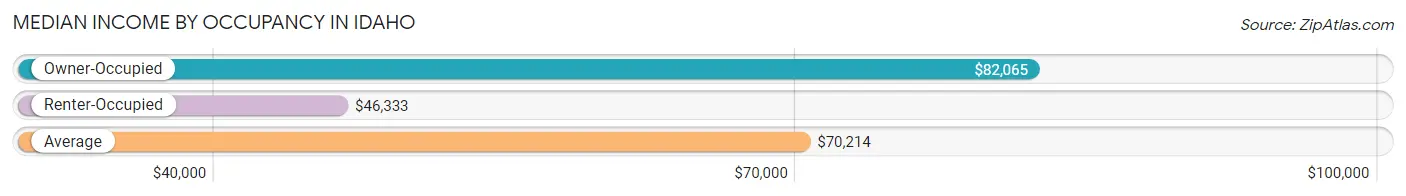
| Occupancy Type | # Households | Median Income |
| Owner-Occupied | 486,279 (72.0%) | $82,065 |
| Renter-Occupied | 189,044 (28.0%) | $46,333 |
| Average | 675,323 (100.0%) | $70,214 |
Occupancy by Householder Income Bracket in Idaho
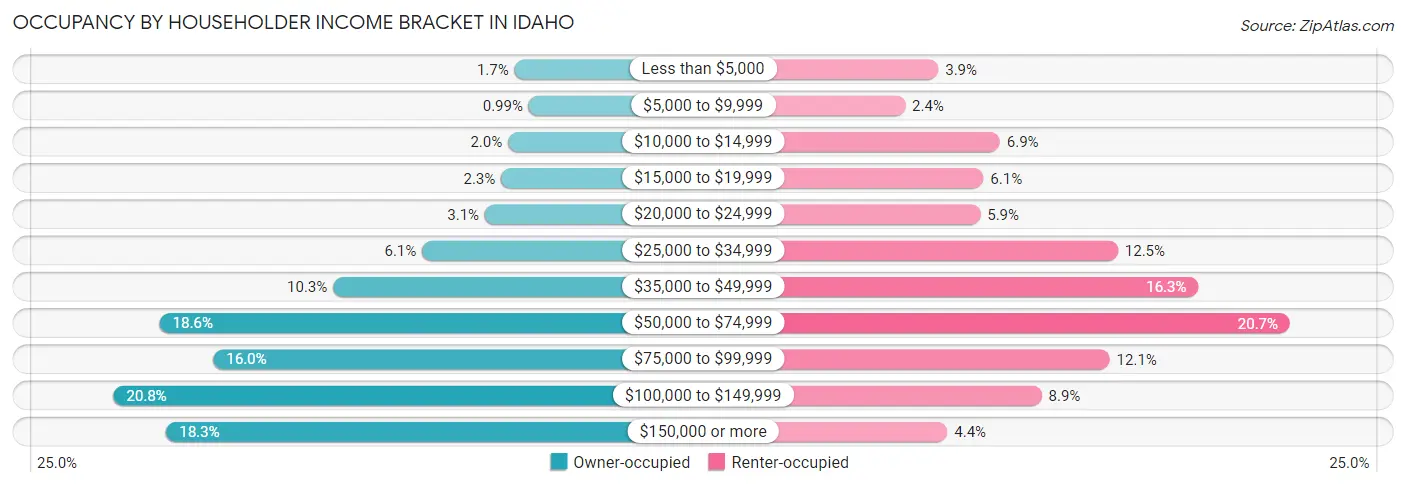
| Income Bracket | Owner-occupied | Renter-occupied |
| Less than $5,000 | 8,134 (1.7%) | 7,452 (3.9%) |
| $5,000 to $9,999 | 4,822 (1.0%) | 4,452 (2.4%) |
| $10,000 to $14,999 | 9,622 (2.0%) | 12,984 (6.9%) |
| $15,000 to $19,999 | 11,225 (2.3%) | 11,508 (6.1%) |
| $20,000 to $24,999 | 14,976 (3.1%) | 11,224 (5.9%) |
| $25,000 to $34,999 | 29,531 (6.1%) | 23,615 (12.5%) |
| $35,000 to $49,999 | 50,114 (10.3%) | 30,847 (16.3%) |
| $50,000 to $74,999 | 90,302 (18.6%) | 39,096 (20.7%) |
| $75,000 to $99,999 | 77,838 (16.0%) | 22,868 (12.1%) |
| $100,000 to $149,999 | 100,984 (20.8%) | 16,741 (8.9%) |
| $150,000 or more | 88,731 (18.2%) | 8,257 (4.4%) |
| Total | 486,279 (100.0%) | 189,044 (100.0%) |
Monthly Housing Cost Tiers in Idaho
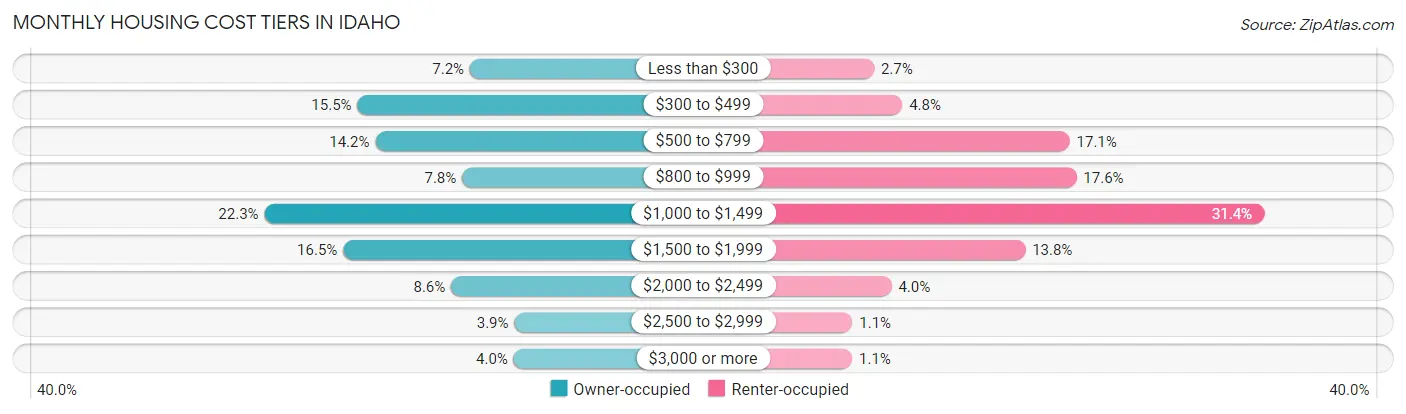
| Monthly Cost | Owner-occupied | Renter-occupied |
| Less than $300 | 35,027 (7.2%) | 5,085 (2.7%) |
| $300 to $499 | 75,306 (15.5%) | 9,024 (4.8%) |
| $500 to $799 | 68,883 (14.2%) | 32,319 (17.1%) |
| $800 to $999 | 37,823 (7.8%) | 33,272 (17.6%) |
| $1,000 to $1,499 | 108,611 (22.3%) | 59,373 (31.4%) |
| $1,500 to $1,999 | 80,425 (16.5%) | 26,136 (13.8%) |
| $2,000 to $2,499 | 41,756 (8.6%) | 7,528 (4.0%) |
| $2,500 to $2,999 | 19,096 (3.9%) | 2,080 (1.1%) |
| $3,000 or more | 19,352 (4.0%) | 2,037 (1.1%) |
| Total | 486,279 (100.0%) | 189,044 (100.0%) |
Physical Housing Characteristics in Idaho
Housing Structures in Idaho
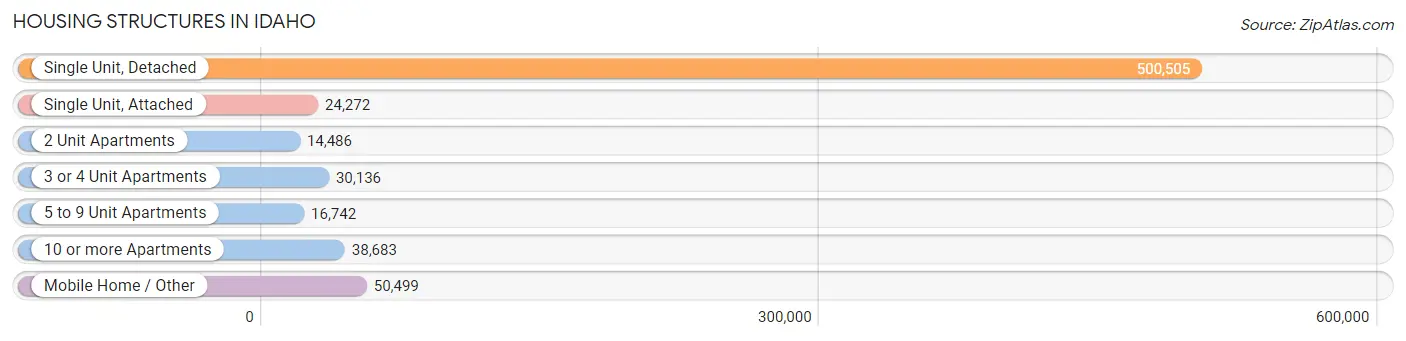
| Structure Type | # Housing Units | % Housing Units |
| Single Unit, Detached | 500,505 | 74.1% |
| Single Unit, Attached | 24,272 | 3.6% |
| 2 Unit Apartments | 14,486 | 2.1% |
| 3 or 4 Unit Apartments | 30,136 | 4.5% |
| 5 to 9 Unit Apartments | 16,742 | 2.5% |
| 10 or more Apartments | 38,683 | 5.7% |
| Mobile Home / Other | 50,499 | 7.5% |
| Total | 675,323 | 100.0% |
Housing Structures by Occupancy in Idaho
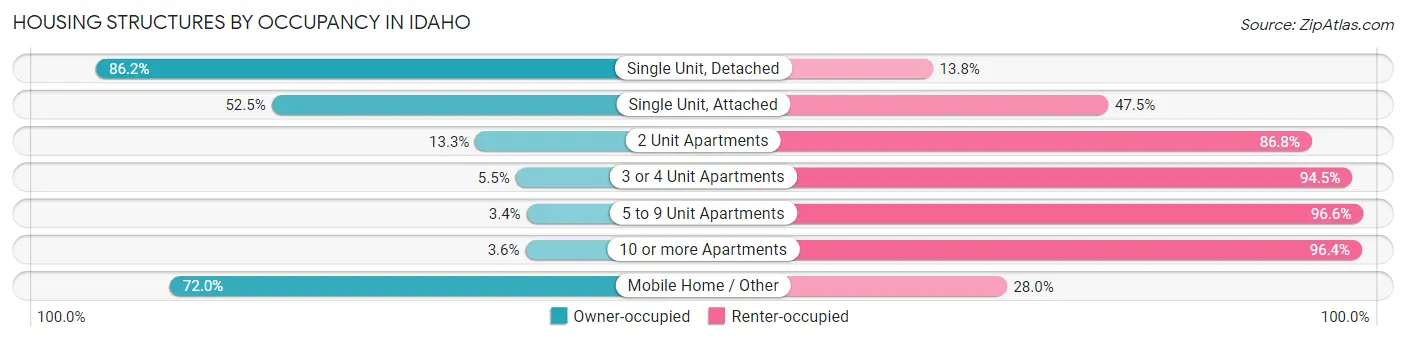
| Structure Type | Owner-occupied | Renter-occupied |
| Single Unit, Detached | 431,654 (86.2%) | 68,851 (13.8%) |
| Single Unit, Attached | 12,732 (52.5%) | 11,540 (47.5%) |
| 2 Unit Apartments | 1,919 (13.3%) | 12,567 (86.8%) |
| 3 or 4 Unit Apartments | 1,650 (5.5%) | 28,486 (94.5%) |
| 5 to 9 Unit Apartments | 564 (3.4%) | 16,178 (96.6%) |
| 10 or more Apartments | 1,393 (3.6%) | 37,290 (96.4%) |
| Mobile Home / Other | 36,367 (72.0%) | 14,132 (28.0%) |
| Total | 486,279 (72.0%) | 189,044 (28.0%) |
Housing Structures by Number of Rooms in Idaho
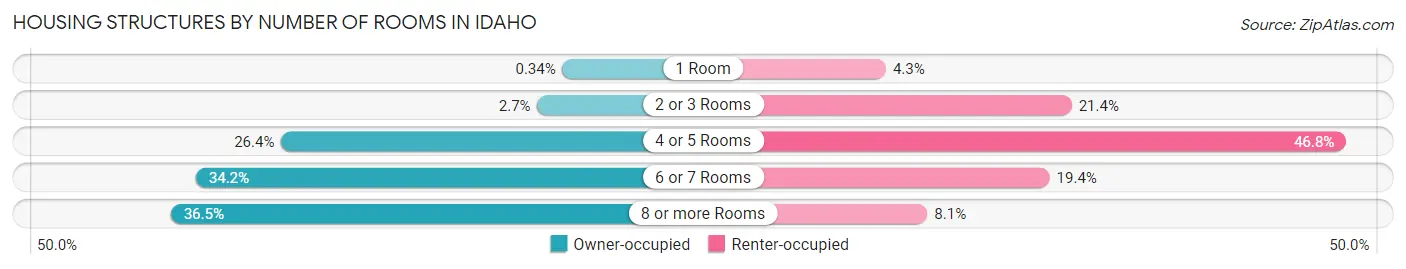
| Number of Rooms | Owner-occupied | Renter-occupied |
| 1 Room | 1,655 (0.3%) | 8,045 (4.3%) |
| 2 or 3 Rooms | 12,916 (2.7%) | 40,523 (21.4%) |
| 4 or 5 Rooms | 128,201 (26.4%) | 88,511 (46.8%) |
| 6 or 7 Rooms | 166,128 (34.2%) | 36,680 (19.4%) |
| 8 or more Rooms | 177,379 (36.5%) | 15,285 (8.1%) |
| Total | 486,279 (100.0%) | 189,044 (100.0%) |
Housing Structure by Heating Type in Idaho
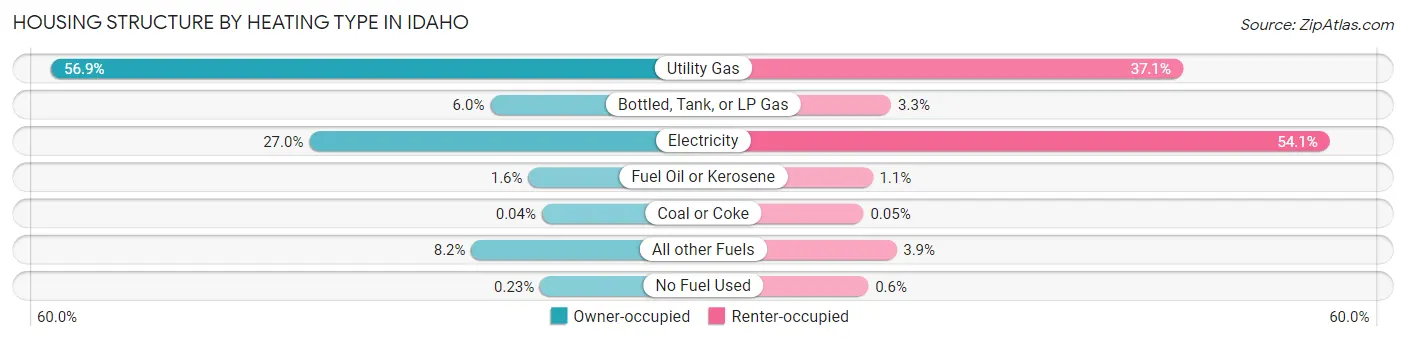
| Heating Type | Owner-occupied | Renter-occupied |
| Utility Gas | 276,795 (56.9%) | 70,080 (37.1%) |
| Bottled, Tank, or LP Gas | 29,219 (6.0%) | 6,165 (3.3%) |
| Electricity | 131,316 (27.0%) | 102,241 (54.1%) |
| Fuel Oil or Kerosene | 7,741 (1.6%) | 2,058 (1.1%) |
| Coal or Coke | 199 (0.0%) | 88 (0.1%) |
| All other Fuels | 39,880 (8.2%) | 7,282 (3.8%) |
| No Fuel Used | 1,129 (0.2%) | 1,130 (0.6%) |
| Total | 486,279 (100.0%) | 189,044 (100.0%) |
Household Vehicle Usage in Idaho
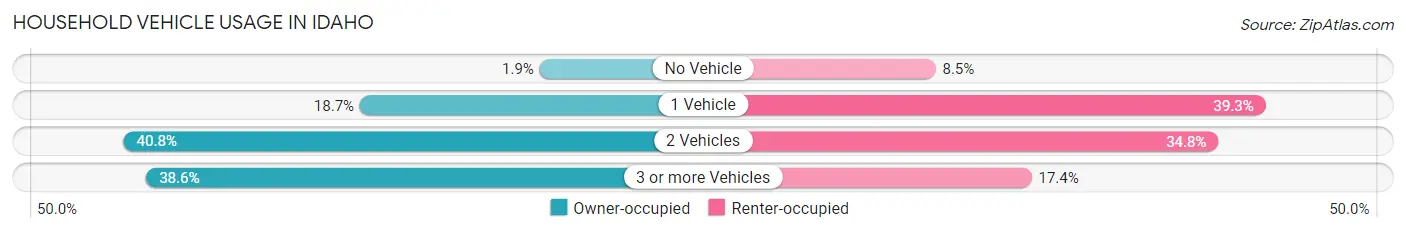
| Vehicles per Household | Owner-occupied | Renter-occupied |
| No Vehicle | 9,326 (1.9%) | 15,999 (8.5%) |
| 1 Vehicle | 90,923 (18.7%) | 74,247 (39.3%) |
| 2 Vehicles | 198,135 (40.7%) | 65,858 (34.8%) |
| 3 or more Vehicles | 187,895 (38.6%) | 32,940 (17.4%) |
| Total | 486,279 (100.0%) | 189,044 (100.0%) |
Real Estate & Mortgages in Idaho
Real Estate and Mortgage Overview in Idaho
| Characteristic | Without Mortgage | With Mortgage |
| Housing Units | 176,807 | 309,472 |
| Median Property Value | $297,100 | $347,900 |
| Median Household Income | $64,078 | $65,025 |
| Monthly Housing Costs | $449 | $19,012 |
| Real Estate Taxes | $1,746 | $8,375 |
Property Value by Mortgage Status in Idaho
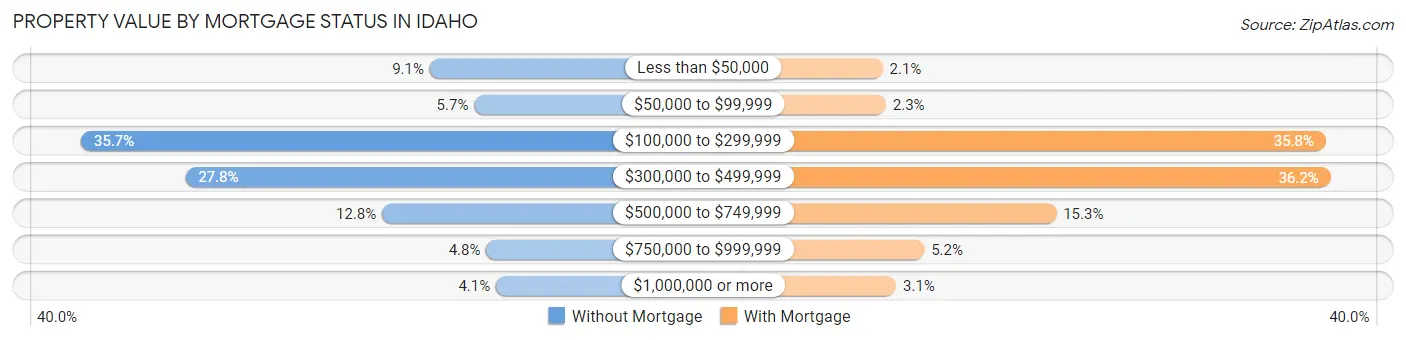
| Property Value | Without Mortgage | With Mortgage |
| Less than $50,000 | 16,147 (9.1%) | 6,377 (2.1%) |
| $50,000 to $99,999 | 10,143 (5.7%) | 7,134 (2.3%) |
| $100,000 to $299,999 | 63,142 (35.7%) | 110,878 (35.8%) |
| $300,000 to $499,999 | 49,087 (27.8%) | 112,020 (36.2%) |
| $500,000 to $749,999 | 22,552 (12.8%) | 47,303 (15.3%) |
| $750,000 to $999,999 | 8,526 (4.8%) | 16,184 (5.2%) |
| $1,000,000 or more | 7,210 (4.1%) | 9,576 (3.1%) |
| Total | 176,807 (100.0%) | 309,472 (100.0%) |
Household Income by Mortgage Status in Idaho
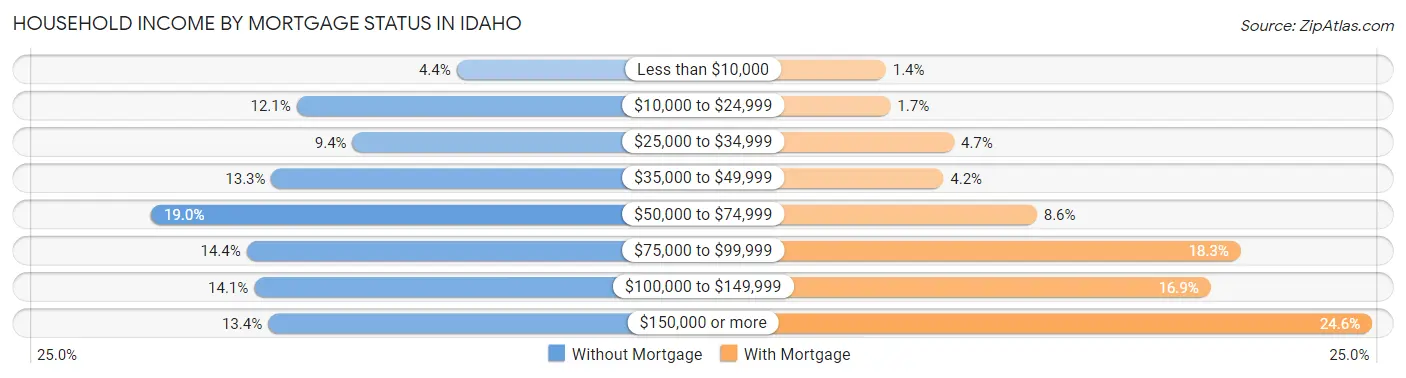
| Household Income | Without Mortgage | With Mortgage |
| Less than $10,000 | 7,827 (4.4%) | 4,470 (1.4%) |
| $10,000 to $24,999 | 21,297 (12.0%) | 5,129 (1.7%) |
| $25,000 to $34,999 | 16,604 (9.4%) | 14,526 (4.7%) |
| $35,000 to $49,999 | 23,421 (13.3%) | 12,927 (4.2%) |
| $50,000 to $74,999 | 33,555 (19.0%) | 26,693 (8.6%) |
| $75,000 to $99,999 | 25,516 (14.4%) | 56,747 (18.3%) |
| $100,000 to $149,999 | 24,881 (14.1%) | 52,322 (16.9%) |
| $150,000 or more | 23,706 (13.4%) | 76,103 (24.6%) |
| Total | 176,807 (100.0%) | 309,472 (100.0%) |
Property Value to Household Income Ratio in Idaho
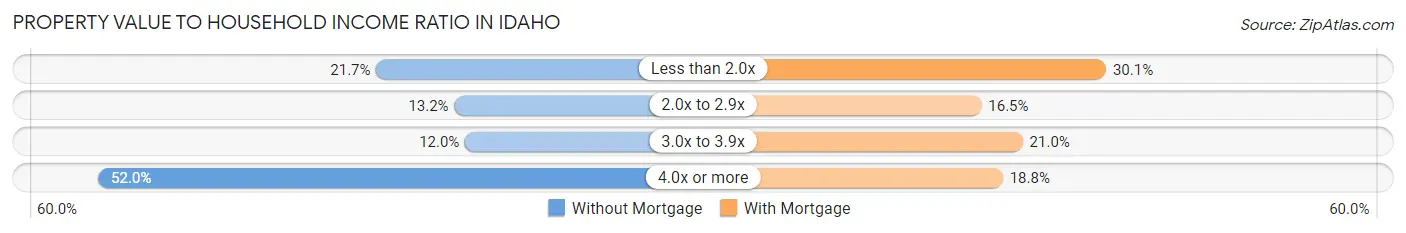
| Value-to-Income Ratio | Without Mortgage | With Mortgage |
| Less than 2.0x | 38,310 (21.7%) | 93,096 (30.1%) |
| 2.0x to 2.9x | 23,269 (13.2%) | 51,058 (16.5%) |
| 3.0x to 3.9x | 21,207 (12.0%) | 64,989 (21.0%) |
| 4.0x or more | 91,947 (52.0%) | 58,271 (18.8%) |
| Total | 176,807 (100.0%) | 309,472 (100.0%) |
Real Estate Taxes by Mortgage Status in Idaho
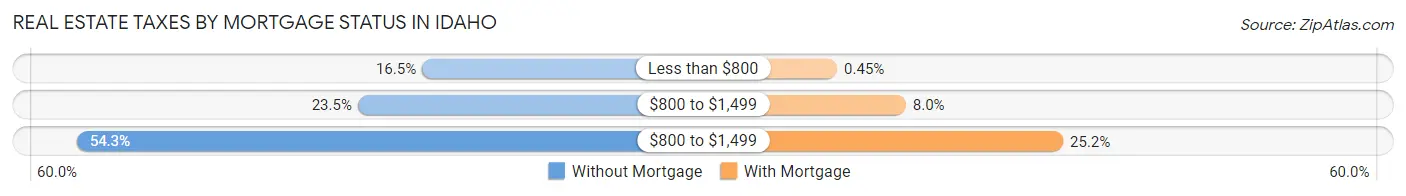
| Property Taxes | Without Mortgage | With Mortgage |
| Less than $800 | 29,080 (16.5%) | 1,401 (0.4%) |
| $800 to $1,499 | 41,538 (23.5%) | 24,703 (8.0%) |
| $800 to $1,499 | 95,976 (54.3%) | 78,031 (25.2%) |
| Total | 176,807 (100.0%) | 309,472 (100.0%) |
Health & Disability in Idaho
Health Insurance Coverage by Age in Idaho
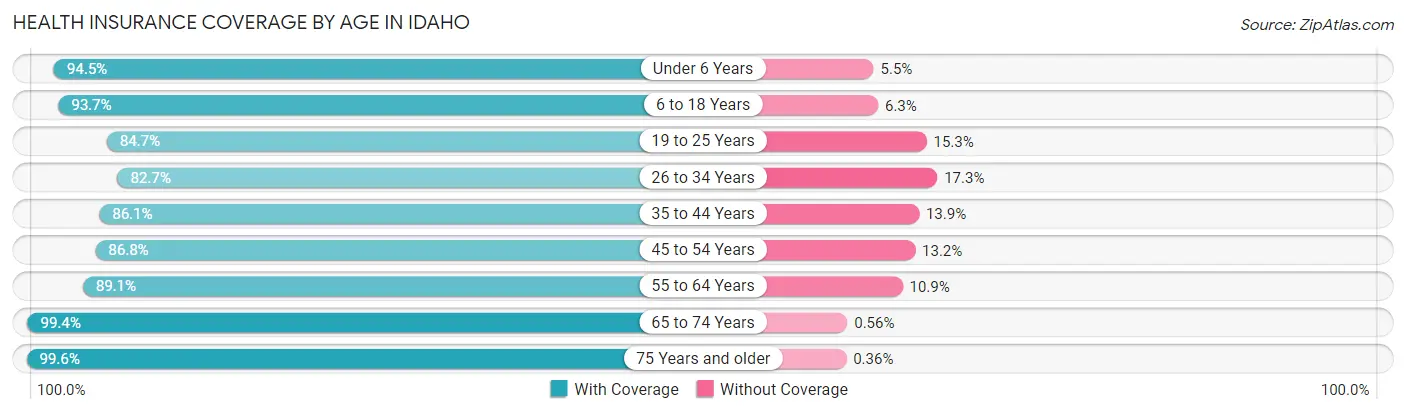
| Age Bracket | With Coverage | Without Coverage |
| Under 6 Years | 129,965 (94.5%) | 7,520 (5.5%) |
| 6 to 18 Years | 327,686 (93.7%) | 21,981 (6.3%) |
| 19 to 25 Years | 147,312 (84.7%) | 26,672 (15.3%) |
| 26 to 34 Years | 174,158 (82.7%) | 36,502 (17.3%) |
| 35 to 44 Years | 201,648 (86.1%) | 32,648 (13.9%) |
| 45 to 54 Years | 179,347 (86.8%) | 27,295 (13.2%) |
| 55 to 64 Years | 196,281 (89.1%) | 23,921 (10.9%) |
| 65 to 74 Years | 181,159 (99.4%) | 1,027 (0.6%) |
| 75 Years and older | 112,327 (99.6%) | 410 (0.4%) |
| Total | 1,649,883 (90.3%) | 177,976 (9.7%) |
Health Insurance Coverage by Citizenship Status in Idaho
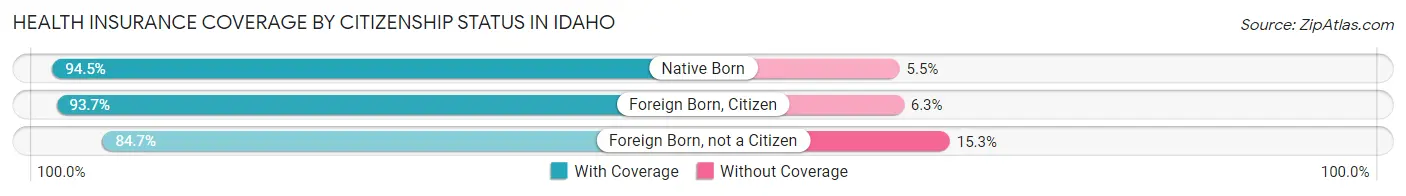
| Citizenship Status | With Coverage | Without Coverage |
| Native Born | 129,965 (94.5%) | 7,520 (5.5%) |
| Foreign Born, Citizen | 327,686 (93.7%) | 21,981 (6.3%) |
| Foreign Born, not a Citizen | 147,312 (84.7%) | 26,672 (15.3%) |
Health Insurance Coverage by Household Income in Idaho
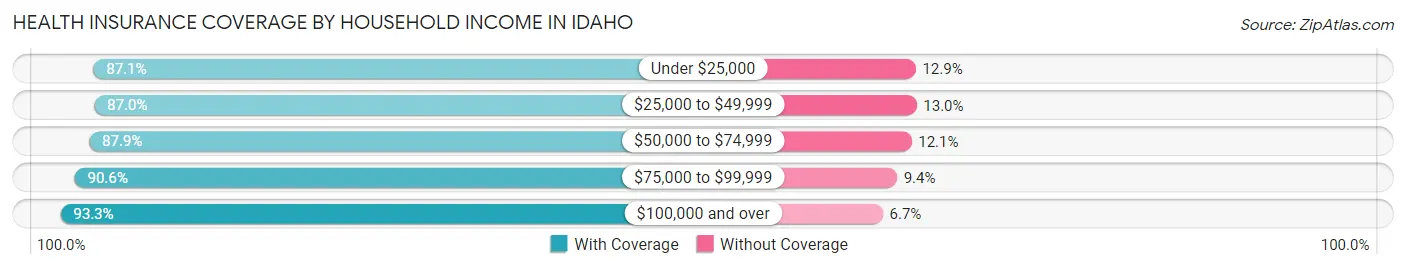
| Household Income | With Coverage | Without Coverage |
| Under $25,000 | 146,747 (87.1%) | 21,670 (12.9%) |
| $25,000 to $49,999 | 252,166 (87.0%) | 37,765 (13.0%) |
| $50,000 to $74,999 | 301,764 (87.9%) | 41,510 (12.1%) |
| $75,000 to $99,999 | 266,798 (90.6%) | 27,537 (9.4%) |
| $100,000 and over | 657,865 (93.3%) | 47,316 (6.7%) |
Public vs Private Health Insurance Coverage by Age in Idaho
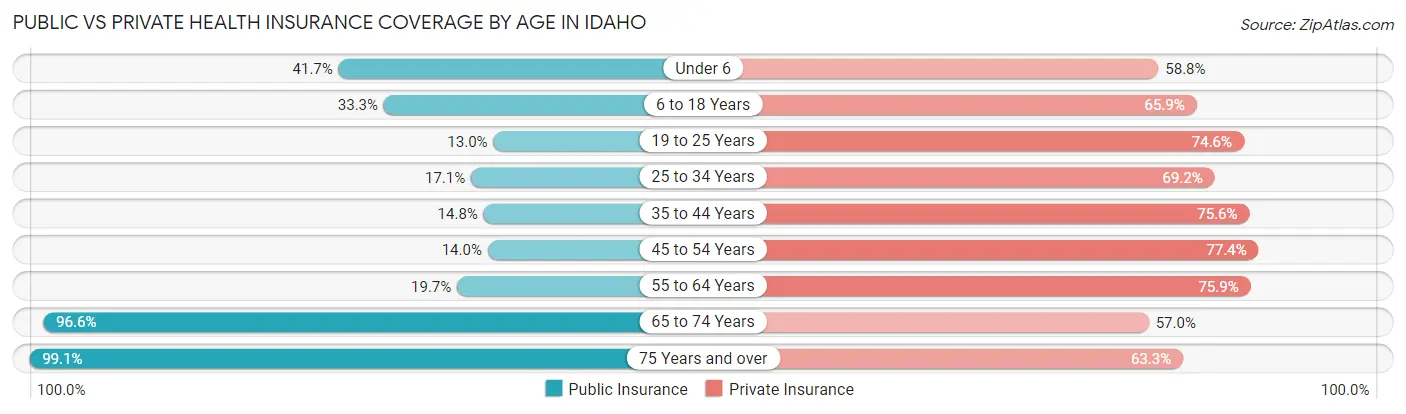
| Age Bracket | Public Insurance | Private Insurance |
| Under 6 | 57,342 (41.7%) | 80,781 (58.8%) |
| 6 to 18 Years | 116,498 (33.3%) | 230,302 (65.9%) |
| 19 to 25 Years | 22,583 (13.0%) | 129,824 (74.6%) |
| 25 to 34 Years | 36,092 (17.1%) | 145,780 (69.2%) |
| 35 to 44 Years | 34,662 (14.8%) | 177,219 (75.6%) |
| 45 to 54 Years | 28,992 (14.0%) | 159,860 (77.4%) |
| 55 to 64 Years | 43,425 (19.7%) | 167,034 (75.8%) |
| 65 to 74 Years | 175,902 (96.6%) | 103,793 (57.0%) |
| 75 Years and over | 111,766 (99.1%) | 71,392 (63.3%) |
| Total | 627,262 (34.3%) | 1,265,985 (69.3%) |
Disability Status by Sex by Age in Idaho
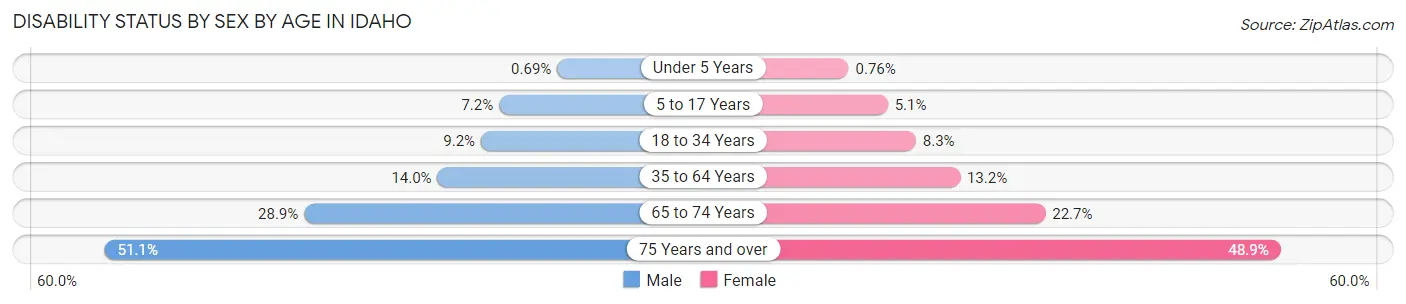
| Age Bracket | Male | Female |
| Under 5 Years | 398 (0.7%) | 416 (0.8%) |
| 5 to 17 Years | 12,567 (7.2%) | 8,490 (5.1%) |
| 18 to 34 Years | 19,255 (9.2%) | 17,156 (8.3%) |
| 35 to 64 Years | 46,648 (14.0%) | 43,209 (13.2%) |
| 65 to 74 Years | 25,779 (28.9%) | 21,055 (22.7%) |
| 75 Years and over | 26,202 (51.1%) | 30,026 (48.9%) |
Disability Class by Sex by Age in Idaho
Disability Class: Hearing Difficulty
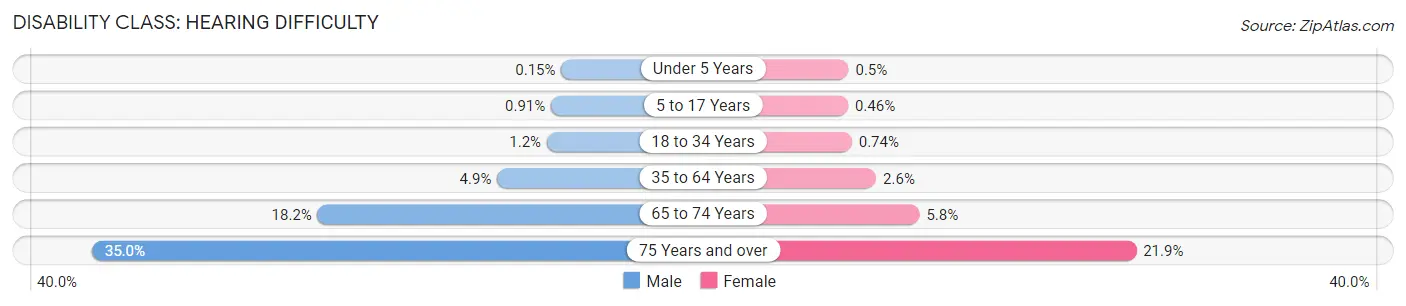
| Age Bracket | Male | Female |
| Under 5 Years | 88 (0.2%) | 276 (0.5%) |
| 5 to 17 Years | 1,603 (0.9%) | 756 (0.5%) |
| 18 to 34 Years | 2,550 (1.2%) | 1,549 (0.7%) |
| 35 to 64 Years | 16,350 (4.9%) | 8,383 (2.5%) |
| 65 to 74 Years | 16,287 (18.2%) | 5,356 (5.8%) |
| 75 Years and over | 17,955 (35.0%) | 13,431 (21.9%) |
Disability Class: Vision Difficulty
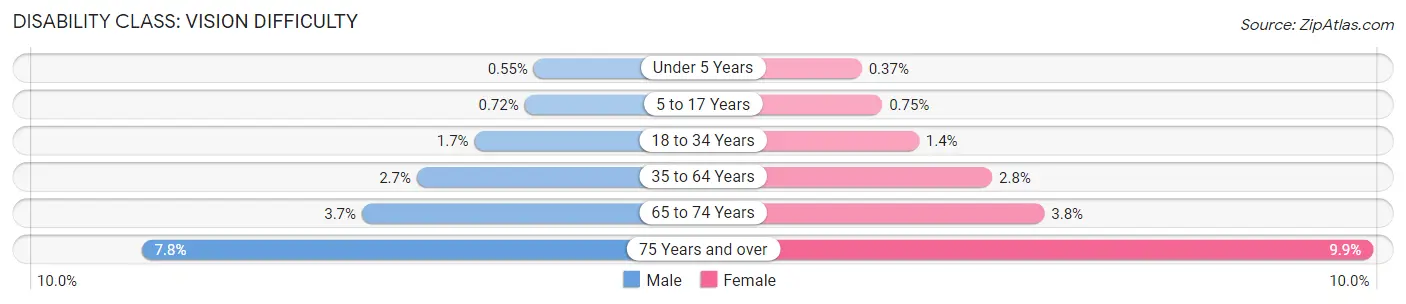
| Age Bracket | Male | Female |
| Under 5 Years | 317 (0.5%) | 201 (0.4%) |
| 5 to 17 Years | 1,256 (0.7%) | 1,241 (0.7%) |
| 18 to 34 Years | 3,458 (1.7%) | 2,967 (1.4%) |
| 35 to 64 Years | 9,066 (2.7%) | 9,146 (2.8%) |
| 65 to 74 Years | 3,335 (3.7%) | 3,496 (3.8%) |
| 75 Years and over | 4,017 (7.8%) | 6,061 (9.9%) |
Disability Class: Cognitive Difficulty
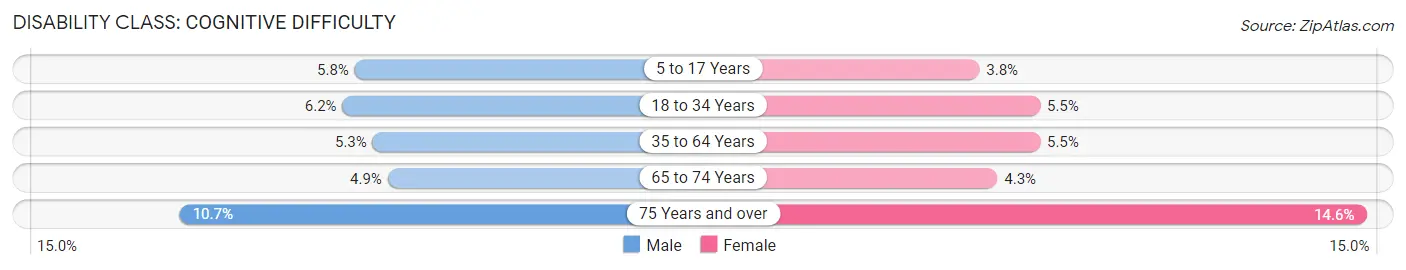
| Age Bracket | Male | Female |
| 5 to 17 Years | 10,200 (5.8%) | 6,354 (3.8%) |
| 18 to 34 Years | 12,890 (6.1%) | 11,486 (5.5%) |
| 35 to 64 Years | 17,666 (5.3%) | 18,130 (5.5%) |
| 65 to 74 Years | 4,364 (4.9%) | 4,021 (4.3%) |
| 75 Years and over | 5,477 (10.7%) | 8,973 (14.6%) |
Disability Class: Ambulatory Difficulty
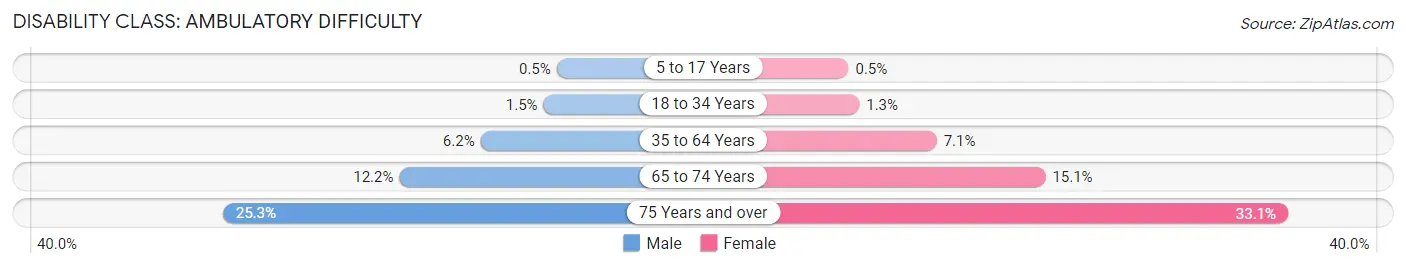
| Age Bracket | Male | Female |
| 5 to 17 Years | 878 (0.5%) | 829 (0.5%) |
| 18 to 34 Years | 3,110 (1.5%) | 2,713 (1.3%) |
| 35 to 64 Years | 20,482 (6.1%) | 23,153 (7.0%) |
| 65 to 74 Years | 10,877 (12.2%) | 14,045 (15.1%) |
| 75 Years and over | 12,965 (25.3%) | 20,354 (33.1%) |
Disability Class: Self-Care Difficulty
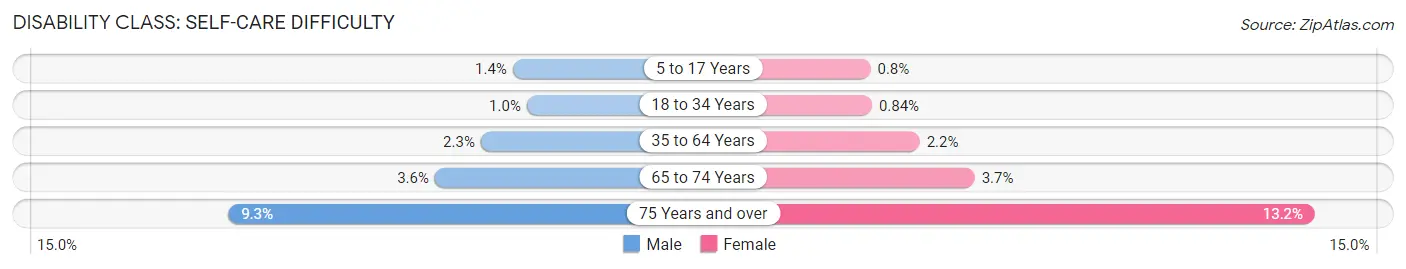
| Age Bracket | Male | Female |
| 5 to 17 Years | 2,478 (1.4%) | 1,330 (0.8%) |
| 18 to 34 Years | 2,129 (1.0%) | 1,754 (0.8%) |
| 35 to 64 Years | 7,657 (2.3%) | 7,137 (2.2%) |
| 65 to 74 Years | 3,194 (3.6%) | 3,435 (3.7%) |
| 75 Years and over | 4,787 (9.3%) | 8,096 (13.2%) |
Technology Access in Idaho
Computing Device Access in Idaho
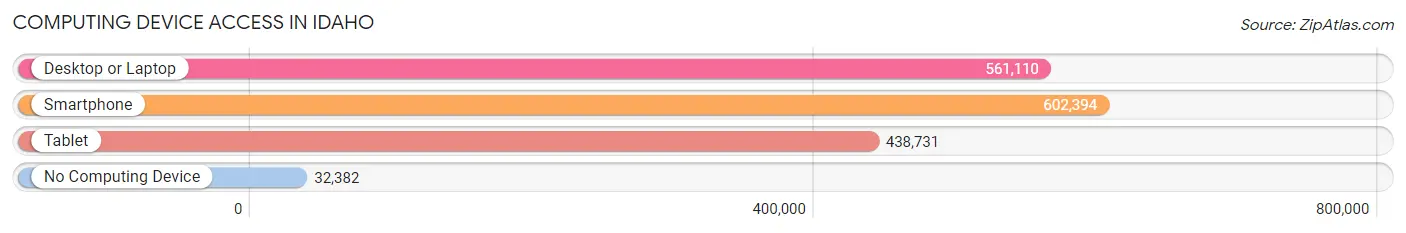
| Device Type | # Households | % Households |
| Desktop or Laptop | 561,110 | 83.1% |
| Smartphone | 602,394 | 89.2% |
| Tablet | 438,731 | 65.0% |
| No Computing Device | 32,382 | 4.8% |
| Total | 675,323 | 100.0% |
Internet Access in Idaho
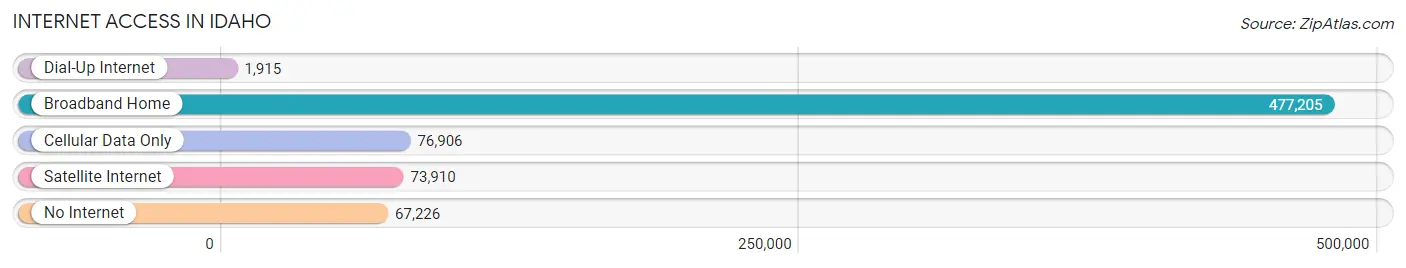
| Internet Type | # Households | % Households |
| Dial-Up Internet | 1,915 | 0.3% |
| Broadband Home | 477,205 | 70.7% |
| Cellular Data Only | 76,906 | 11.4% |
| Satellite Internet | 73,910 | 10.9% |
| No Internet | 67,226 | 10.0% |
| Total | 675,323 | 100.0% |
Idaho Summary
Idaho is a state located in the northwestern region of the United States. It is bordered by Montana to the east, Wyoming to the east, Nevada and Utah to the south, and Washington and Oregon to the west. Idaho is the 14th largest state in the United States, with an area of 83,574 square miles, and the 11th most populous, with a population of 1,787,065 as of 2020. Idaho is known for its rugged terrain, diverse wildlife, and abundant natural resources.
Geography
Idaho is located in the Rocky Mountains region of the United States. It is bordered by Montana to the east, Wyoming to the east, Nevada and Utah to the south, and Washington and Oregon to the west. Idaho is the 14th largest state in the United States, with an area of 83,574 square miles. The state is divided into two distinct regions: the northern Rocky Mountains and the southern Great Basin. The Rocky Mountains region is characterized by rugged terrain, deep canyons, and high mountain peaks. The highest point in the state is Borah Peak, which rises to an elevation of 12,662 feet. The Great Basin region is characterized by rolling hills, sagebrush, and wide open spaces.
The Snake River is the longest river in the state, flowing through the southern part of the state. Other major rivers include the Clearwater, Salmon, and Payette. The state is home to numerous lakes, including Lake Coeur d'Alene, Priest Lake, and Pend Oreille.
Climate
Idaho has a continental climate, with cold winters and hot summers. The average temperature in January is 28°F, and the average temperature in July is 75°F. The state receives an average of 16 inches of precipitation per year, with most of it falling in the winter months.
Economy
Idaho's economy is largely based on agriculture, forestry, and mining. The state is the nation's leading producer of potatoes, and is also a major producer of wheat, barley, and sugar beets. Other important agricultural products include hay, beans, and onions.
The state is also a major producer of timber, and is home to several large lumber mills. Mining is also an important part of the state's economy, with gold, silver, and phosphate being the most important minerals.
Demographics
As of 2020, the population of Idaho was estimated to be 1,787,065. The state is predominantly white, with 87.3% of the population identifying as white. The largest minority group is Hispanic or Latino, which makes up 8.7% of the population. Other minority groups include Native American (2.2%), Asian (1.2%), and African American (0.7%).
The median household income in Idaho is $50,943, and the median home value is $219,400. The state has a poverty rate of 14.2%, which is slightly higher than the national average.
Education
Idaho has a public school system that is overseen by the Idaho State Board of Education. The state is home to eight public universities, including the University of Idaho, Boise State University, and Idaho State University. There are also numerous private colleges and universities, including Northwest Nazarene University and Brigham Young University-Idaho.
Conclusion
Idaho is a state located in the northwestern region of the United States. It is bordered by Montana to the east, Wyoming to the east, Nevada and Utah to the south, and Washington and Oregon to the west. Idaho is the 14th largest state in the United States, with an area of 83,574 square miles, and the 11th most populous, with a population of 1,787,065 as of 2020. Idaho is known for its rugged terrain, diverse wildlife, and abundant natural resources. The state's economy is largely based on agriculture, forestry, and mining, and its population is predominantly white. Idaho has a public school system that is overseen by the Idaho State Board of Education, and is home to eight public universities and numerous private colleges and universities.
Common Questions
When was Idaho Incorporated?
Idaho was Incorporated into the Union on Jul 3, 1890.
What is the Total Area of Idaho?
Total Area of Idaho is 83,568 Square Miles.
What is the Total Land Area of Idaho?
Total Land Area of Idaho is 82,643 Square Miles.
What is the Total Water Area of Idaho?
Total Water Area of Idaho is 926 Square Miles.
What is the Average Elevation in Idaho?
Average Elevation in Idaho is 5,000 Feet.
What is the Highest Elevation in Idaho?
Highest Elevation in Idaho is 12,662 Feet.
What is the Lowest Elevation in Idaho?
Lowest Elevation in Idaho is 710 Feet.
What is the Population Density in Idaho?
Population Density in Idaho is 22.4 People per Square Mile.
What is Per Capita Income in Idaho?
Per Capita income in Idaho is $34,919.
What is the Median Family Income in Idaho?
Median Family Income in Idaho is $83,640.
What is the Median Household income in Idaho?
Median Household Income in Idaho is $70,214.
What is Income or Wage Gap in Idaho?
Income or Wage Gap in Idaho is 36.3%.
Women in Idaho earn 63.7 cents for every dollar earned by a man.
What is Family Income Deficit in Idaho?
Family Income Deficit in Idaho is $10,506.
Families that are below poverty line in Idaho earn $10,506 less on average than the poverty threshold level.
What is Inequality or Gini Index in Idaho?
Inequality or Gini Index in Idaho is 0.44.
What is the Total Population of Idaho?
Total Population of Idaho is 1,854,109.
What is the Total Male Population of Idaho?
Total Male Population of Idaho is 933,728.
What is the Total Female Population of Idaho?
Total Female Population of Idaho is 920,381.
What is the Ratio of Males per 100 Females in Idaho?
There are 101.45 Males per 100 Females in Idaho.
What is the Ratio of Females per 100 Males in Idaho?
There are 98.57 Females per 100 Males in Idaho.
What is the Median Population Age in Idaho?
Median Population Age in Idaho is 36.9 Years.
What is the Average Family Size in Idaho
Average Family Size in Idaho is 3.2 People.
What is the Average Household Size in Idaho
Average Household Size in Idaho is 2.7 People.
How Large is the Labor Force in Idaho?
There are 912,969 People in the Labor Forcein in Idaho.
What is the Percentage of People in the Labor Force in Idaho?
62.9% of People are in the Labor Force in Idaho.
What is the Unemployment Rate in Idaho?
Unemployment Rate in Idaho is 3.8%.