Cities with the Highest Percentage of Population Employed in Installation, Maintenance & Repair in Washington
RELATED REPORTS & OPTIONS
Installation, Maintenance & Repair
Washington
Compare Cities
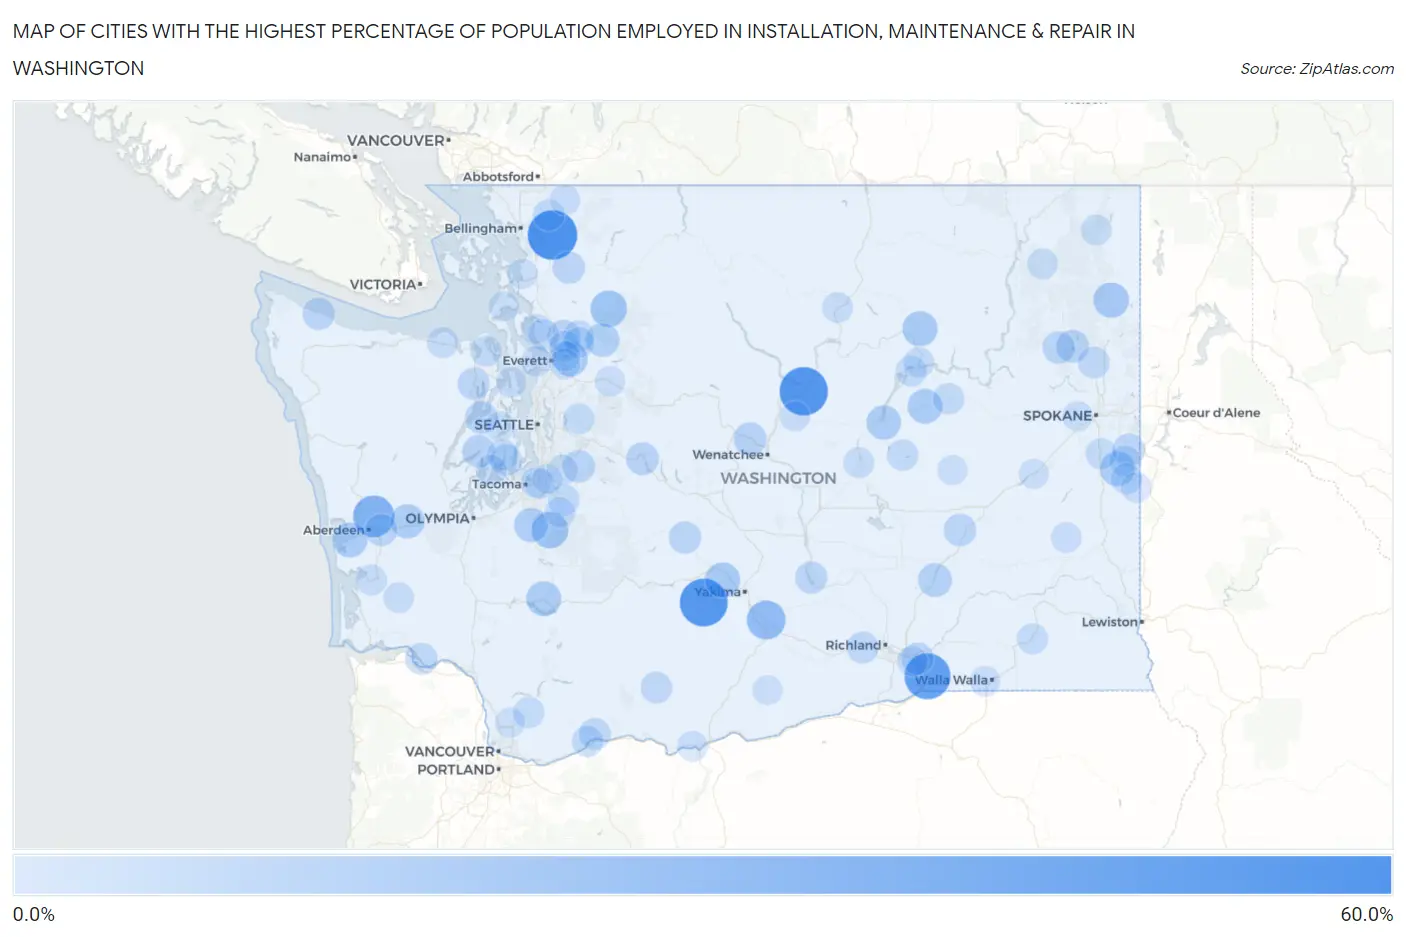
Map of Cities with the Highest Percentage of Population Employed in Installation, Maintenance & Repair in Washington
0.0%
60.0%
Cities with the Highest Percentage of Population Employed in Installation, Maintenance & Repair in Washington
| City | % Employed | vs State | vs National | |
| 1. | Acme | 52.2% | 2.9%(+49.3)#1 | 3.1%(+49.1)#64 |
| 2. | Chelan Falls | 49.2% | 2.9%(+46.3)#2 | 3.1%(+46.1)#84 |
| 3. | Tampico | 48.1% | 2.9%(+45.2)#3 | 3.1%(+45.0)#88 |
| 4. | Wallula | 43.5% | 2.9%(+40.5)#4 | 3.1%(+40.4)#116 |
| 5. | Aberdeen Gardens | 32.4% | 2.9%(+29.4)#5 | 3.1%(+29.3)#248 |
| 6. | Buena | 25.8% | 2.9%(+22.9)#6 | 3.1%(+22.8)#383 |
| 7. | Kapowsin | 21.3% | 2.9%(+18.3)#7 | 3.1%(+18.2)#588 |
| 8. | Swede Heaven | 20.7% | 2.9%(+17.7)#8 | 3.1%(+17.6)#626 |
| 9. | Cusick | 18.2% | 2.9%(+15.3)#9 | 3.1%(+15.1)#796 |
| 10. | Cowiche | 17.8% | 2.9%(+14.9)#10 | 3.1%(+14.8)#835 |
| 11. | Machias | 17.5% | 2.9%(+14.6)#11 | 3.1%(+14.5)#860 |
| 12. | Nespelem | 17.4% | 2.9%(+14.5)#12 | 3.1%(+14.3)#866 |
| 13. | Morton | 17.1% | 2.9%(+14.1)#13 | 3.1%(+14.0)#892 |
| 14. | Markham | 17.1% | 2.9%(+14.1)#14 | 3.1%(+14.0)#894 |
| 15. | Waverly | 16.9% | 2.9%(+13.9)#15 | 3.1%(+13.8)#916 |
| 16. | Almira | 16.7% | 2.9%(+13.7)#16 | 3.1%(+13.6)#934 |
| 17. | Coulee City | 16.0% | 2.9%(+13.1)#17 | 3.1%(+13.0)#1,017 |
| 18. | Satsop | 16.0% | 2.9%(+13.1)#18 | 3.1%(+12.9)#1,026 |
| 19. | South Creek | 15.3% | 2.9%(+12.4)#19 | 3.1%(+12.2)#1,102 |
| 20. | Connell | 14.7% | 2.9%(+11.7)#20 | 3.1%(+11.6)#1,206 |
| 21. | Verlot | 14.3% | 2.9%(+11.4)#21 | 3.1%(+11.2)#1,264 |
| 22. | Cashmere | 12.9% | 2.9%(+9.97)#22 | 3.1%(+9.83)#1,602 |
| 23. | Snoqualmie Pass | 12.7% | 2.9%(+9.74)#23 | 3.1%(+9.60)#1,653 |
| 24. | Belfair | 12.6% | 2.9%(+9.70)#24 | 3.1%(+9.56)#1,659 |
| 25. | Loon Lake | 12.2% | 2.9%(+9.23)#25 | 3.1%(+9.09)#1,786 |
| 26. | Sisco Heights | 12.1% | 2.9%(+9.17)#26 | 3.1%(+9.03)#1,796 |
| 27. | Seabeck | 11.9% | 2.9%(+9.01)#27 | 3.1%(+8.87)#1,849 |
| 28. | Ravensdale | 11.9% | 2.9%(+8.93)#28 | 3.1%(+8.79)#1,871 |
| 29. | Rockford | 11.9% | 2.9%(+8.93)#29 | 3.1%(+8.79)#1,874 |
| 30. | Lind | 11.6% | 2.9%(+8.64)#30 | 3.1%(+8.50)#1,953 |
| 31. | Cliffdell | 11.4% | 2.9%(+8.50)#31 | 3.1%(+8.36)#2,015 |
| 32. | Lyman | 11.3% | 2.9%(+8.39)#32 | 3.1%(+8.25)#2,044 |
| 33. | Springdale | 11.3% | 2.9%(+8.36)#33 | 3.1%(+8.22)#2,053 |
| 34. | Central Park | 11.1% | 2.9%(+8.18)#34 | 3.1%(+8.04)#2,125 |
| 35. | Desert Aire | 11.0% | 2.9%(+8.10)#35 | 3.1%(+7.97)#2,134 |
| 36. | Clallam Bay | 11.0% | 2.9%(+8.03)#36 | 3.1%(+7.89)#2,154 |
| 37. | Burbank | 10.9% | 2.9%(+8.01)#37 | 3.1%(+7.87)#2,159 |
| 38. | Quilcene | 10.4% | 2.9%(+7.48)#38 | 3.1%(+7.34)#2,365 |
| 39. | East Cathlamet | 10.3% | 2.9%(+7.42)#39 | 3.1%(+7.28)#2,394 |
| 40. | Benton City | 10.3% | 2.9%(+7.36)#40 | 3.1%(+7.22)#2,428 |
| 41. | Deer Park | 10.0% | 2.9%(+7.08)#41 | 3.1%(+6.94)#2,538 |
| 42. | Purdy | 9.9% | 2.9%(+7.00)#42 | 3.1%(+6.86)#2,594 |
| 43. | Glenwood | 9.7% | 2.9%(+6.81)#43 | 3.1%(+6.67)#2,711 |
| 44. | Carson | 9.7% | 2.9%(+6.74)#44 | 3.1%(+6.60)#2,760 |
| 45. | Canyon Creek | 9.6% | 2.9%(+6.67)#45 | 3.1%(+6.53)#2,793 |
| 46. | Beacon Hill | 9.4% | 2.9%(+6.52)#46 | 3.1%(+6.38)#2,868 |
| 47. | Lake Goodwin | 9.4% | 2.9%(+6.50)#47 | 3.1%(+6.36)#2,880 |
| 48. | Deming | 9.4% | 2.9%(+6.45)#48 | 3.1%(+6.31)#2,909 |
| 49. | Prairie Heights | 9.2% | 2.9%(+6.28)#49 | 3.1%(+6.14)#2,995 |
| 50. | Wilbur | 9.2% | 2.9%(+6.27)#50 | 3.1%(+6.13)#3,004 |
| 51. | Wilson Creek | 8.9% | 2.9%(+6.00)#51 | 3.1%(+5.86)#3,170 |
| 52. | Stevenson | 8.9% | 2.9%(+5.96)#52 | 3.1%(+5.82)#3,189 |
| 53. | Fairfield | 8.8% | 2.9%(+5.86)#53 | 3.1%(+5.72)#3,268 |
| 54. | Ames Lake | 8.7% | 2.9%(+5.80)#54 | 3.1%(+5.67)#3,315 |
| 55. | Latah | 8.5% | 2.9%(+5.58)#55 | 3.1%(+5.44)#3,493 |
| 56. | Burley | 8.4% | 2.9%(+5.47)#56 | 3.1%(+5.33)#3,580 |
| 57. | Yacolt | 8.4% | 2.9%(+5.43)#57 | 3.1%(+5.29)#3,610 |
| 58. | Clear Lake Cdp Skagit County | 8.3% | 2.9%(+5.40)#58 | 3.1%(+5.27)#3,628 |
| 59. | Electric City | 8.3% | 2.9%(+5.37)#59 | 3.1%(+5.23)#3,679 |
| 60. | Spangle | 8.3% | 2.9%(+5.35)#60 | 3.1%(+5.21)#3,700 |
| 61. | Lake Cassidy | 8.3% | 2.9%(+5.34)#61 | 3.1%(+5.20)#3,701 |
| 62. | Port Hadlock Irondale | 8.2% | 2.9%(+5.28)#62 | 3.1%(+5.14)#3,757 |
| 63. | Granite Falls | 8.2% | 2.9%(+5.25)#63 | 3.1%(+5.11)#3,782 |
| 64. | Dayton | 8.1% | 2.9%(+5.22)#64 | 3.1%(+5.08)#3,811 |
| 65. | South Bend | 8.1% | 2.9%(+5.18)#65 | 3.1%(+5.04)#3,851 |
| 66. | Carlsborg | 7.9% | 2.9%(+5.02)#66 | 3.1%(+4.88)#3,979 |
| 67. | Malott | 7.9% | 2.9%(+4.93)#67 | 3.1%(+4.79)#4,054 |
| 68. | Bunk Foss | 7.7% | 2.9%(+4.79)#68 | 3.1%(+4.66)#4,170 |
| 69. | Fife Heights | 7.7% | 2.9%(+4.73)#69 | 3.1%(+4.59)#4,250 |
| 70. | Lakeview | 7.7% | 2.9%(+4.72)#70 | 3.1%(+4.58)#4,257 |
| 71. | Lake Morton Berrydale | 7.6% | 2.9%(+4.71)#71 | 3.1%(+4.57)#4,278 |
| 72. | Ione | 7.6% | 2.9%(+4.70)#72 | 3.1%(+4.56)#4,291 |
| 73. | Colville | 7.5% | 2.9%(+4.59)#73 | 3.1%(+4.45)#4,408 |
| 74. | Coulee Dam | 7.4% | 2.9%(+4.48)#74 | 3.1%(+4.34)#4,515 |
| 75. | Key Center | 7.4% | 2.9%(+4.45)#75 | 3.1%(+4.31)#4,540 |
| 76. | Lebam | 7.4% | 2.9%(+4.42)#76 | 3.1%(+4.29)#4,574 |
| 77. | Crocker | 7.3% | 2.9%(+4.39)#77 | 3.1%(+4.25)#4,618 |
| 78. | Endicott | 7.3% | 2.9%(+4.33)#78 | 3.1%(+4.19)#4,705 |
| 79. | Garrett | 7.1% | 2.9%(+4.14)#79 | 3.1%(+4.00)#4,934 |
| 80. | Finley | 7.1% | 2.9%(+4.13)#80 | 3.1%(+3.99)#4,945 |
| 81. | Wishram | 7.0% | 2.9%(+4.10)#81 | 3.1%(+3.96)#4,970 |
| 82. | Maple Falls | 7.0% | 2.9%(+4.05)#82 | 3.1%(+3.91)#5,031 |
| 83. | Tekoa | 6.9% | 2.9%(+4.00)#83 | 3.1%(+3.86)#5,065 |
| 84. | Port Gamble Tribal Community | 6.9% | 2.9%(+3.99)#84 | 3.1%(+3.85)#5,082 |
| 85. | Clinton | 6.8% | 2.9%(+3.87)#85 | 3.1%(+3.74)#5,259 |
| 86. | Waterville | 6.8% | 2.9%(+3.84)#86 | 3.1%(+3.70)#5,310 |
| 87. | Airway Heights | 6.7% | 2.9%(+3.74)#87 | 3.1%(+3.61)#5,423 |
| 88. | Gold Bar | 6.7% | 2.9%(+3.73)#88 | 3.1%(+3.59)#5,468 |
| 89. | Bay View | 6.6% | 2.9%(+3.63)#89 | 3.1%(+3.49)#5,604 |
| 90. | Lake Stevens | 6.5% | 2.9%(+3.62)#90 | 3.1%(+3.48)#5,632 |
| 91. | Odessa | 6.5% | 2.9%(+3.61)#91 | 3.1%(+3.47)#5,643 |
| 92. | Sprague | 6.5% | 2.9%(+3.59)#92 | 3.1%(+3.45)#5,654 |
| 93. | Warm Beach | 6.5% | 2.9%(+3.56)#93 | 3.1%(+3.42)#5,713 |
| 94. | Milton | 6.3% | 2.9%(+3.35)#94 | 3.1%(+3.21)#6,004 |
| 95. | Bow | 6.3% | 2.9%(+3.34)#95 | 3.1%(+3.20)#6,020 |
| 96. | Rocky Point | 6.3% | 2.9%(+3.34)#96 | 3.1%(+3.20)#6,026 |
| 97. | Oak Harbor | 6.3% | 2.9%(+3.32)#97 | 3.1%(+3.18)#6,041 |
| 98. | Bickleton | 6.2% | 2.9%(+3.32)#98 | 3.1%(+3.18)#6,086 |
| 99. | Cherry Grove | 6.2% | 2.9%(+3.29)#99 | 3.1%(+3.15)#6,112 |
| 100. | Algona | 6.2% | 2.9%(+3.26)#100 | 3.1%(+3.12)#6,155 |
Common Questions
What are the Top 10 Cities with the Highest Percentage of Population Employed in Installation, Maintenance & Repair in Washington?
Top 10 Cities with the Highest Percentage of Population Employed in Installation, Maintenance & Repair in Washington are:
#1
52.2%
#2
49.2%
#3
48.1%
#4
43.5%
#5
32.4%
#6
25.8%
#7
21.3%
#8
20.7%
#9
18.2%
#10
17.8%
What city has the Highest Percentage of Population Employed in Installation, Maintenance & Repair in Washington?
Acme has the Highest Percentage of Population Employed in Installation, Maintenance & Repair in Washington with 52.2%.
What is the Percentage of Population Employed in Installation, Maintenance & Repair in the State of Washington?
Percentage of Population Employed in Installation, Maintenance & Repair in Washington is 2.9%.
What is the Percentage of Population Employed in Installation, Maintenance & Repair in the United States?
Percentage of Population Employed in Installation, Maintenance & Repair in the United States is 3.1%.