Cities with the Largest Tongan Community in California
RELATED REPORTS & OPTIONS
Tongan
California
Compare Cities
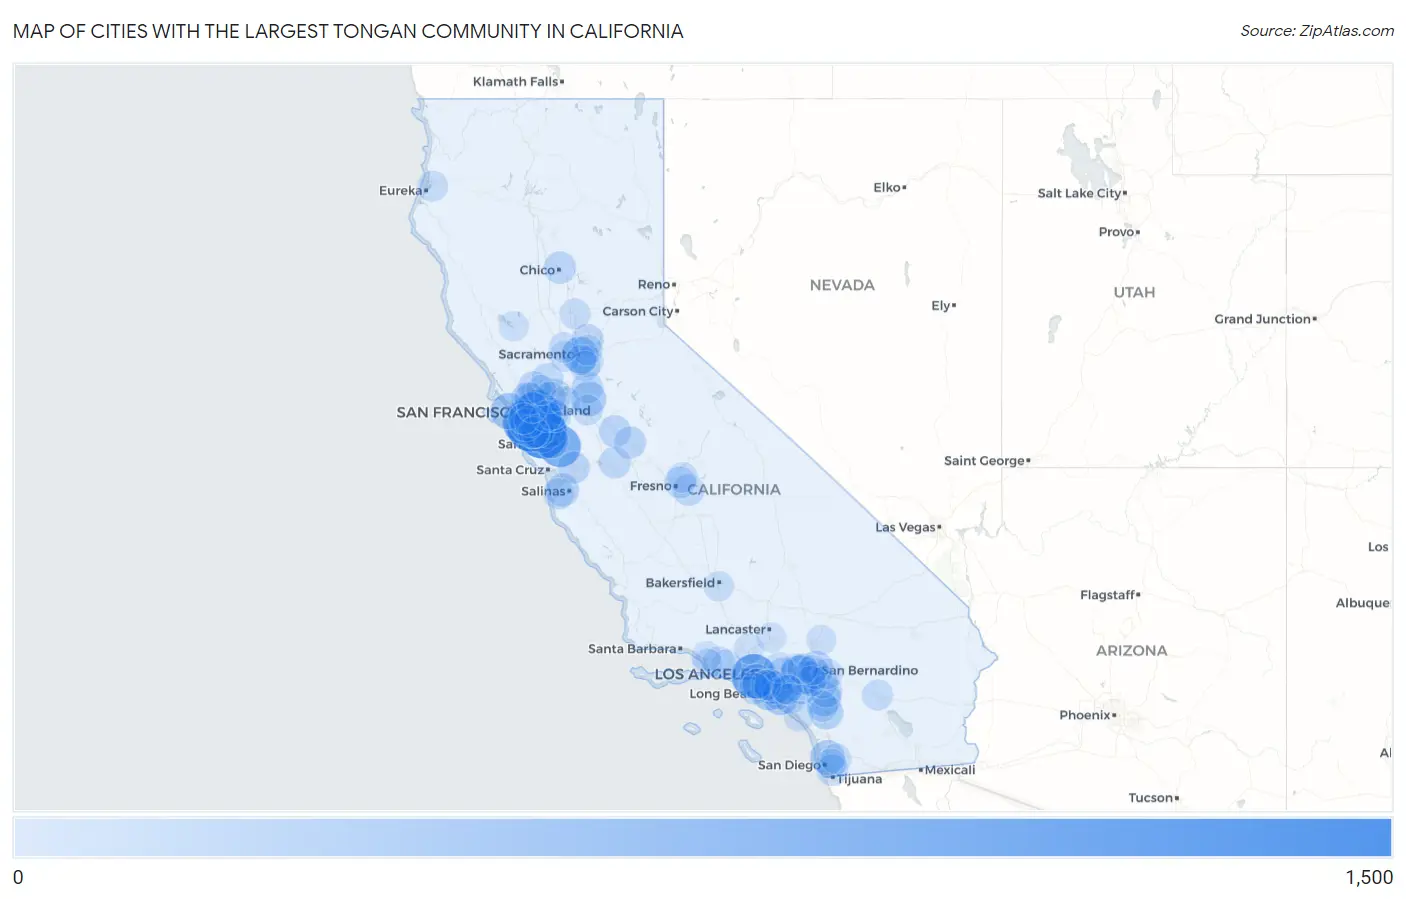
Map of Cities with the Largest Tongan Community in California
0
1,500
Cities with the Largest Tongan Community in California
| City | Tongan | vs State | vs National | |
| 1. | East Palo Alto | 1,265 | 23,798(5.32%)#1 | 69,511(1.82%)#5 |
| 2. | San Mateo | 1,197 | 23,798(5.03%)#2 | 69,511(1.72%)#7 |
| 3. | Oakland | 1,107 | 23,798(4.65%)#3 | 69,511(1.59%)#8 |
| 4. | Los Angeles | 940 | 23,798(3.95%)#4 | 69,511(1.35%)#9 |
| 5. | San Bruno | 924 | 23,798(3.88%)#5 | 69,511(1.33%)#11 |
| 6. | San Jose | 767 | 23,798(3.22%)#6 | 69,511(1.10%)#16 |
| 7. | Ontario | 607 | 23,798(2.55%)#7 | 69,511(0.87%)#19 |
| 8. | Menlo Park | 528 | 23,798(2.22%)#8 | 69,511(0.76%)#22 |
| 9. | San Lorenzo | 502 | 23,798(2.11%)#9 | 69,511(0.72%)#25 |
| 10. | San Leandro | 489 | 23,798(2.05%)#10 | 69,511(0.70%)#26 |
| 11. | Hayward | 476 | 23,798(2.00%)#11 | 69,511(0.68%)#28 |
| 12. | San Francisco | 429 | 23,798(1.80%)#12 | 69,511(0.62%)#34 |
| 13. | Sacramento | 424 | 23,798(1.78%)#13 | 69,511(0.61%)#36 |
| 14. | Fremont | 386 | 23,798(1.62%)#14 | 69,511(0.56%)#37 |
| 15. | Long Beach | 374 | 23,798(1.57%)#15 | 69,511(0.54%)#38 |
| 16. | Fountain Valley | 353 | 23,798(1.48%)#16 | 69,511(0.51%)#40 |
| 17. | Stockton | 333 | 23,798(1.40%)#17 | 69,511(0.48%)#42 |
| 18. | San Diego | 328 | 23,798(1.38%)#18 | 69,511(0.47%)#43 |
| 19. | Menifee | 317 | 23,798(1.33%)#19 | 69,511(0.46%)#45 |
| 20. | Lennox | 304 | 23,798(1.28%)#20 | 69,511(0.44%)#47 |
| 21. | Belmont | 291 | 23,798(1.22%)#21 | 69,511(0.42%)#49 |
| 22. | Santa Clara | 280 | 23,798(1.18%)#22 | 69,511(0.40%)#53 |
| 23. | Temecula | 274 | 23,798(1.15%)#23 | 69,511(0.39%)#54 |
| 24. | Lakewood | 259 | 23,798(1.09%)#24 | 69,511(0.37%)#55 |
| 25. | Jurupa Valley | 247 | 23,798(1.04%)#25 | 69,511(0.36%)#60 |
| 26. | Corona | 242 | 23,798(1.02%)#26 | 69,511(0.35%)#61 |
| 27. | Marina | 228 | 23,798(0.96%)#27 | 69,511(0.33%)#67 |
| 28. | San Bernardino | 227 | 23,798(0.95%)#28 | 69,511(0.33%)#68 |
| 29. | North Richmond | 222 | 23,798(0.93%)#29 | 69,511(0.32%)#73 |
| 30. | Redwood City | 220 | 23,798(0.92%)#30 | 69,511(0.32%)#74 |
| 31. | Buena Park | 194 | 23,798(0.82%)#31 | 69,511(0.28%)#83 |
| 32. | Millbrae | 183 | 23,798(0.77%)#32 | 69,511(0.26%)#85 |
| 33. | Turlock | 178 | 23,798(0.75%)#33 | 69,511(0.26%)#89 |
| 34. | Chico | 175 | 23,798(0.74%)#34 | 69,511(0.25%)#90 |
| 35. | Nuevo | 173 | 23,798(0.73%)#35 | 69,511(0.25%)#94 |
| 36. | Vallejo | 171 | 23,798(0.72%)#36 | 69,511(0.25%)#96 |
| 37. | West Covina | 171 | 23,798(0.72%)#37 | 69,511(0.25%)#97 |
| 38. | Gilroy | 164 | 23,798(0.69%)#38 | 69,511(0.24%)#102 |
| 39. | Atwater | 164 | 23,798(0.69%)#39 | 69,511(0.24%)#103 |
| 40. | Roseville | 163 | 23,798(0.68%)#40 | 69,511(0.23%)#105 |
| 41. | Pittsburg | 163 | 23,798(0.68%)#41 | 69,511(0.23%)#106 |
| 42. | Richmond | 145 | 23,798(0.61%)#42 | 69,511(0.21%)#116 |
| 43. | Dublin | 145 | 23,798(0.61%)#43 | 69,511(0.21%)#117 |
| 44. | Los Banos | 144 | 23,798(0.61%)#44 | 69,511(0.21%)#118 |
| 45. | Camarillo | 143 | 23,798(0.60%)#45 | 69,511(0.21%)#119 |
| 46. | Lodi | 141 | 23,798(0.59%)#46 | 69,511(0.20%)#120 |
| 47. | Chula Vista | 140 | 23,798(0.59%)#47 | 69,511(0.20%)#121 |
| 48. | Garden Grove | 140 | 23,798(0.59%)#48 | 69,511(0.20%)#122 |
| 49. | Sanger | 140 | 23,798(0.59%)#49 | 69,511(0.20%)#123 |
| 50. | San Ramon | 137 | 23,798(0.58%)#50 | 69,511(0.20%)#127 |
| 51. | Bellflower | 137 | 23,798(0.58%)#51 | 69,511(0.20%)#128 |
| 52. | Moreno Valley | 136 | 23,798(0.57%)#52 | 69,511(0.20%)#130 |
| 53. | Tarpey Village | 136 | 23,798(0.57%)#53 | 69,511(0.20%)#132 |
| 54. | Fairfield | 127 | 23,798(0.53%)#54 | 69,511(0.18%)#134 |
| 55. | Vineyard | 126 | 23,798(0.53%)#55 | 69,511(0.18%)#135 |
| 56. | Concord | 125 | 23,798(0.53%)#56 | 69,511(0.18%)#136 |
| 57. | South San Francisco | 122 | 23,798(0.51%)#57 | 69,511(0.18%)#137 |
| 58. | Torrance | 114 | 23,798(0.48%)#58 | 69,511(0.16%)#143 |
| 59. | Castro Valley | 108 | 23,798(0.45%)#59 | 69,511(0.16%)#148 |
| 60. | Seaside | 107 | 23,798(0.45%)#60 | 69,511(0.15%)#151 |
| 61. | Murrieta | 106 | 23,798(0.45%)#61 | 69,511(0.15%)#152 |
| 62. | San Carlos | 102 | 23,798(0.43%)#62 | 69,511(0.15%)#155 |
| 63. | Indio | 101 | 23,798(0.42%)#63 | 69,511(0.15%)#157 |
| 64. | Arcata | 92 | 23,798(0.39%)#64 | 69,511(0.13%)#165 |
| 65. | Davis | 90 | 23,798(0.38%)#65 | 69,511(0.13%)#167 |
| 66. | Linda | 86 | 23,798(0.36%)#66 | 69,511(0.12%)#175 |
| 67. | Elk Grove | 85 | 23,798(0.36%)#67 | 69,511(0.12%)#176 |
| 68. | Upland | 83 | 23,798(0.35%)#68 | 69,511(0.12%)#177 |
| 69. | Lathrop | 81 | 23,798(0.34%)#69 | 69,511(0.12%)#178 |
| 70. | Colton | 79 | 23,798(0.33%)#70 | 69,511(0.11%)#180 |
| 71. | Anaheim | 74 | 23,798(0.31%)#71 | 69,511(0.11%)#186 |
| 72. | Carmichael | 72 | 23,798(0.30%)#72 | 69,511(0.10%)#191 |
| 73. | Clovis | 71 | 23,798(0.30%)#73 | 69,511(0.10%)#193 |
| 74. | El Cajon | 69 | 23,798(0.29%)#74 | 69,511(0.10%)#196 |
| 75. | Brentwood | 69 | 23,798(0.29%)#75 | 69,511(0.10%)#197 |
| 76. | Daly City | 67 | 23,798(0.28%)#76 | 69,511(0.10%)#200 |
| 77. | Emeryville | 67 | 23,798(0.28%)#77 | 69,511(0.10%)#201 |
| 78. | Thousand Oaks | 66 | 23,798(0.28%)#78 | 69,511(0.09%)#202 |
| 79. | Monrovia | 66 | 23,798(0.28%)#79 | 69,511(0.09%)#203 |
| 80. | Irvine | 63 | 23,798(0.26%)#80 | 69,511(0.09%)#214 |
| 81. | Parkway | 61 | 23,798(0.26%)#81 | 69,511(0.09%)#219 |
| 82. | Woodland | 60 | 23,798(0.25%)#82 | 69,511(0.09%)#221 |
| 83. | Mentone | 60 | 23,798(0.25%)#83 | 69,511(0.09%)#222 |
| 84. | Riverside | 58 | 23,798(0.24%)#84 | 69,511(0.08%)#225 |
| 85. | University Of California-Santa Barbara | 58 | 23,798(0.24%)#85 | 69,511(0.08%)#226 |
| 86. | Bakersfield | 57 | 23,798(0.24%)#86 | 69,511(0.08%)#228 |
| 87. | Oxnard | 55 | 23,798(0.23%)#87 | 69,511(0.08%)#232 |
| 88. | Rancho Cucamonga | 53 | 23,798(0.22%)#88 | 69,511(0.08%)#238 |
| 89. | San Clemente | 53 | 23,798(0.22%)#89 | 69,511(0.08%)#239 |
| 90. | Santa Clarita | 50 | 23,798(0.21%)#90 | 69,511(0.07%)#246 |
| 91. | Rialto | 49 | 23,798(0.21%)#91 | 69,511(0.07%)#247 |
| 92. | Orange | 48 | 23,798(0.20%)#92 | 69,511(0.07%)#249 |
| 93. | Benicia | 48 | 23,798(0.20%)#93 | 69,511(0.07%)#252 |
| 94. | San Buenaventura Ventura | 47 | 23,798(0.20%)#94 | 69,511(0.07%)#254 |
| 95. | Hawthorne | 47 | 23,798(0.20%)#95 | 69,511(0.07%)#255 |
| 96. | East Rancho Dominguez | 47 | 23,798(0.20%)#96 | 69,511(0.07%)#256 |
| 97. | Lemon Grove | 45 | 23,798(0.19%)#97 | 69,511(0.06%)#262 |
| 98. | Clearlake | 45 | 23,798(0.19%)#98 | 69,511(0.06%)#264 |
| 99. | Apple Valley | 44 | 23,798(0.18%)#99 | 69,511(0.06%)#268 |
| 100. | Palmdale | 42 | 23,798(0.18%)#100 | 69,511(0.06%)#276 |
Common Questions
What are the Top 10 Cities with the Largest Tongan Community in California?
Top 10 Cities with the Largest Tongan Community in California are:
#1
1,265
#2
1,197
#3
1,107
#4
940
#5
924
#6
767
#7
607
#8
528
#9
502
#10
489
What city has the Largest Tongan Community in California?
East Palo Alto has the Largest Tongan Community in California with 1,265.
What is the Total Tongan Population in the State of California?
Total Tongan Population in California is 23,798.
What is the Total Tongan Population in the United States?
Total Tongan Population in the United States is 69,511.