Cities with the Highest Percentage of Immigrants from Canada in California
RELATED REPORTS & OPTIONS
Canada
California
Compare Cities
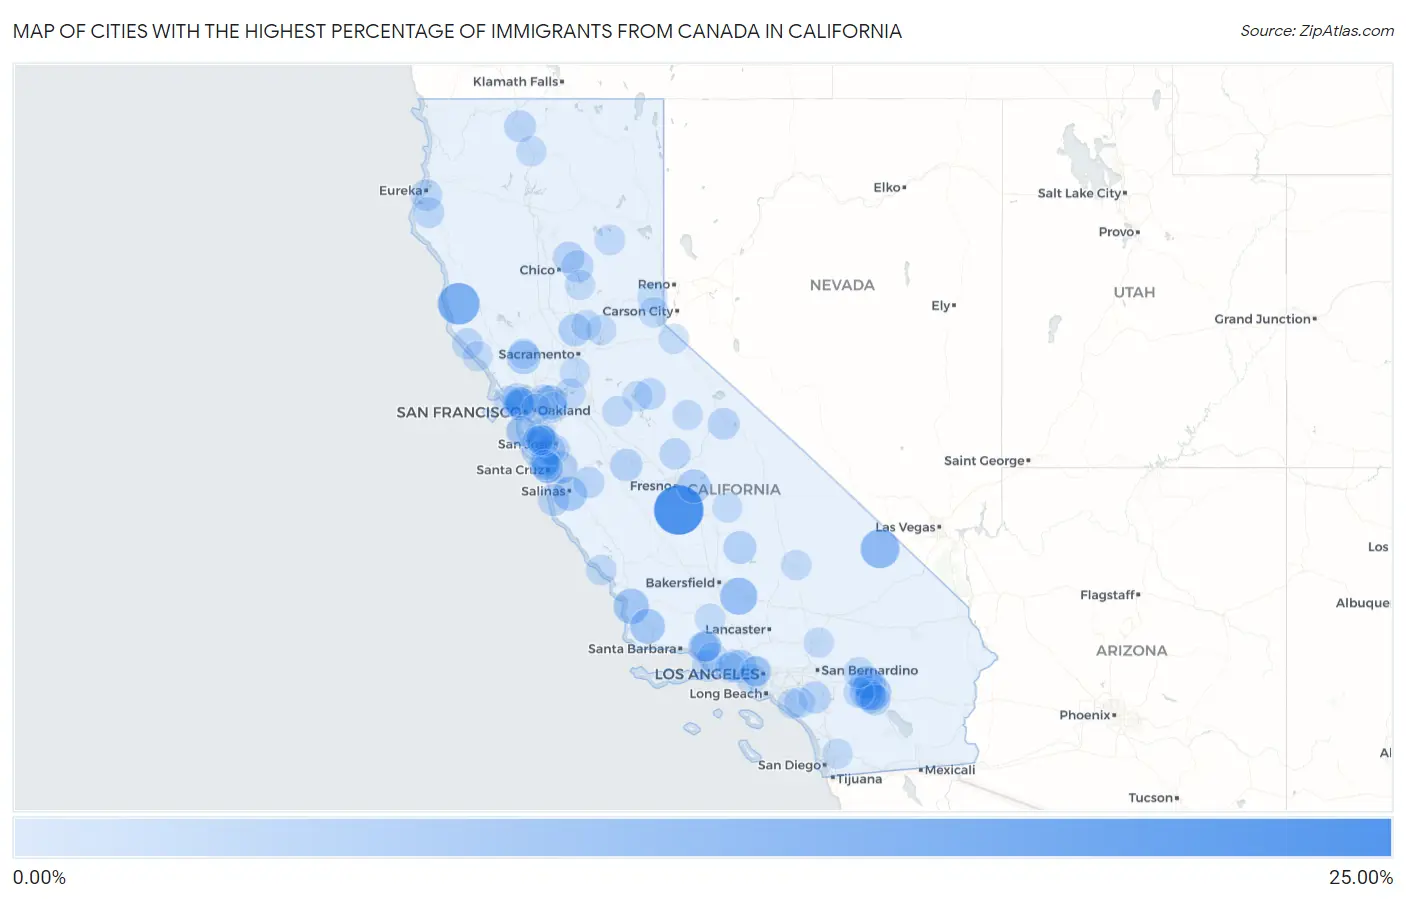
Map of Cities with the Highest Percentage of Immigrants from Canada in California
0.00%
25.00%
Cities with the Highest Percentage of Immigrants from Canada in California
| City | Canada | vs State | vs National | |
| 1. | Hardwick | 20.62% | 0.32%(+20.3)#-1 | 0.25%(+20.4)#0 |
| 2. | Comptche | 12.50% | 0.32%(+12.2)#0 | 0.25%(+12.3)#1 |
| 3. | Tecopa | 9.63% | 0.32%(+9.30)#1 | 0.25%(+9.38)#2 |
| 4. | Bear Valley Springs | 7.88% | 0.32%(+7.55)#2 | 0.25%(+7.63)#3 |
| 5. | Woodlands | 6.24% | 0.32%(+5.91)#3 | 0.25%(+5.99)#4 |
| 6. | Desert Palms | 5.78% | 0.32%(+5.46)#4 | 0.25%(+5.54)#5 |
| 7. | Los Alamos | 5.76% | 0.32%(+5.43)#5 | 0.25%(+5.51)#6 |
| 8. | North Gate | 5.22% | 0.32%(+4.90)#6 | 0.25%(+4.97)#7 |
| 9. | Spreckels | 5.05% | 0.32%(+4.73)#7 | 0.25%(+4.80)#8 |
| 10. | Minkler | 4.54% | 0.32%(+4.21)#8 | 0.25%(+4.29)#9 |
| 11. | St Helena | 4.31% | 0.32%(+3.99)#66 | 0.25%(+4.06)#1,090 |
| 12. | Rancho Mirage | 4.07% | 0.32%(+3.75)#67 | 0.25%(+3.83)#1,091 |
| 13. | Hidden Hills | 3.89% | 0.32%(+3.57)#228 | 0.25%(+3.64)#2,543 |
| 14. | Pine Flat | 3.87% | 0.32%(+3.54)#229 | 0.25%(+3.62)#2,544 |
| 15. | East Nicolaus | 3.68% | 0.32%(+3.36)#230 | 0.25%(+3.43)#2,545 |
| 16. | Desert Edge | 3.66% | 0.32%(+3.34)#231 | 0.25%(+3.41)#2,546 |
| 17. | Belvedere | 3.48% | 0.32%(+3.16)#232 | 0.25%(+3.23)#2,547 |
| 18. | Corralitos | 3.44% | 0.32%(+3.11)#233 | 0.25%(+3.19)#2,548 |
| 19. | Sky Valley | 3.29% | 0.32%(+2.97)#234 | 0.25%(+3.05)#2,549 |
| 20. | Dos Palos Y | 3.24% | 0.32%(+2.92)#235 | 0.25%(+3.00)#2,550 |
| 21. | Woody | 3.12% | 0.32%(+2.80)#236 | 0.25%(+2.88)#2,551 |
| 22. | Carmel By The Sea | 2.90% | 0.32%(+2.58)#237 | 0.25%(+2.65)#2,552 |
| 23. | Warm Springs | 2.88% | 0.32%(+2.55)#238 | 0.25%(+2.63)#2,553 |
| 24. | Concow | 2.87% | 0.32%(+2.54)#239 | 0.25%(+2.62)#2,554 |
| 25. | Yermo | 2.75% | 0.32%(+2.43)#240 | 0.25%(+2.50)#2,555 |
| 26. | Cambrian Park | 2.70% | 0.32%(+2.38)#241 | 0.25%(+2.46)#2,556 |
| 27. | Mammoth Lakes | 2.69% | 0.32%(+2.36)#242 | 0.25%(+2.44)#2,557 |
| 28. | Forest Ranch | 2.67% | 0.32%(+2.35)#243 | 0.25%(+2.42)#2,558 |
| 29. | Pasatiempo | 2.61% | 0.32%(+2.29)#244 | 0.25%(+2.36)#2,559 |
| 30. | Grenada | 2.61% | 0.32%(+2.28)#245 | 0.25%(+2.36)#2,560 |
| 31. | Indian Wells | 2.50% | 0.32%(+2.18)#246 | 0.25%(+2.26)#2,561 |
| 32. | Palm Desert | 2.48% | 0.32%(+2.16)#304 | 0.25%(+2.24)#3,137 |
| 33. | Dixon Lane Meadow Creek | 2.46% | 0.32%(+2.14)#305 | 0.25%(+2.22)#3,138 |
| 34. | Los Altos Hills | 2.45% | 0.32%(+2.13)#306 | 0.25%(+2.20)#3,139 |
| 35. | Pine Hills | 2.45% | 0.32%(+2.13)#307 | 0.25%(+2.20)#3,140 |
| 36. | Twain Harte | 2.41% | 0.32%(+2.09)#308 | 0.25%(+2.17)#3,141 |
| 37. | Channel Islands Beach | 2.40% | 0.32%(+2.08)#309 | 0.25%(+2.15)#3,142 |
| 38. | Tres Pinos | 2.39% | 0.32%(+2.06)#310 | 0.25%(+2.14)#3,143 |
| 39. | Mill Valley | 2.29% | 0.32%(+1.96)#311 | 0.25%(+2.04)#3,144 |
| 40. | Meiners Oaks | 2.25% | 0.32%(+1.92)#312 | 0.25%(+2.00)#3,145 |
| 41. | Ross | 2.21% | 0.32%(+1.88)#313 | 0.25%(+1.96)#3,146 |
| 42. | Silverado | 2.16% | 0.32%(+1.84)#314 | 0.25%(+1.92)#3,147 |
| 43. | Rio Dell | 2.10% | 0.32%(+1.77)#315 | 0.25%(+1.85)#3,148 |
| 44. | Yosemite Lakes | 2.05% | 0.32%(+1.72)#316 | 0.25%(+1.80)#3,149 |
| 45. | Sea Ranch | 2.04% | 0.32%(+1.72)#317 | 0.25%(+1.79)#3,150 |
| 46. | La Quinta | 2.01% | 0.32%(+1.68)#318 | 0.25%(+1.76)#3,151 |
| 47. | Lompico | 1.98% | 0.32%(+1.65)#319 | 0.25%(+1.73)#3,152 |
| 48. | Monte Sereno | 1.95% | 0.32%(+1.62)#320 | 0.25%(+1.70)#3,153 |
| 49. | Mira Monte | 1.90% | 0.32%(+1.58)#321 | 0.25%(+1.65)#3,154 |
| 50. | Reliez Valley | 1.88% | 0.32%(+1.56)#322 | 0.25%(+1.63)#3,155 |
| 51. | Bethel Island | 1.81% | 0.32%(+1.48)#323 | 0.25%(+1.56)#3,156 |
| 52. | Palm Springs | 1.80% | 0.32%(+1.48)#324 | 0.25%(+1.56)#3,157 |
| 53. | Morongo Valley | 1.74% | 0.32%(+1.42)#325 | 0.25%(+1.49)#3,158 |
| 54. | El Granada | 1.73% | 0.32%(+1.41)#326 | 0.25%(+1.49)#3,159 |
| 55. | Rancho Santa Margarita | 1.71% | 0.32%(+1.39)#327 | 0.25%(+1.46)#3,160 |
| 56. | Greenville | 1.70% | 0.32%(+1.38)#328 | 0.25%(+1.45)#3,161 |
| 57. | La Honda | 1.69% | 0.32%(+1.36)#329 | 0.25%(+1.44)#3,162 |
| 58. | Diablo | 1.68% | 0.32%(+1.36)#330 | 0.25%(+1.44)#3,163 |
| 59. | East Oakdale | 1.68% | 0.32%(+1.36)#331 | 0.25%(+1.43)#3,164 |
| 60. | Cambria | 1.67% | 0.32%(+1.34)#332 | 0.25%(+1.42)#3,165 |
| 61. | Tamalpais Homestead Valley | 1.65% | 0.32%(+1.32)#333 | 0.25%(+1.40)#3,166 |
| 62. | Bolinas | 1.64% | 0.32%(+1.32)#334 | 0.25%(+1.39)#3,167 |
| 63. | Saticoy | 1.60% | 0.32%(+1.27)#335 | 0.25%(+1.35)#3,168 |
| 64. | Oak Park | 1.58% | 0.32%(+1.25)#336 | 0.25%(+1.33)#3,169 |
| 65. | Truckee | 1.54% | 0.32%(+1.22)#337 | 0.25%(+1.29)#3,170 |
| 66. | Courtland | 1.53% | 0.32%(+1.21)#338 | 0.25%(+1.28)#3,171 |
| 67. | San Miguel Cdp Contra Costa County | 1.52% | 0.32%(+1.20)#339 | 0.25%(+1.28)#3,172 |
| 68. | Ben Lomond | 1.50% | 0.32%(+1.18)#340 | 0.25%(+1.26)#3,173 |
| 69. | Paradise Park | 1.49% | 0.32%(+1.16)#341 | 0.25%(+1.24)#3,174 |
| 70. | Beverly Hills | 1.48% | 0.32%(+1.16)#342 | 0.25%(+1.23)#3,175 |
| 71. | Tuttletown | 1.48% | 0.32%(+1.16)#343 | 0.25%(+1.23)#3,176 |
| 72. | Pine Mountain Club | 1.46% | 0.32%(+1.13)#344 | 0.25%(+1.21)#3,177 |
| 73. | Yosemite Valley | 1.44% | 0.32%(+1.12)#345 | 0.25%(+1.19)#3,178 |
| 74. | Sunnyside Tahoe City | 1.43% | 0.32%(+1.11)#346 | 0.25%(+1.18)#3,179 |
| 75. | Marina Del Rey | 1.43% | 0.32%(+1.11)#347 | 0.25%(+1.18)#3,180 |
| 76. | Angwin | 1.43% | 0.32%(+1.10)#348 | 0.25%(+1.18)#3,181 |
| 77. | Menlo Park | 1.43% | 0.32%(+1.10)#349 | 0.25%(+1.18)#3,182 |
| 78. | Los Altos | 1.40% | 0.32%(+1.07)#350 | 0.25%(+1.15)#3,183 |
| 79. | Mount Shasta | 1.39% | 0.32%(+1.07)#351 | 0.25%(+1.14)#3,184 |
| 80. | Auburn | 1.39% | 0.32%(+1.06)#352 | 0.25%(+1.14)#3,185 |
| 81. | West Hollywood | 1.38% | 0.32%(+1.06)#353 | 0.25%(+1.13)#3,186 |
| 82. | Ojai | 1.38% | 0.32%(+1.06)#354 | 0.25%(+1.13)#3,187 |
| 83. | Rancho Mission Viejo | 1.37% | 0.32%(+1.05)#355 | 0.25%(+1.13)#3,188 |
| 84. | Stanford | 1.37% | 0.32%(+1.05)#356 | 0.25%(+1.13)#3,189 |
| 85. | Alto | 1.37% | 0.32%(+1.04)#357 | 0.25%(+1.12)#3,190 |
| 86. | Alpine Village | 1.36% | 0.32%(+1.04)#358 | 0.25%(+1.12)#3,191 |
| 87. | Westlake Village | 1.36% | 0.32%(+1.03)#359 | 0.25%(+1.11)#3,192 |
| 88. | Ridgecrest | 1.34% | 0.32%(+1.02)#360 | 0.25%(+1.09)#3,193 |
| 89. | Moss Beach | 1.33% | 0.32%(+1.00)#361 | 0.25%(+1.08)#3,194 |
| 90. | Kelly Ridge | 1.33% | 0.32%(+1.00)#362 | 0.25%(+1.08)#3,195 |
| 91. | Spring Valley Lake | 1.32% | 0.32%(+1.000)#363 | 0.25%(+1.08)#3,196 |
| 92. | Sheridan | 1.29% | 0.32%(+0.965)#364 | 0.25%(+1.04)#3,197 |
| 93. | Three Rivers | 1.28% | 0.32%(+0.958)#365 | 0.25%(+1.03)#3,198 |
| 94. | Timber Cove | 1.28% | 0.32%(+0.953)#366 | 0.25%(+1.03)#3,199 |
| 95. | Portola Valley | 1.27% | 0.32%(+0.950)#367 | 0.25%(+1.03)#3,200 |
| 96. | Laguna Woods | 1.27% | 0.32%(+0.948)#368 | 0.25%(+1.02)#3,201 |
| 97. | Felton | 1.27% | 0.32%(+0.946)#369 | 0.25%(+1.02)#3,202 |
| 98. | Eucalyptus Hills | 1.23% | 0.32%(+0.909)#370 | 0.25%(+0.984)#3,203 |
| 99. | Palo Alto | 1.22% | 0.32%(+0.898)#371 | 0.25%(+0.974)#3,204 |
| 100. | Piedmont | 1.22% | 0.32%(+0.895)#372 | 0.25%(+0.970)#3,205 |
Common Questions
What are the Top 10 Cities with the Highest Percentage of Immigrants from Canada in California?
Top 10 Cities with the Highest Percentage of Immigrants from Canada in California are:
#1
20.62%
#2
12.50%
#3
9.63%
#4
7.88%
#5
6.24%
#6
5.78%
#7
5.76%
#8
5.22%
#9
5.05%
#10
4.54%
What city has the Highest Percentage of Immigrants from Canada in California?
Hardwick has the Highest Percentage of Immigrants from Canada in California with 20.62%.
What is the Percentage of Immigrants from Canada in the State of California?
Percentage of Immigrants from Canada in California is 0.32%.
What is the Percentage of Immigrants from Canada in the United States?
Percentage of Immigrants from Canada in the United States is 0.25%.