Cities with the Highest Percentage of British West Indian Population in California
RELATED REPORTS & OPTIONS
British West Indian
California
Compare Cities
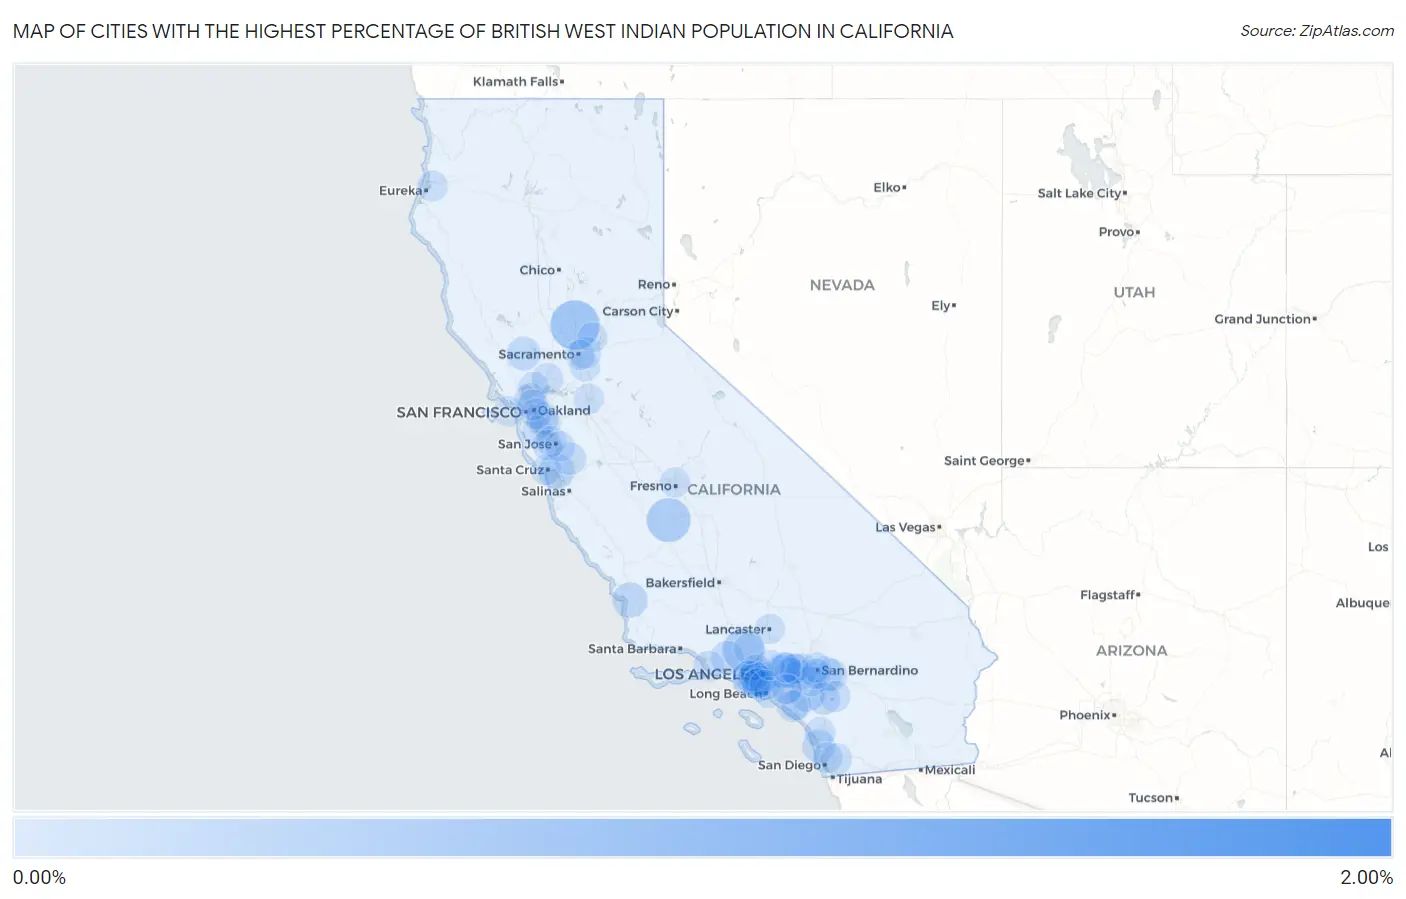
Map of Cities with the Highest Percentage of British West Indian Population in California
0.00%
2.00%
Cities with the Highest Percentage of British West Indian Population in California
| City | British West Indian | vs State | vs National | |
| 1. | Whitmore | 1.84% | 0.0063%(+1.83)#1 | 0.037%(+1.80)#17 |
| 2. | Plumas Lake | 0.57% | 0.0063%(+0.560)#2 | 0.037%(+0.530)#123 |
| 3. | Lemoore Station | 0.41% | 0.0063%(+0.400)#3 | 0.037%(+0.370)#172 |
| 4. | Stevenson Ranch | 0.36% | 0.0063%(+0.355)#4 | 0.037%(+0.325)#189 |
| 5. | Marina Del Rey | 0.23% | 0.0063%(+0.227)#5 | 0.037%(+0.197)#269 |
| 6. | Ladera Heights | 0.22% | 0.0063%(+0.217)#6 | 0.037%(+0.187)#279 |
| 7. | Rio Del Mar | 0.17% | 0.0063%(+0.160)#7 | 0.037%(+0.130)#343 |
| 8. | Arroyo Grande | 0.15% | 0.0063%(+0.146)#8 | 0.037%(+0.115)#362 |
| 9. | Temescal Valley | 0.15% | 0.0063%(+0.143)#9 | 0.037%(+0.112)#365 |
| 10. | Citrus | 0.15% | 0.0063%(+0.139)#10 | 0.037%(+0.109)#372 |
| 11. | Redlands | 0.14% | 0.0063%(+0.132)#11 | 0.037%(+0.101)#383 |
| 12. | Inglewood | 0.12% | 0.0063%(+0.116)#12 | 0.037%(+0.086)#408 |
| 13. | Angwin | 0.11% | 0.0063%(+0.104)#13 | 0.037%(+0.073)#436 |
| 14. | Moorpark | 0.100% | 0.0063%(+0.094)#14 | 0.037%(+0.063)#458 |
| 15. | West Hollywood | 0.093% | 0.0063%(+0.087)#15 | 0.037%(+0.057)#479 |
| 16. | Solana Beach | 0.093% | 0.0063%(+0.086)#16 | 0.037%(+0.056)#481 |
| 17. | Covina | 0.091% | 0.0063%(+0.084)#17 | 0.037%(+0.054)#487 |
| 18. | Morgan Hill | 0.068% | 0.0063%(+0.062)#18 | 0.037%(+0.032)#557 |
| 19. | Yucaipa | 0.068% | 0.0063%(+0.062)#19 | 0.037%(+0.031)#558 |
| 20. | Menifee | 0.061% | 0.0063%(+0.054)#20 | 0.037%(+0.024)#590 |
| 21. | Ashland | 0.052% | 0.0063%(+0.046)#21 | 0.037%(+0.015)#626 |
| 22. | Arden Arcade | 0.048% | 0.0063%(+0.042)#22 | 0.037%(+0.011)#645 |
| 23. | El Cajon | 0.044% | 0.0063%(+0.038)#23 | 0.037%(+0.008)#657 |
| 24. | Aliso Viejo | 0.042% | 0.0063%(+0.036)#24 | 0.037%(+0.006)#667 |
| 25. | San Pablo | 0.034% | 0.0063%(+0.028)#25 | 0.037%(-0.002)#706 |
| 26. | Fairfield | 0.034% | 0.0063%(+0.028)#26 | 0.037%(-0.002)#708 |
| 27. | Westmont | 0.031% | 0.0063%(+0.025)#27 | 0.037%(-0.005)#731 |
| 28. | Port Hueneme | 0.027% | 0.0063%(+0.021)#28 | 0.037%(-0.009)#754 |
| 29. | Vallejo | 0.027% | 0.0063%(+0.021)#29 | 0.037%(-0.009)#755 |
| 30. | Hemet | 0.026% | 0.0063%(+0.019)#30 | 0.037%(-0.011)#766 |
| 31. | Santa Monica | 0.025% | 0.0063%(+0.019)#31 | 0.037%(-0.012)#769 |
| 32. | Redwood City | 0.022% | 0.0063%(+0.015)#32 | 0.037%(-0.015)#787 |
| 33. | Oakland | 0.019% | 0.0063%(+0.013)#33 | 0.037%(-0.018)#802 |
| 34. | Berkeley | 0.017% | 0.0063%(+0.011)#34 | 0.037%(-0.019)#815 |
| 35. | Rancho Cucamonga | 0.017% | 0.0063%(+0.010)#35 | 0.037%(-0.020)#818 |
| 36. | Ontario | 0.016% | 0.0063%(+0.010)#36 | 0.037%(-0.020)#819 |
| 37. | Vista | 0.016% | 0.0063%(+0.010)#37 | 0.037%(-0.020)#821 |
| 38. | Arcata | 0.016% | 0.0063%(+0.010)#38 | 0.037%(-0.020)#822 |
| 39. | Long Beach | 0.016% | 0.0063%(+0.010)#39 | 0.037%(-0.021)#824 |
| 40. | San Diego | 0.015% | 0.0063%(+0.009)#40 | 0.037%(-0.021)#831 |
| 41. | Los Angeles | 0.013% | 0.0063%(+0.007)#41 | 0.037%(-0.023)#845 |
| 42. | Upland | 0.013% | 0.0063%(+0.006)#42 | 0.037%(-0.024)#850 |
| 43. | Hawthorne | 0.011% | 0.0063%(+0.005)#43 | 0.037%(-0.025)#856 |
| 44. | Santa Cruz | 0.011% | 0.0063%(+0.005)#44 | 0.037%(-0.025)#858 |
| 45. | Hayward | 0.011% | 0.0063%(+0.004)#45 | 0.037%(-0.026)#862 |
| 46. | San Francisco | 0.010% | 0.0063%(+0.004)#46 | 0.037%(-0.026)#864 |
| 47. | Stockton | 0.0097% | 0.0063%(+0.003)#47 | 0.037%(-0.027)#872 |
| 48. | Pomona | 0.0093% | 0.0063%(+0.003)#48 | 0.037%(-0.027)#878 |
| 49. | Mission Viejo | 0.0086% | 0.0063%(+0.002)#49 | 0.037%(-0.028)#883 |
| 50. | Compton | 0.0084% | 0.0063%(+0.002)#50 | 0.037%(-0.028)#885 |
| 51. | Orange | 0.0079% | 0.0063%(+0.002)#51 | 0.037%(-0.029)#889 |
| 52. | Santa Clara | 0.0078% | 0.0063%(+0.002)#52 | 0.037%(-0.029)#890 |
| 53. | Riverside | 0.0073% | 0.0063%(+0.001)#53 | 0.037%(-0.029)#895 |
| 54. | Rocklin | 0.0070% | 0.0063%(+0.001)#54 | 0.037%(-0.030)#899 |
| 55. | Pasadena | 0.0065% | 0.0063%(+0.000)#55 | 0.037%(-0.030)#904 |
| 56. | San Bernardino | 0.0063% | 0.0063%(+0.000)#56 | 0.037%(-0.030)#906 |
| 57. | Elk Grove | 0.0057% | 0.0063%(-0.001)#57 | 0.037%(-0.031)#912 |
| 58. | Claremont | 0.0054% | 0.0063%(-0.001)#58 | 0.037%(-0.031)#913 |
| 59. | Cupertino | 0.0050% | 0.0063%(-0.001)#59 | 0.037%(-0.032)#916 |
| 60. | Anaheim | 0.0040% | 0.0063%(-0.002)#60 | 0.037%(-0.033)#923 |
| 61. | Glendora | 0.0038% | 0.0063%(-0.002)#61 | 0.037%(-0.033)#924 |
| 62. | Colton | 0.0037% | 0.0063%(-0.003)#62 | 0.037%(-0.033)#925 |
| 63. | San Jose | 0.0036% | 0.0063%(-0.003)#63 | 0.037%(-0.033)#926 |
| 64. | Lancaster | 0.0017% | 0.0063%(-0.005)#64 | 0.037%(-0.035)#939 |
| 65. | Santa Clarita | 0.0013% | 0.0063%(-0.005)#65 | 0.037%(-0.035)#941 |
| 66. | Fresno | 0.0011% | 0.0063%(-0.005)#66 | 0.037%(-0.035)#942 |
| 67. | Sacramento | 0.00095% | 0.0063%(-0.005)#67 | 0.037%(-0.036)#945 |
Common Questions
What are the Top 10 Cities with the Highest Percentage of British West Indian Population in California?
Top 10 Cities with the Highest Percentage of British West Indian Population in California are:
#1
0.57%
#2
0.41%
#3
0.36%
#4
0.23%
#5
0.22%
#6
0.17%
#7
0.15%
#8
0.15%
#9
0.15%
#10
0.14%
What city has the Highest Percentage of British West Indian Population in California?
Plumas Lake has the Highest Percentage of British West Indian Population in California with 0.57%.
What is the Percentage of British West Indian Population in the State of California?
Percentage of British West Indian Population in California is 0.0063%.
What is the Percentage of British West Indian Population in the United States?
Percentage of British West Indian Population in the United States is 0.037%.