Tarpey Village, CA Map & Demographics
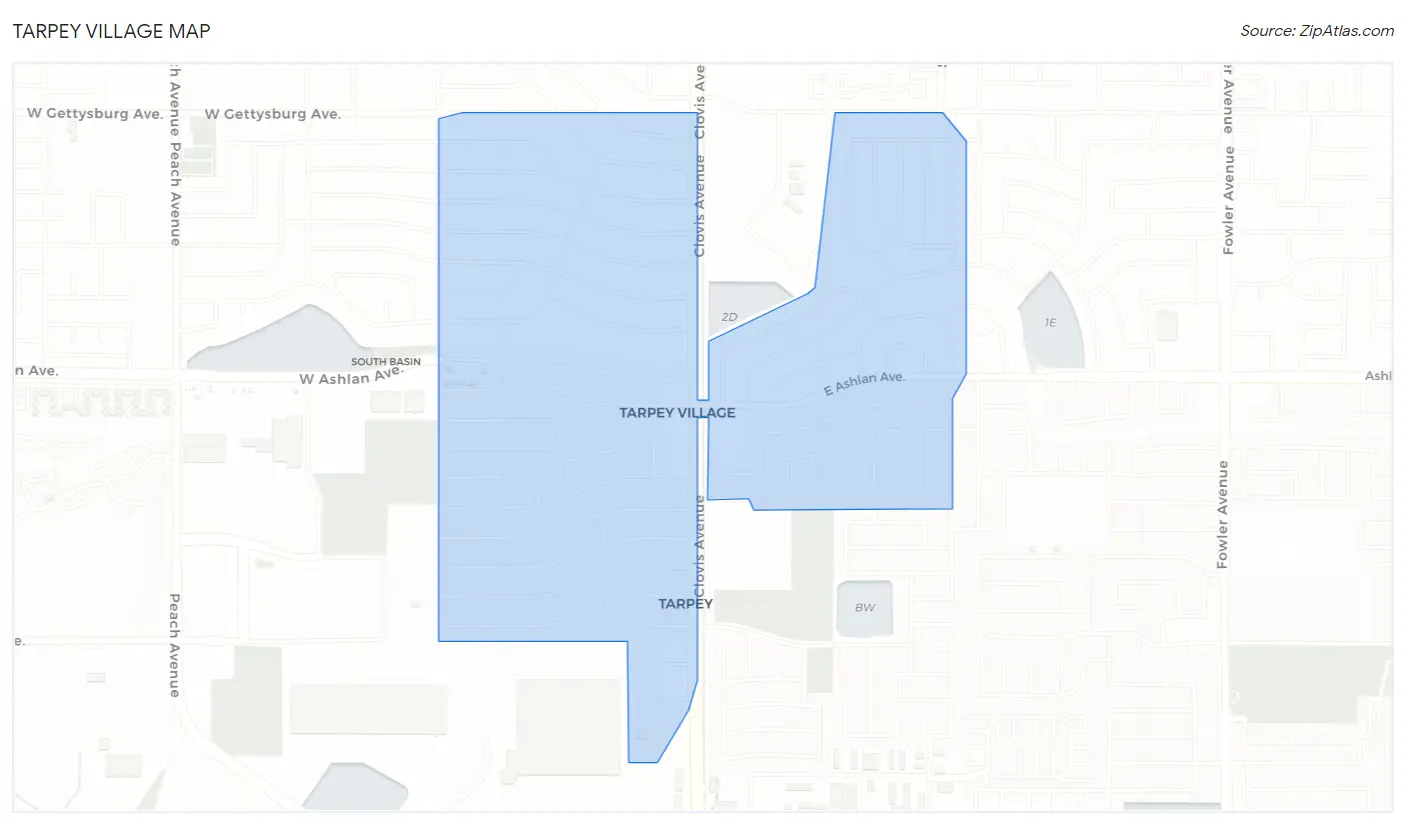
Tarpey Village Map
Tarpey Village Overview
$33,539
PER CAPITA INCOME
$98,394
AVG FAMILY INCOME
$70,982
AVG HOUSEHOLD INCOME
32.7%
WAGE / INCOME GAP [ % ]
67.3¢/ $1
WAGE / INCOME GAP [ $ ]
0.52
INEQUALITY / GINI INDEX
3,746
TOTAL POPULATION
1,947
MALE POPULATION
1,799
FEMALE POPULATION
108.23
MALES / 100 FEMALES
92.40
FEMALES / 100 MALES
39.1
MEDIAN AGE
3.5
AVG FAMILY SIZE
2.9
AVG HOUSEHOLD SIZE
1,762
LABOR FORCE [ PEOPLE ]
57.4%
PERCENT IN LABOR FORCE
9.5%
UNEMPLOYMENT RATE
Income in Tarpey Village
Income Overview in Tarpey Village
Per Capita Income in Tarpey Village is $33,539, while median incomes of families and households are $98,394 and $70,982 respectively.
| Characteristic | Number | Measure |
| Per Capita Income | 3,746 | $33,539 |
| Median Family Income | 916 | $98,394 |
| Mean Family Income | 916 | $122,430 |
| Median Household Income | 1,295 | $70,982 |
| Mean Household Income | 1,295 | $96,749 |
| Income Deficit | 916 | $0 |
| Wage / Income Gap (%) | 3,746 | 32.75% |
| Wage / Income Gap ($) | 3,746 | 67.25¢ per $1 |
| Gini / Inequality Index | 3,746 | 0.52 |
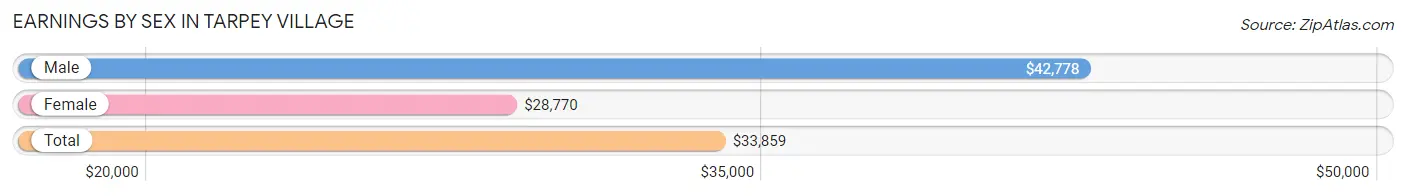
Earnings by Sex in Tarpey Village
Average Earnings in Tarpey Village are $33,859, $42,778 for men and $28,770 for women, a difference of 32.8%.
| Sex | Number | Average Earnings |
| Male | 976 (53.5%) | $42,778 |
| Female | 848 (46.5%) | $28,770 |
| Total | 1,824 (100.0%) | $33,859 |
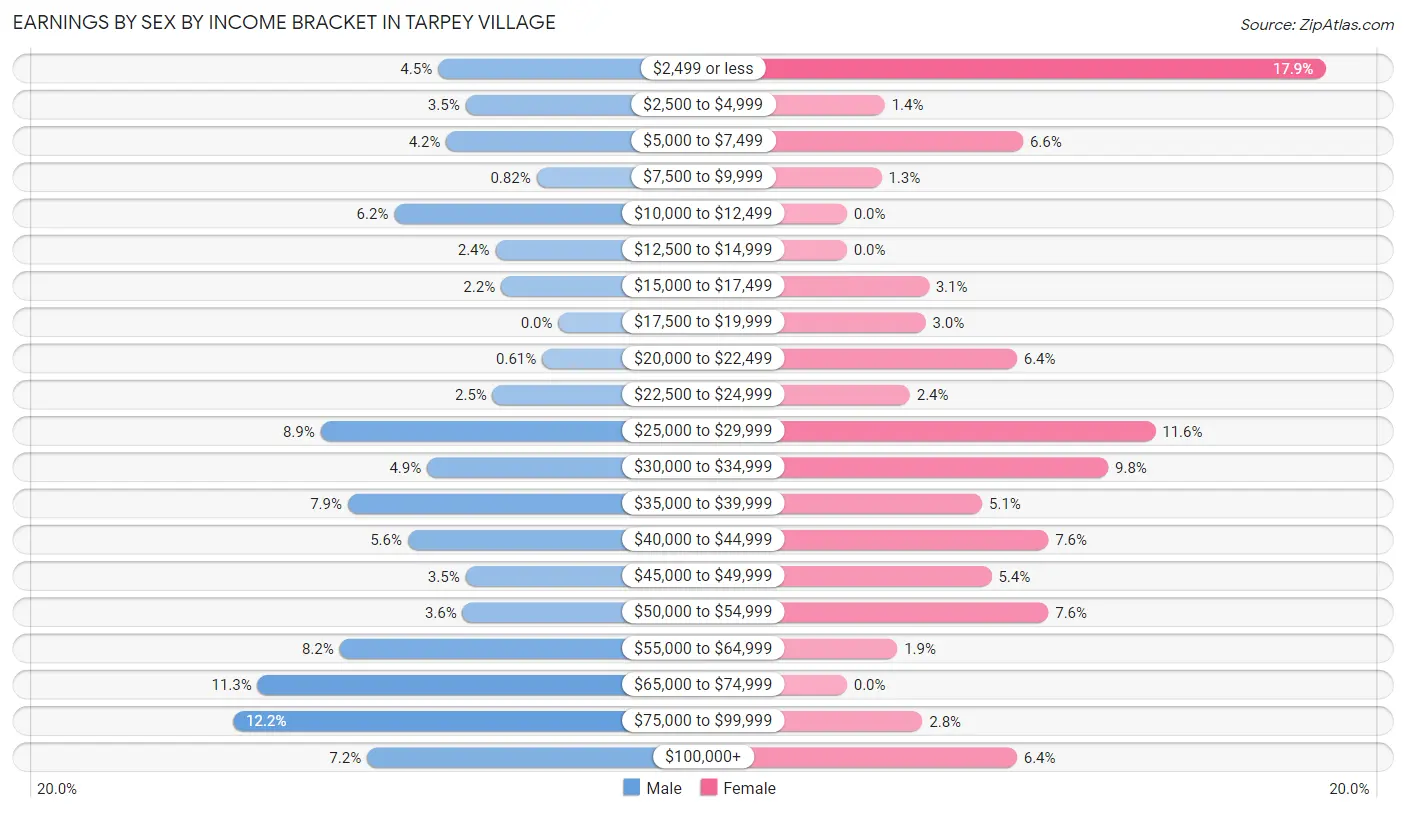
Earnings by Sex by Income Bracket in Tarpey Village
The most common earnings brackets in Tarpey Village are $75,000 to $99,999 for men (119 | 12.2%) and $2,499 or less for women (152 | 17.9%).
| Income | Male | Female |
| $2,499 or less | 44 (4.5%) | 152 (17.9%) |
| $2,500 to $4,999 | 34 (3.5%) | 12 (1.4%) |
| $5,000 to $7,499 | 41 (4.2%) | 56 (6.6%) |
| $7,500 to $9,999 | 8 (0.8%) | 11 (1.3%) |
| $10,000 to $12,499 | 60 (6.1%) | 0 (0.0%) |
| $12,500 to $14,999 | 23 (2.4%) | 0 (0.0%) |
| $15,000 to $17,499 | 21 (2.1%) | 26 (3.1%) |
| $17,500 to $19,999 | 0 (0.0%) | 25 (2.9%) |
| $20,000 to $22,499 | 6 (0.6%) | 54 (6.4%) |
| $22,500 to $24,999 | 24 (2.5%) | 20 (2.4%) |
| $25,000 to $29,999 | 87 (8.9%) | 98 (11.6%) |
| $30,000 to $34,999 | 48 (4.9%) | 83 (9.8%) |
| $35,000 to $39,999 | 77 (7.9%) | 43 (5.1%) |
| $40,000 to $44,999 | 55 (5.6%) | 64 (7.5%) |
| $45,000 to $49,999 | 34 (3.5%) | 46 (5.4%) |
| $50,000 to $54,999 | 35 (3.6%) | 64 (7.5%) |
| $55,000 to $64,999 | 80 (8.2%) | 16 (1.9%) |
| $65,000 to $74,999 | 110 (11.3%) | 0 (0.0%) |
| $75,000 to $99,999 | 119 (12.2%) | 24 (2.8%) |
| $100,000+ | 70 (7.2%) | 54 (6.4%) |
| Total | 976 (100.0%) | 848 (100.0%) |
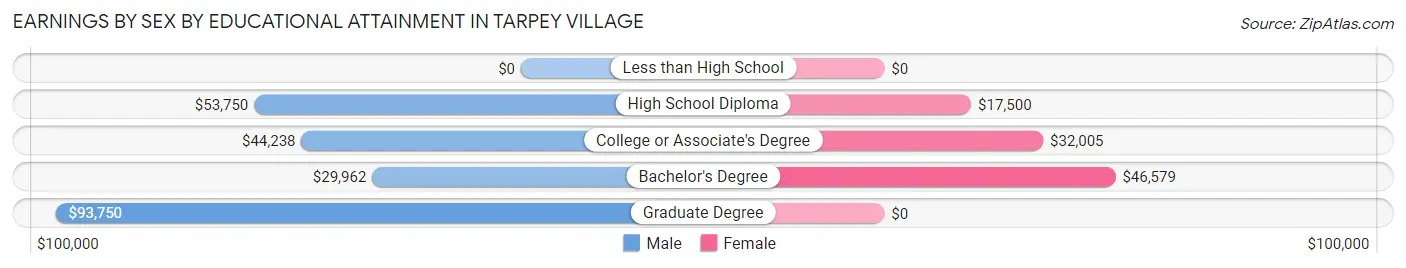
Earnings by Sex by Educational Attainment in Tarpey Village
Average earnings in Tarpey Village are $45,764 for men and $30,354 for women, a difference of 33.7%. Men with an educational attainment of graduate degree enjoy the highest average annual earnings of $93,750, while those with bachelor's degree education earn the least with $29,962. Women with an educational attainment of bachelor's degree earn the most with the average annual earnings of $46,579, while those with high school diploma education have the smallest earnings of $17,500.
| Educational Attainment | Male Income | Female Income |
| Less than High School | - | - |
| High School Diploma | $53,750 | $17,500 |
| College or Associate's Degree | $44,238 | $32,005 |
| Bachelor's Degree | $29,962 | $46,579 |
| Graduate Degree | $93,750 | $0 |
| Total | $45,764 | $30,354 |
Family Income in Tarpey Village
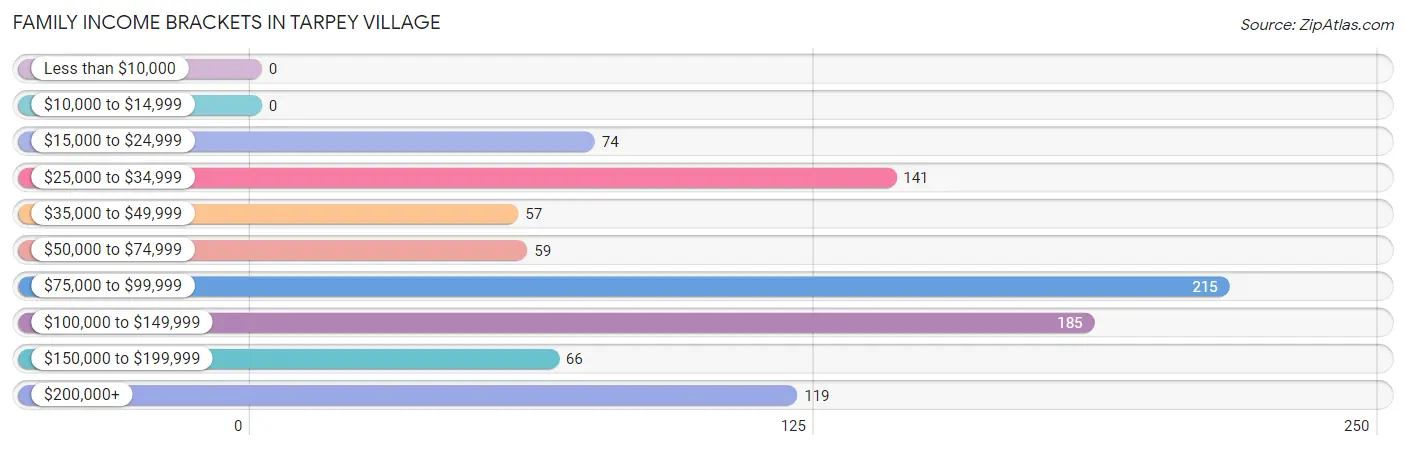
Family Income Brackets in Tarpey Village
According to the Tarpey Village family income data, there are 215 families falling into the $75,000 to $99,999 income range, which is the most common income bracket and makes up 23.5% of all families.
| Income Bracket | # Families | % Families |
| Less than $10,000 | 0 | 0.0% |
| $10,000 to $14,999 | 0 | 0.0% |
| $15,000 to $24,999 | 74 | 8.1% |
| $25,000 to $34,999 | 141 | 15.4% |
| $35,000 to $49,999 | 57 | 6.2% |
| $50,000 to $74,999 | 59 | 6.4% |
| $75,000 to $99,999 | 215 | 23.5% |
| $100,000 to $149,999 | 185 | 20.2% |
| $150,000 to $199,999 | 66 | 7.2% |
| $200,000+ | 119 | 13.0% |
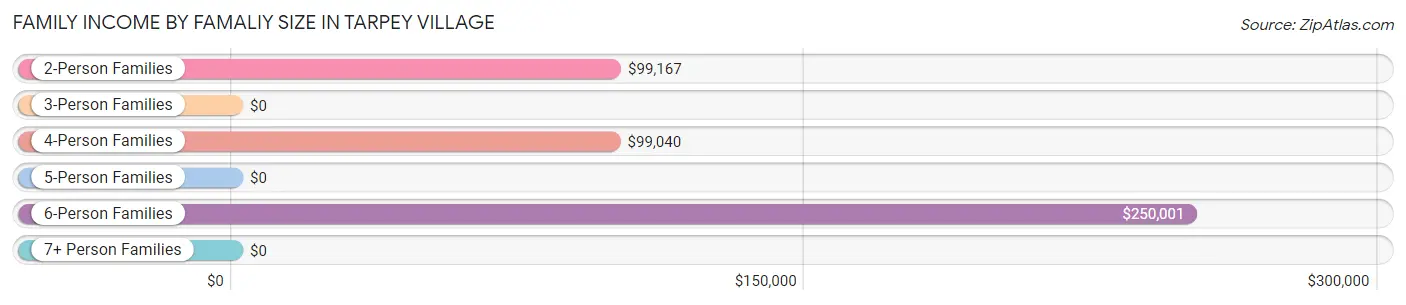
Family Income by Famaliy Size in Tarpey Village
6-person families (49 | 5.3%) account for the highest median family income in Tarpey Village with $250,001 per family, while 2-person families (368 | 40.2%) have the highest median income of $49,584 per family member.
| Income Bracket | # Families | Median Income |
| 2-Person Families | 368 (40.2%) | $99,167 |
| 3-Person Families | 178 (19.4%) | $0 |
| 4-Person Families | 179 (19.5%) | $99,040 |
| 5-Person Families | 112 (12.2%) | $0 |
| 6-Person Families | 49 (5.3%) | $250,001 |
| 7+ Person Families | 30 (3.3%) | $0 |
| Total | 916 (100.0%) | $98,394 |
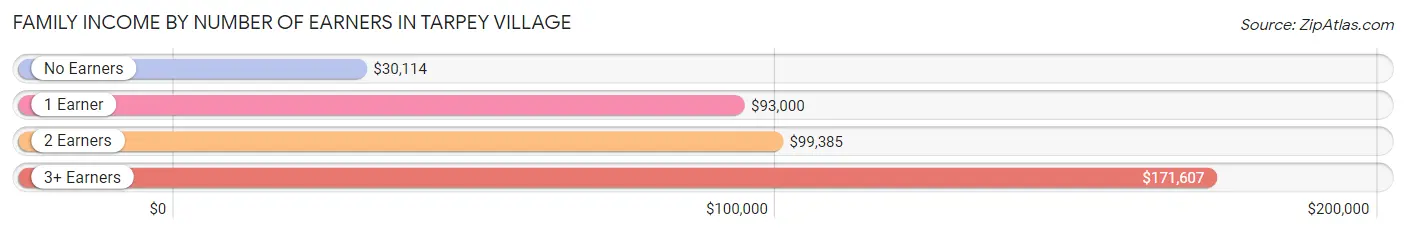
Family Income by Number of Earners in Tarpey Village
The median family income in Tarpey Village is $98,394, with families comprising 3+ earners (145) having the highest median family income of $171,607, while families with no earners (156) have the lowest median family income of $30,114, accounting for 15.8% and 17.0% of families, respectively.
| Number of Earners | # Families | Median Income |
| No Earners | 156 (17.0%) | $30,114 |
| 1 Earner | 186 (20.3%) | $93,000 |
| 2 Earners | 429 (46.8%) | $99,385 |
| 3+ Earners | 145 (15.8%) | $171,607 |
| Total | 916 (100.0%) | $98,394 |
Household Income in Tarpey Village
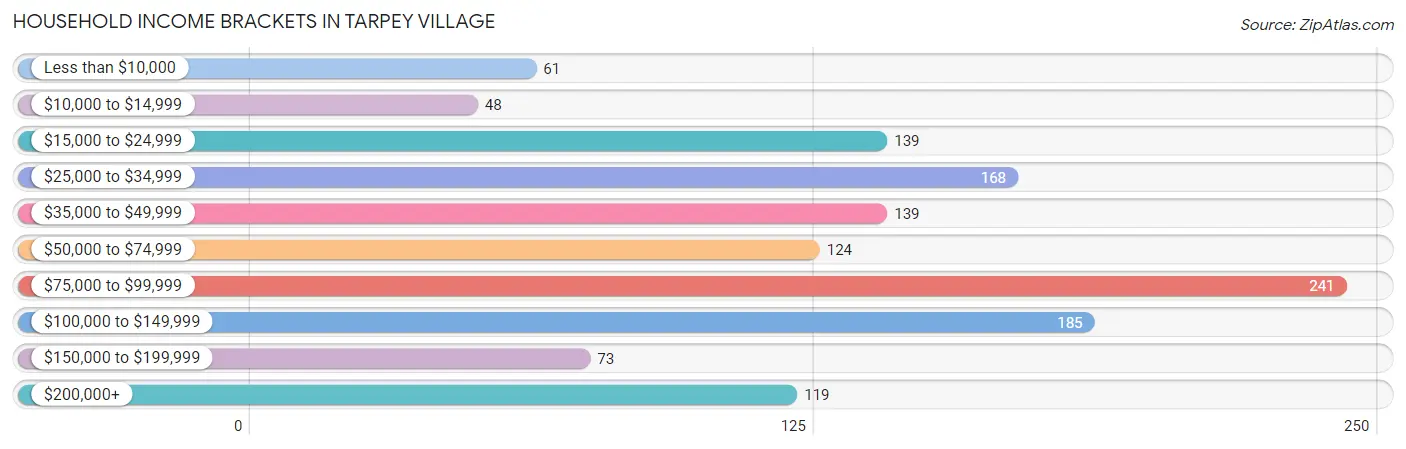
Household Income Brackets in Tarpey Village
With 241 households falling in the category, the $75,000 to $99,999 income range is the most frequent in Tarpey Village, accounting for 18.6% of all households. In contrast, only 48 households (3.7%) fall into the $10,000 to $14,999 income bracket, making it the least populous group.
| Income Bracket | # Households | % Households |
| Less than $10,000 | 61 | 4.7% |
| $10,000 to $14,999 | 48 | 3.7% |
| $15,000 to $24,999 | 139 | 10.7% |
| $25,000 to $34,999 | 168 | 13.0% |
| $35,000 to $49,999 | 139 | 10.7% |
| $50,000 to $74,999 | 124 | 9.6% |
| $75,000 to $99,999 | 241 | 18.6% |
| $100,000 to $149,999 | 185 | 14.3% |
| $150,000 to $199,999 | 73 | 5.6% |
| $200,000+ | 119 | 9.2% |
Household Income by Householder Age in Tarpey Village
The median household income in Tarpey Village is $70,982, with the highest median household income of $97,778 found in the 45 to 64 years age bracket for the primary householder. A total of 540 households (41.7%) fall into this category.
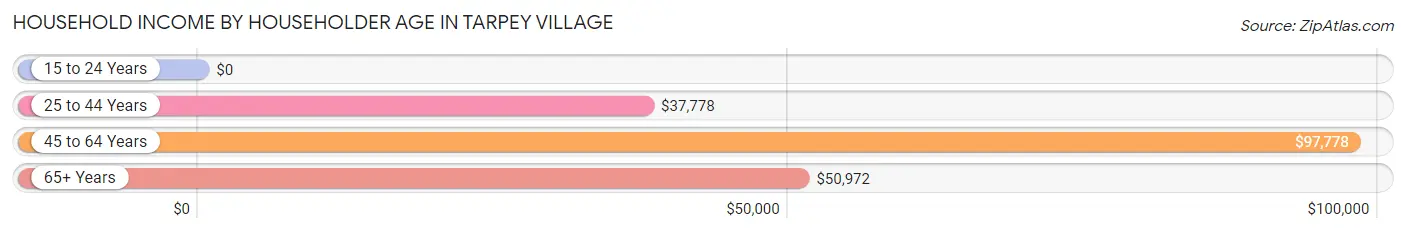
| Income Bracket | # Households | Median Income |
| 15 to 24 Years | 0 (0.0%) | $0 |
| 25 to 44 Years | 272 (21.0%) | $37,778 |
| 45 to 64 Years | 540 (41.7%) | $97,778 |
| 65+ Years | 483 (37.3%) | $50,972 |
| Total | 1,295 (100.0%) | $70,982 |
Poverty in Tarpey Village
Income Below Poverty by Sex and Age in Tarpey Village
With 17.2% poverty level for males and 22.7% for females among the residents of Tarpey Village, 16 and 17 year old males and 12 to 14 year old females are the most vulnerable to poverty, with 24 males (43.6%) and 46 females (83.6%) in their respective age groups living below the poverty level.
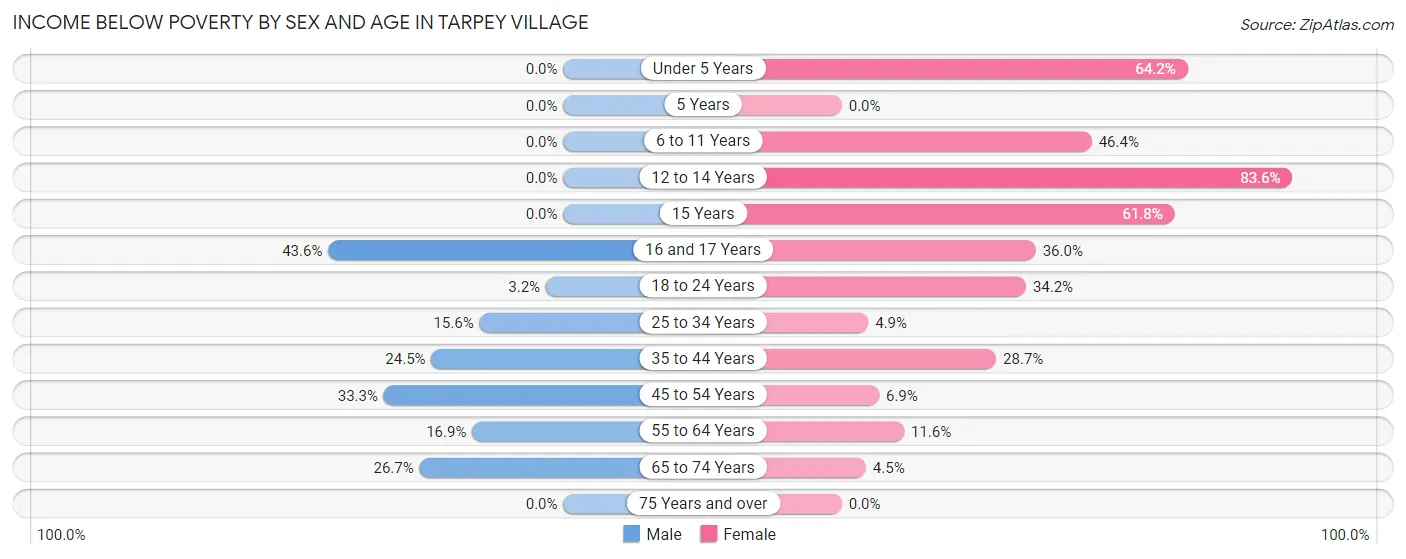
| Age Bracket | Male | Female |
| Under 5 Years | 0 (0.0%) | 86 (64.2%) |
| 5 Years | 0 (0.0%) | 0 (0.0%) |
| 6 to 11 Years | 0 (0.0%) | 77 (46.4%) |
| 12 to 14 Years | 0 (0.0%) | 46 (83.6%) |
| 15 Years | 0 (0.0%) | 21 (61.8%) |
| 16 and 17 Years | 24 (43.6%) | 9 (36.0%) |
| 18 to 24 Years | 3 (3.2%) | 54 (34.2%) |
| 25 to 34 Years | 52 (15.6%) | 9 (4.9%) |
| 35 to 44 Years | 72 (24.5%) | 53 (28.6%) |
| 45 to 54 Years | 68 (33.3%) | 19 (6.9%) |
| 55 to 64 Years | 58 (16.9%) | 23 (11.6%) |
| 65 to 74 Years | 55 (26.7%) | 9 (4.5%) |
| 75 Years and over | 0 (0.0%) | 0 (0.0%) |
| Total | 332 (17.2%) | 406 (22.7%) |
Income Above Poverty by Sex and Age in Tarpey Village
According to the poverty statistics in Tarpey Village, males aged under 5 years and females aged 75 years and over are the age groups that are most secure financially, with 100.0% of males and 100.0% of females in these age groups living above the poverty line.
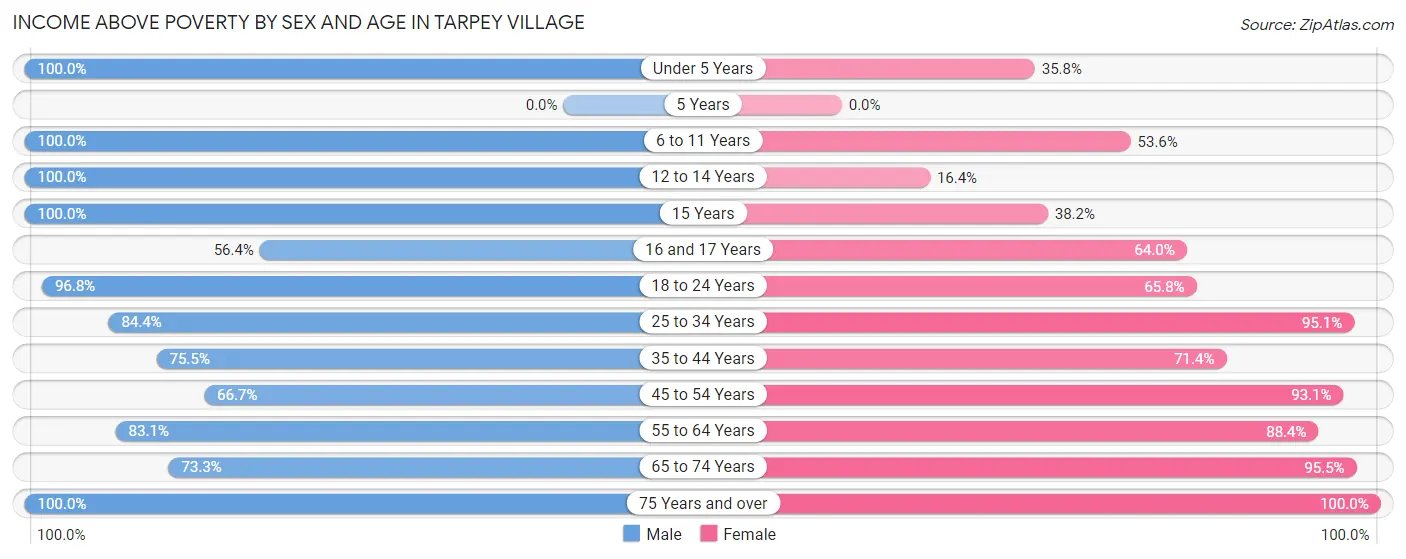
| Age Bracket | Male | Female |
| Under 5 Years | 101 (100.0%) | 48 (35.8%) |
| 5 Years | 0 (0.0%) | 0 (0.0%) |
| 6 to 11 Years | 114 (100.0%) | 89 (53.6%) |
| 12 to 14 Years | 36 (100.0%) | 9 (16.4%) |
| 15 Years | 10 (100.0%) | 13 (38.2%) |
| 16 and 17 Years | 31 (56.4%) | 16 (64.0%) |
| 18 to 24 Years | 90 (96.8%) | 104 (65.8%) |
| 25 to 34 Years | 282 (84.4%) | 174 (95.1%) |
| 35 to 44 Years | 222 (75.5%) | 132 (71.4%) |
| 45 to 54 Years | 136 (66.7%) | 256 (93.1%) |
| 55 to 64 Years | 285 (83.1%) | 176 (88.4%) |
| 65 to 74 Years | 151 (73.3%) | 192 (95.5%) |
| 75 Years and over | 143 (100.0%) | 172 (100.0%) |
| Total | 1,601 (82.8%) | 1,381 (77.3%) |
Income Below Poverty Among Married-Couple Families in Tarpey Village
The poverty statistics for married-couple families in Tarpey Village show that 13.8% or 89 of the total 647 families live below the poverty line. Families with 1 or 2 children have the highest poverty rate of 38.1%, comprising of 82 families. On the other hand, families with 3 or 4 children have the lowest poverty rate of 0.0%, which includes 0 families.
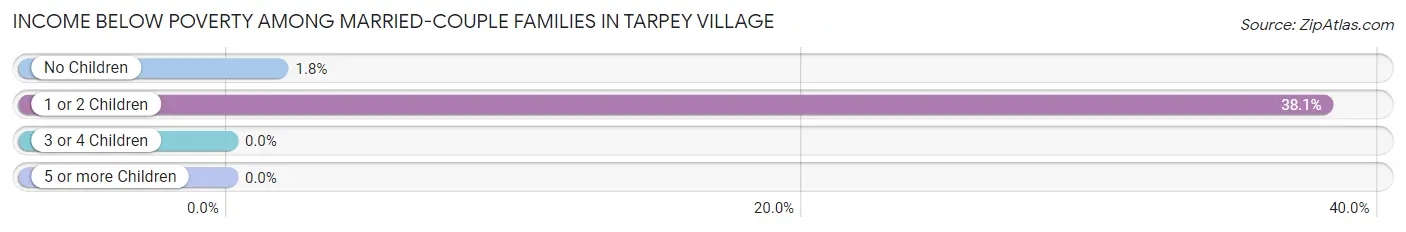
| Children | Above Poverty | Below Poverty |
| No Children | 390 (98.2%) | 7 (1.8%) |
| 1 or 2 Children | 133 (61.9%) | 82 (38.1%) |
| 3 or 4 Children | 35 (100.0%) | 0 (0.0%) |
| 5 or more Children | 0 (0.0%) | 0 (0.0%) |
| Total | 558 (86.2%) | 89 (13.8%) |
Income Below Poverty Among Single-Parent Households in Tarpey Village
According to the poverty data in Tarpey Village, 20.2% or 36 single-father households and 9.9% or 9 single-mother households are living below the poverty line. Among single-father households, those with 1 or 2 children have the highest poverty rate, with 36 households (31.0%) experiencing poverty. Likewise, among single-mother households, those with 1 or 2 children have the highest poverty rate, with 9 households (18.4%) falling below the poverty line.
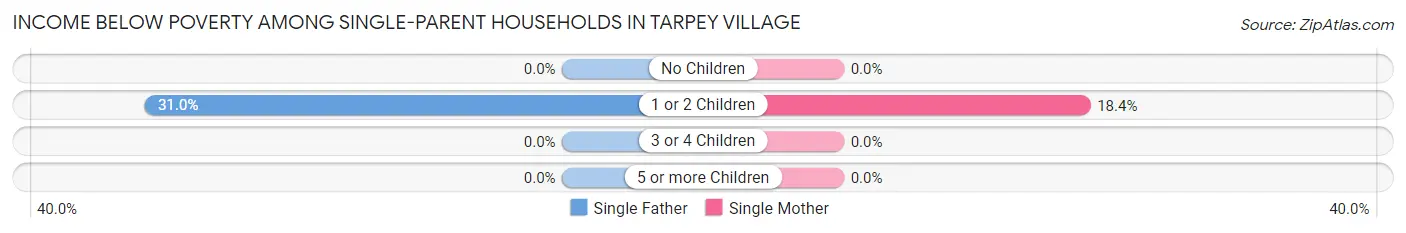
| Children | Single Father | Single Mother |
| No Children | 0 (0.0%) | 0 (0.0%) |
| 1 or 2 Children | 36 (31.0%) | 9 (18.4%) |
| 3 or 4 Children | 0 (0.0%) | 0 (0.0%) |
| 5 or more Children | 0 (0.0%) | 0 (0.0%) |
| Total | 36 (20.2%) | 9 (9.9%) |
Income Below Poverty Among Married-Couple vs Single-Parent Households in Tarpey Village
The poverty data for Tarpey Village shows that 89 of the married-couple family households (13.8%) and 45 of the single-parent households (16.7%) are living below the poverty level. Within the married-couple family households, those with 1 or 2 children have the highest poverty rate, with 82 households (38.1%) falling below the poverty line. Among the single-parent households, those with 1 or 2 children have the highest poverty rate, with 45 household (27.3%) living below poverty.
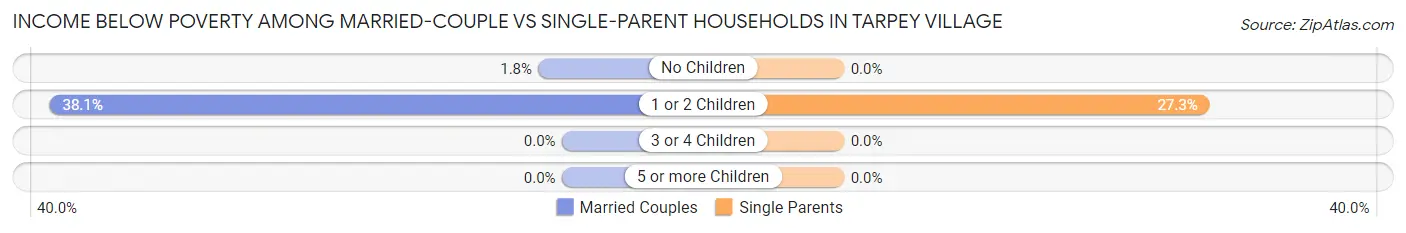
| Children | Married-Couple Families | Single-Parent Households |
| No Children | 7 (1.8%) | 0 (0.0%) |
| 1 or 2 Children | 82 (38.1%) | 45 (27.3%) |
| 3 or 4 Children | 0 (0.0%) | 0 (0.0%) |
| 5 or more Children | 0 (0.0%) | 0 (0.0%) |
| Total | 89 (13.8%) | 45 (16.7%) |
Race in Tarpey Village
The most populous races in Tarpey Village are White / Caucasian (2,155 | 57.5%), Hispanic or Latino (1,175 | 31.4%), and Two or more Races (573 | 15.3%).
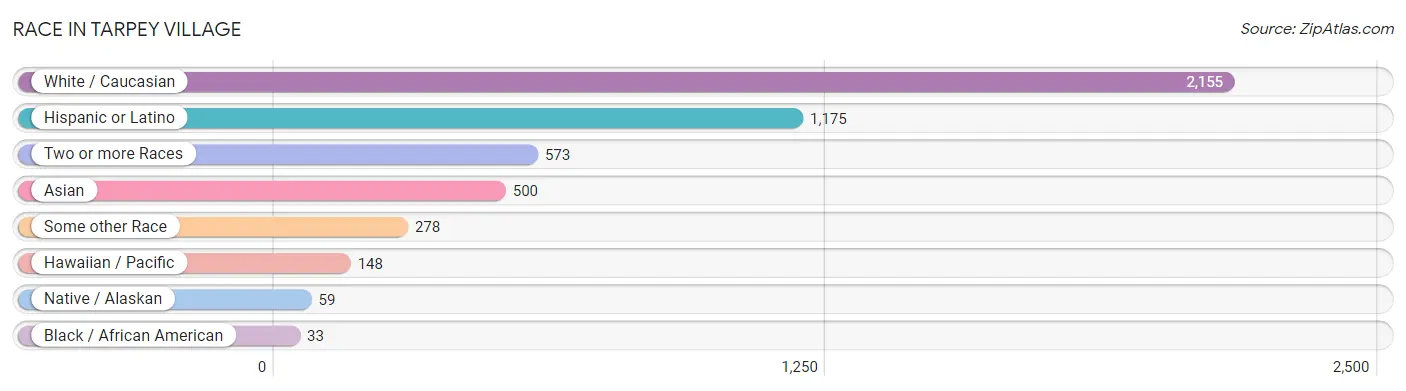
| Race | # Population | % Population |
| Asian | 500 | 13.4% |
| Black / African American | 33 | 0.9% |
| Hawaiian / Pacific | 148 | 4.0% |
| Hispanic or Latino | 1,175 | 31.4% |
| Native / Alaskan | 59 | 1.6% |
| White / Caucasian | 2,155 | 57.5% |
| Two or more Races | 573 | 15.3% |
| Some other Race | 278 | 7.4% |
| Total | 3,746 | 100.0% |
Ancestry in Tarpey Village
The most populous ancestries reported in Tarpey Village are Mexican (885 | 23.6%), German (456 | 12.2%), English (420 | 11.2%), Bangladeshi (383 | 10.2%), and Irish (262 | 7.0%), together accounting for 64.2% of all Tarpey Village residents.
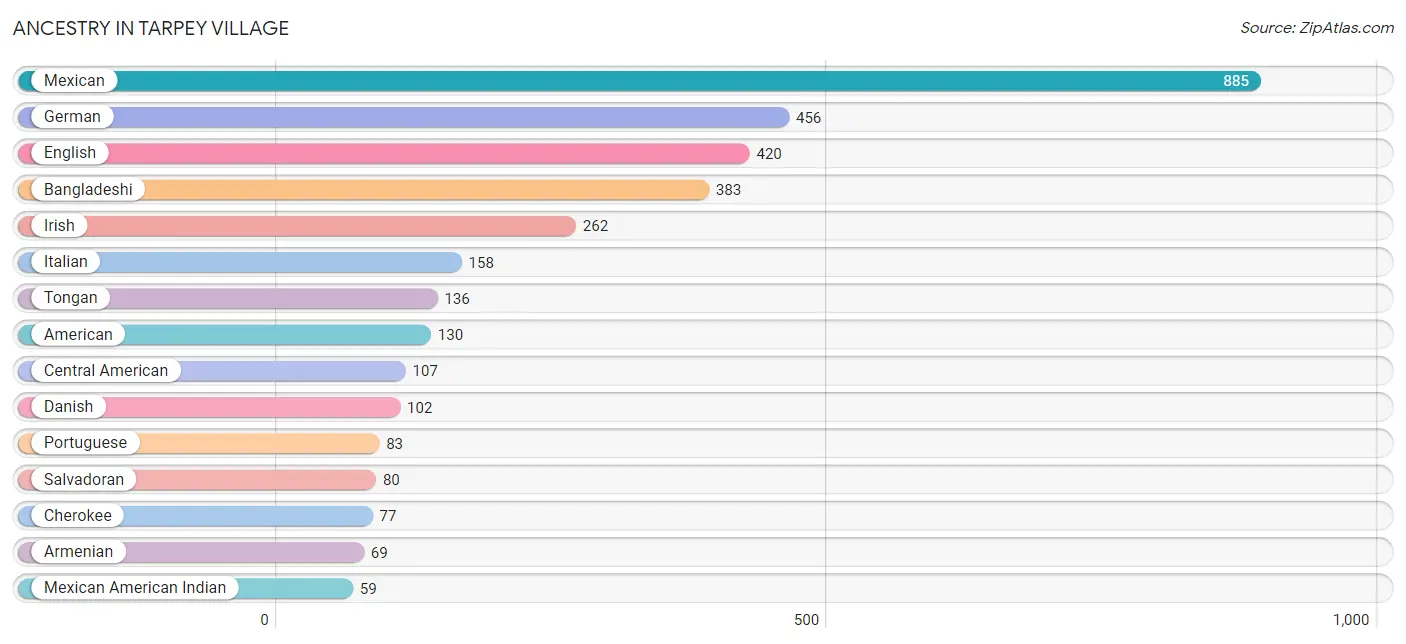
| Ancestry | # Population | % Population |
| American | 130 | 3.5% |
| Apache | 25 | 0.7% |
| Armenian | 69 | 1.8% |
| Bangladeshi | 383 | 10.2% |
| Bhutanese | 6 | 0.2% |
| Blackfeet | 27 | 0.7% |
| British | 19 | 0.5% |
| Burmese | 44 | 1.2% |
| Central American | 107 | 2.9% |
| Central American Indian | 44 | 1.2% |
| Cherokee | 77 | 2.1% |
| Choctaw | 12 | 0.3% |
| Cuban | 8 | 0.2% |
| Danish | 102 | 2.7% |
| Dutch | 42 | 1.1% |
| Ecuadorian | 28 | 0.7% |
| English | 420 | 11.2% |
| European | 8 | 0.2% |
| French | 16 | 0.4% |
| German | 456 | 12.2% |
| Greek | 21 | 0.6% |
| Indian (Asian) | 39 | 1.0% |
| Iranian | 24 | 0.6% |
| Irish | 262 | 7.0% |
| Italian | 158 | 4.2% |
| Malaysian | 11 | 0.3% |
| Mexican | 885 | 23.6% |
| Mexican American Indian | 59 | 1.6% |
| Native Hawaiian | 12 | 0.3% |
| Nicaraguan | 27 | 0.7% |
| Norwegian | 20 | 0.5% |
| Pennsylvania German | 8 | 0.2% |
| Portuguese | 83 | 2.2% |
| Puerto Rican | 56 | 1.5% |
| Salvadoran | 80 | 2.1% |
| Scotch-Irish | 7 | 0.2% |
| Scottish | 37 | 1.0% |
| South American | 28 | 0.7% |
| Spaniard | 11 | 0.3% |
| Spanish | 56 | 1.5% |
| Swedish | 41 | 1.1% |
| Swiss | 8 | 0.2% |
| Thai | 27 | 0.7% |
| Tongan | 136 | 3.6% |
| Welsh | 11 | 0.3% | View All 45 Rows |
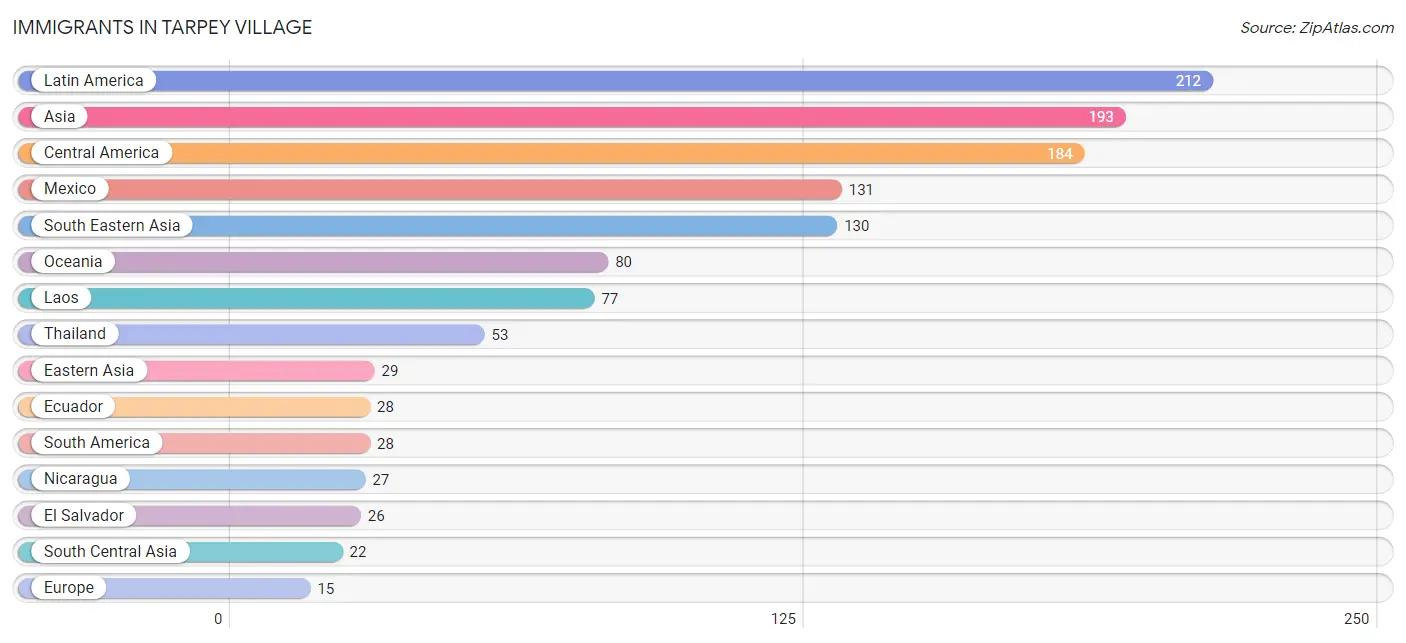
Immigrants in Tarpey Village
The most numerous immigrant groups reported in Tarpey Village came from Latin America (212 | 5.7%), Asia (193 | 5.1%), Central America (184 | 4.9%), Mexico (131 | 3.5%), and South Eastern Asia (130 | 3.5%), together accounting for 22.7% of all Tarpey Village residents.
| Immigration Origin | # Population | % Population |
| Armenia | 6 | 0.2% |
| Asia | 193 | 5.1% |
| Canada | 10 | 0.3% |
| Central America | 184 | 4.9% |
| China | 13 | 0.4% |
| Eastern Asia | 29 | 0.8% |
| Ecuador | 28 | 0.7% |
| El Salvador | 26 | 0.7% |
| Europe | 15 | 0.4% |
| Iran | 12 | 0.3% |
| Japan | 6 | 0.2% |
| Korea | 10 | 0.3% |
| Laos | 77 | 2.1% |
| Latin America | 212 | 5.7% |
| Lebanon | 6 | 0.2% |
| Mexico | 131 | 3.5% |
| Nepal | 10 | 0.3% |
| Nicaragua | 27 | 0.7% |
| Northern Europe | 15 | 0.4% |
| Oceania | 80 | 2.1% |
| South America | 28 | 0.7% |
| South Central Asia | 22 | 0.6% |
| South Eastern Asia | 130 | 3.5% |
| Thailand | 53 | 1.4% |
| Western Asia | 12 | 0.3% | View All 25 Rows |
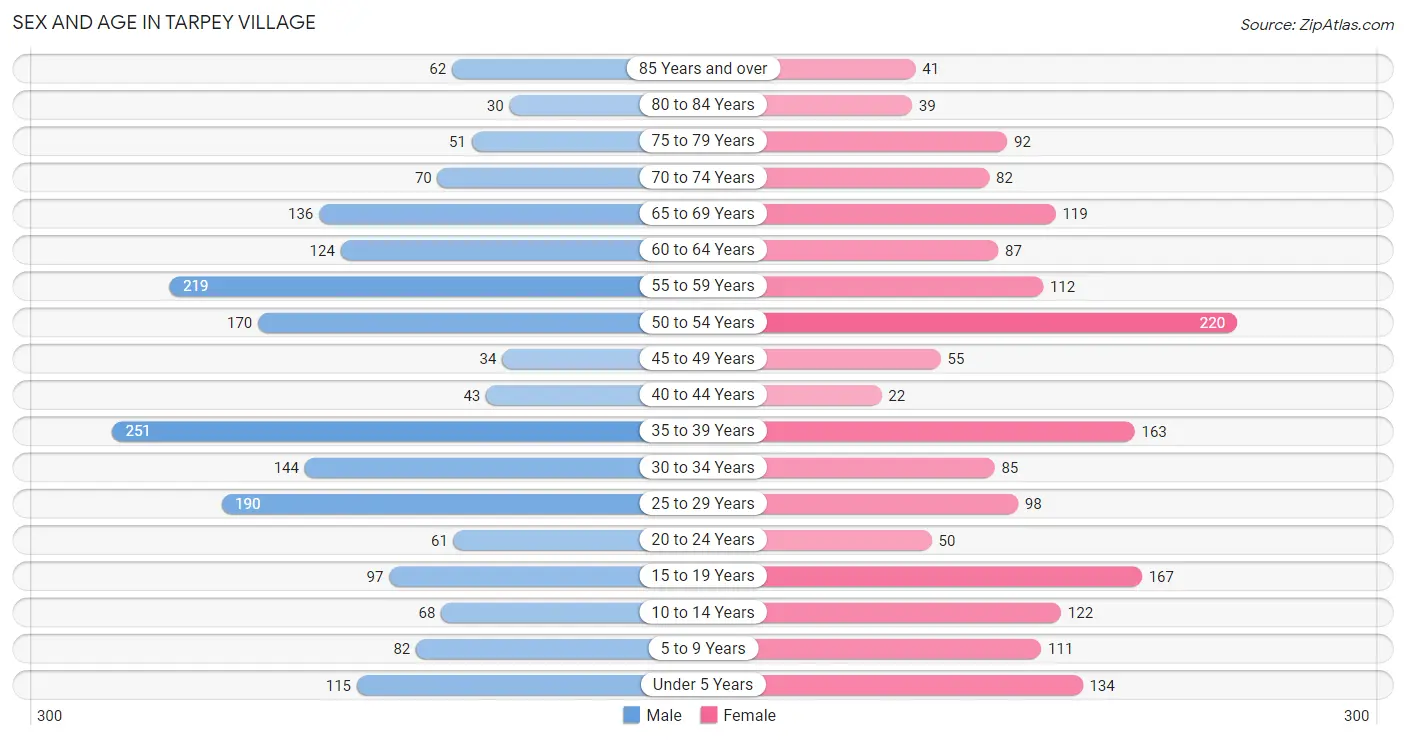
Sex and Age in Tarpey Village
Sex and Age in Tarpey Village
The most populous age groups in Tarpey Village are 35 to 39 Years (251 | 12.9%) for men and 50 to 54 Years (220 | 12.2%) for women.
| Age Bracket | Male | Female |
| Under 5 Years | 115 (5.9%) | 134 (7.4%) |
| 5 to 9 Years | 82 (4.2%) | 111 (6.2%) |
| 10 to 14 Years | 68 (3.5%) | 122 (6.8%) |
| 15 to 19 Years | 97 (5.0%) | 167 (9.3%) |
| 20 to 24 Years | 61 (3.1%) | 50 (2.8%) |
| 25 to 29 Years | 190 (9.8%) | 98 (5.4%) |
| 30 to 34 Years | 144 (7.4%) | 85 (4.7%) |
| 35 to 39 Years | 251 (12.9%) | 163 (9.1%) |
| 40 to 44 Years | 43 (2.2%) | 22 (1.2%) |
| 45 to 49 Years | 34 (1.8%) | 55 (3.1%) |
| 50 to 54 Years | 170 (8.7%) | 220 (12.2%) |
| 55 to 59 Years | 219 (11.3%) | 112 (6.2%) |
| 60 to 64 Years | 124 (6.4%) | 87 (4.8%) |
| 65 to 69 Years | 136 (7.0%) | 119 (6.6%) |
| 70 to 74 Years | 70 (3.6%) | 82 (4.6%) |
| 75 to 79 Years | 51 (2.6%) | 92 (5.1%) |
| 80 to 84 Years | 30 (1.5%) | 39 (2.2%) |
| 85 Years and over | 62 (3.2%) | 41 (2.3%) |
| Total | 1,947 (100.0%) | 1,799 (100.0%) |
Families and Households in Tarpey Village
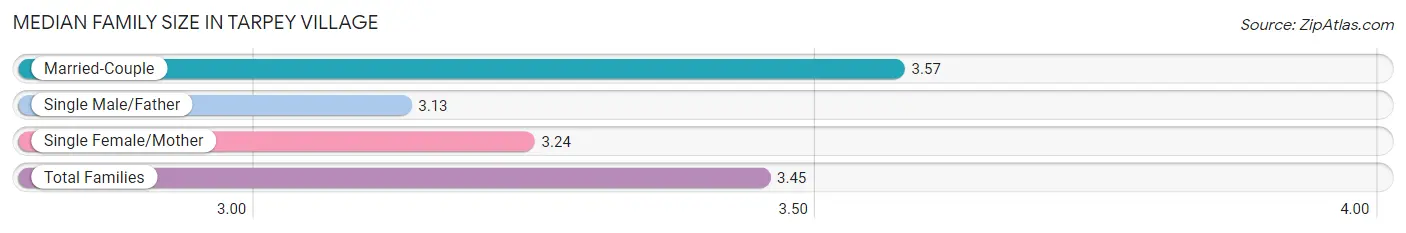
Median Family Size in Tarpey Village
The median family size in Tarpey Village is 3.45 persons per family, with married-couple families (647 | 70.6%) accounting for the largest median family size of 3.57 persons per family. On the other hand, single male/father families (178 | 19.4%) represent the smallest median family size with 3.13 persons per family.
| Family Type | # Families | Family Size |
| Married-Couple | 647 (70.6%) | 3.57 |
| Single Male/Father | 178 (19.4%) | 3.13 |
| Single Female/Mother | 91 (9.9%) | 3.24 |
| Total Families | 916 (100.0%) | 3.45 |
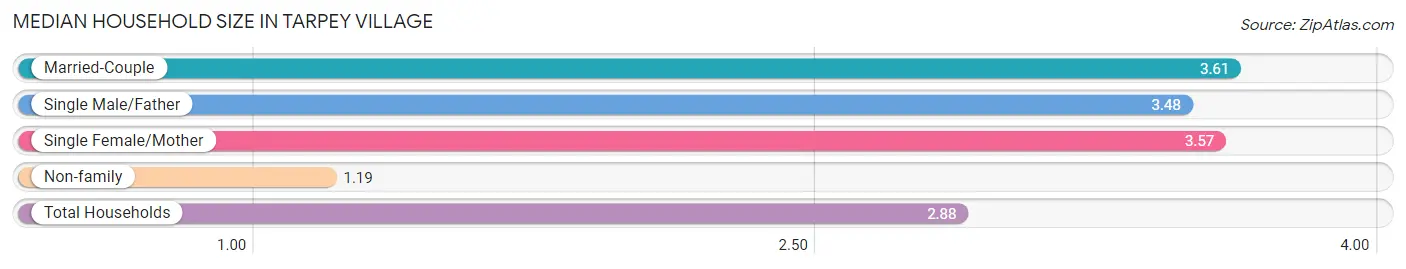
Median Household Size in Tarpey Village
The median household size in Tarpey Village is 2.88 persons per household, with married-couple households (647 | 50.0%) accounting for the largest median household size of 3.61 persons per household. non-family households (379 | 29.3%) represent the smallest median household size with 1.19 persons per household.
| Household Type | # Households | Household Size |
| Married-Couple | 647 (50.0%) | 3.61 |
| Single Male/Father | 178 (13.8%) | 3.48 |
| Single Female/Mother | 91 (7.0%) | 3.57 |
| Non-family | 379 (29.3%) | 1.19 |
| Total Households | 1,295 (100.0%) | 2.88 |
Household Size by Marriage Status in Tarpey Village
Out of a total of 1,295 households in Tarpey Village, 916 (70.7%) are family households, while 379 (29.3%) are nonfamily households. The most numerous type of family households are 2-person households, comprising 314, and the most common type of nonfamily households are 1-person households, comprising 313.
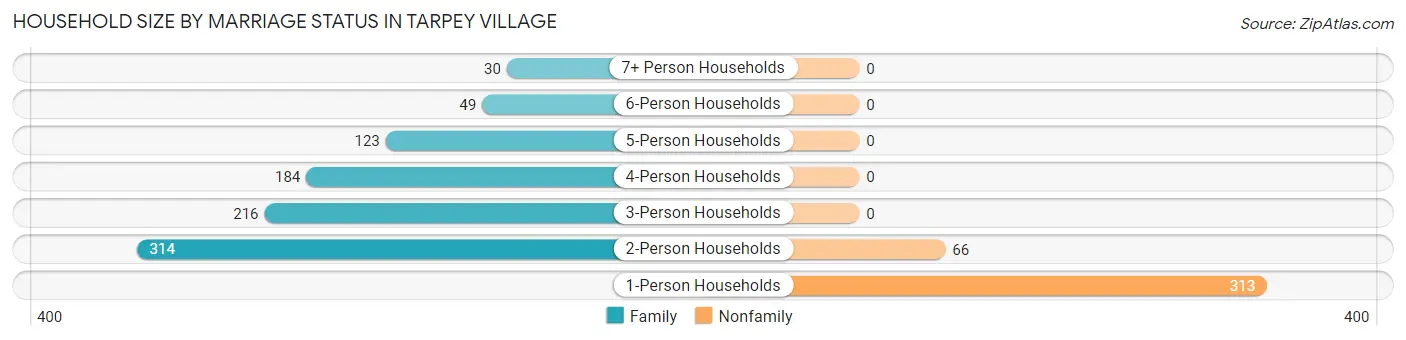
| Household Size | Family Households | Nonfamily Households |
| 1-Person Households | - | 313 (24.2%) |
| 2-Person Households | 314 (24.2%) | 66 (5.1%) |
| 3-Person Households | 216 (16.7%) | 0 (0.0%) |
| 4-Person Households | 184 (14.2%) | 0 (0.0%) |
| 5-Person Households | 123 (9.5%) | 0 (0.0%) |
| 6-Person Households | 49 (3.8%) | 0 (0.0%) |
| 7+ Person Households | 30 (2.3%) | 0 (0.0%) |
| Total | 916 (70.7%) | 379 (29.3%) |
Female Fertility in Tarpey Village
Fertility by Age in Tarpey Village
Average fertility rate in Tarpey Village is 56.0 births per 1,000 women. Women in the age bracket of 15 to 19 years have the highest fertility rate with 150.0 births per 1,000 women. Women in the age bracket of 15 to 19 years acount for 67.6% of all women with births.
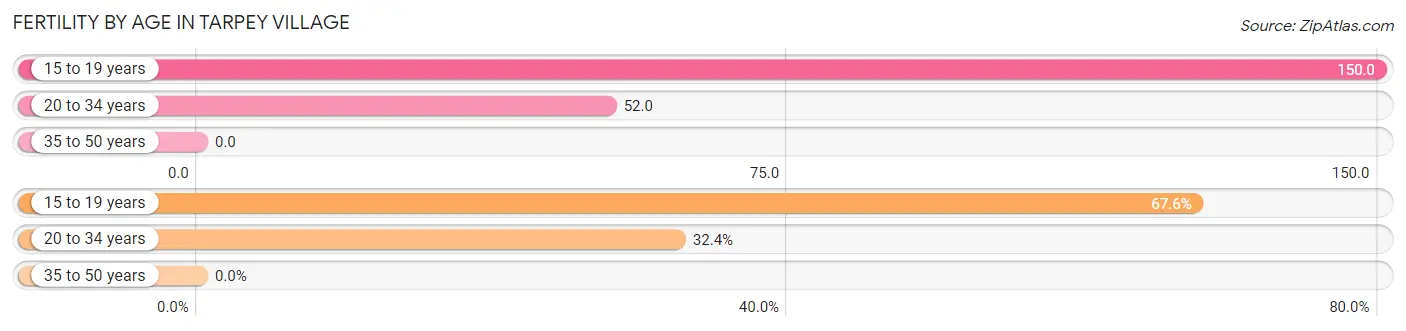
| Age Bracket | Women with Births | Births / 1,000 Women |
| 15 to 19 years | 25 (67.6%) | 150.0 |
| 20 to 34 years | 12 (32.4%) | 52.0 |
| 35 to 50 years | 0 (0.0%) | 0.0 |
| Total | 37 (100.0%) | 56.0 |
Fertility by Age by Marriage Status in Tarpey Village
32.4% of women with births (37) in Tarpey Village are married. The highest percentage of unmarried women with births falls into 15 to 19 years age bracket with 100.0% of them unmarried at the time of birth, while the lowest percentage of unmarried women with births belong to 20 to 34 years age bracket with 0.0% of them unmarried.
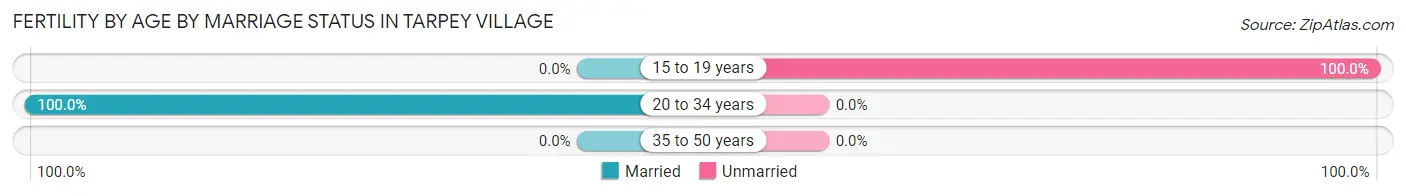
| Age Bracket | Married | Unmarried |
| 15 to 19 years | 0 (0.0%) | 25 (100.0%) |
| 20 to 34 years | 12 (100.0%) | 0 (0.0%) |
| 35 to 50 years | 0 (0.0%) | 0 (0.0%) |
| Total | 12 (32.4%) | 25 (67.6%) |
Fertility by Education in Tarpey Village
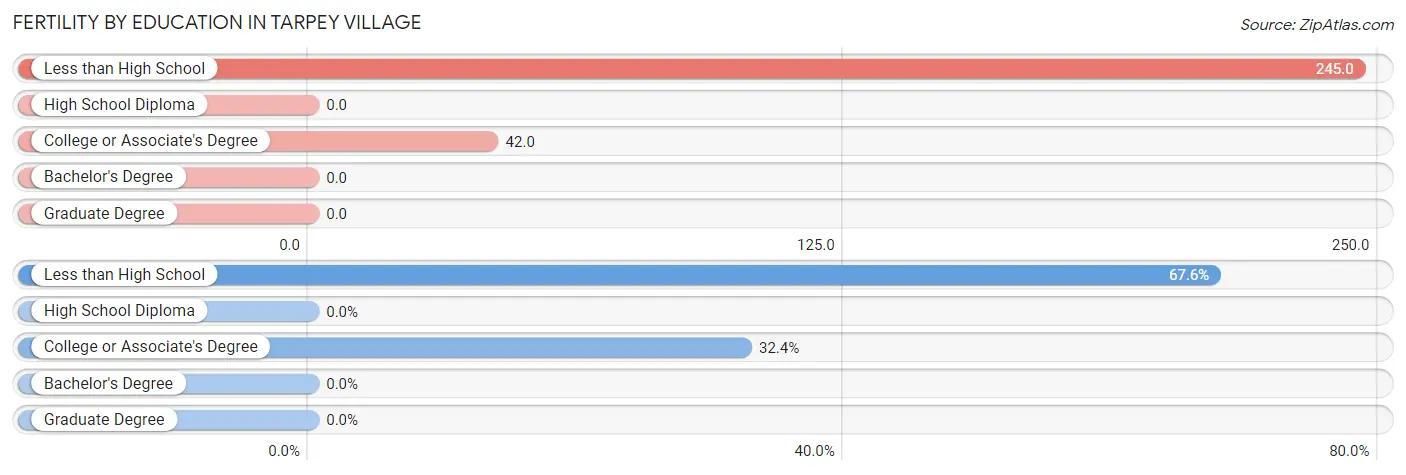
| Educational Attainment | Women with Births | Births / 1,000 Women |
| Less than High School | 25 (67.6%) | 245.0 |
| High School Diploma | 0 (0.0%) | 0.0 |
| College or Associate's Degree | 12 (32.4%) | 42.0 |
| Bachelor's Degree | 0 (0.0%) | 0.0 |
| Graduate Degree | 0 (0.0%) | 0.0 |
| Total | 37 (100.0%) | 56.0 |
Fertility by Education by Marriage Status in Tarpey Village
67.6% of women with births in Tarpey Village are unmarried. Women with the educational attainment of college or associate's degree are most likely to be married with 100.0% of them married at childbirth, while women with the educational attainment of less than high school are least likely to be married with 100.0% of them unmarried at childbirth.
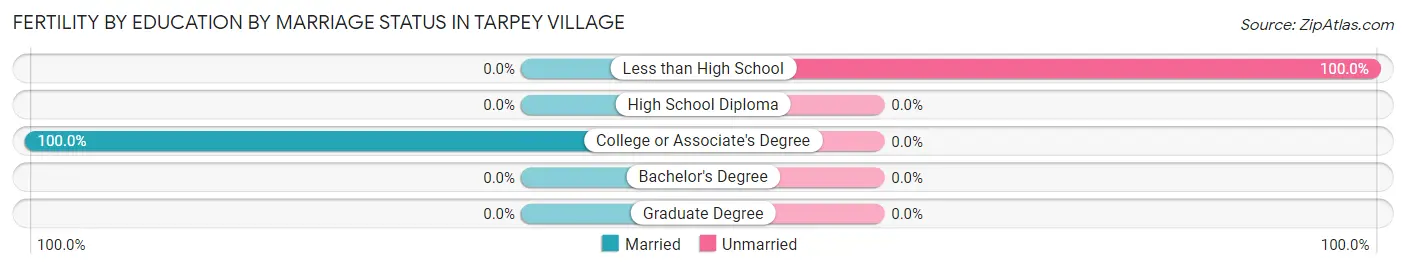
| Educational Attainment | Married | Unmarried |
| Less than High School | 0 (0.0%) | 25 (100.0%) |
| High School Diploma | 0 (0.0%) | 0 (0.0%) |
| College or Associate's Degree | 12 (100.0%) | 0 (0.0%) |
| Bachelor's Degree | 0 (0.0%) | 0 (0.0%) |
| Graduate Degree | 0 (0.0%) | 0 (0.0%) |
| Total | 12 (32.4%) | 25 (67.6%) |
Employment Characteristics in Tarpey Village
Employment by Class of Employer in Tarpey Village
Among the 1,543 employed individuals in Tarpey Village, private company employees (916 | 59.4%), state government employees (151 | 9.8%), and self-employed (not incorporated) (137 | 8.9%) make up the most common classes of employment.
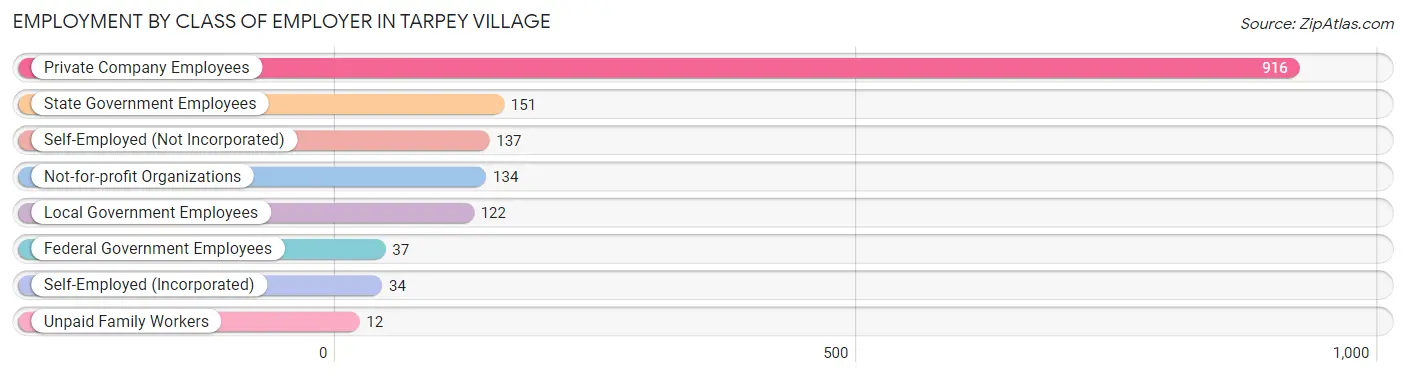
| Employer Class | # Employees | % Employees |
| Private Company Employees | 916 | 59.4% |
| Self-Employed (Incorporated) | 34 | 2.2% |
| Self-Employed (Not Incorporated) | 137 | 8.9% |
| Not-for-profit Organizations | 134 | 8.7% |
| Local Government Employees | 122 | 7.9% |
| State Government Employees | 151 | 9.8% |
| Federal Government Employees | 37 | 2.4% |
| Unpaid Family Workers | 12 | 0.8% |
| Total | 1,543 | 100.0% |
Employment Status by Age in Tarpey Village
According to the labor force statistics for Tarpey Village, out of the total population over 16 years of age (3,070), 57.4% or 1,762 individuals are in the labor force, with 9.5% or 167 of them unemployed. The age group with the highest labor force participation rate is 20 to 24 years, with 98.2% or 109 individuals in the labor force. Within the labor force, the 16 to 19 years age range has the highest percentage of unemployed individuals, with 44.3% or 31 of them being unemployed.
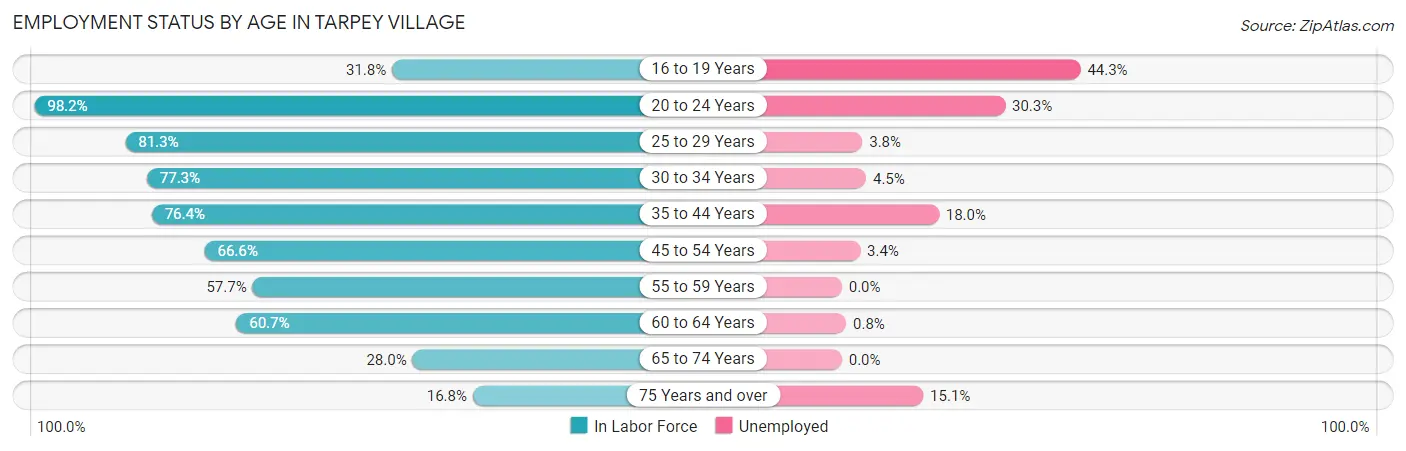
| Age Bracket | In Labor Force | Unemployed |
| 16 to 19 Years | 70 (31.8%) | 31 (44.3%) |
| 20 to 24 Years | 109 (98.2%) | 33 (30.3%) |
| 25 to 29 Years | 234 (81.3%) | 9 (3.8%) |
| 30 to 34 Years | 177 (77.3%) | 8 (4.5%) |
| 35 to 44 Years | 366 (76.4%) | 66 (18.0%) |
| 45 to 54 Years | 319 (66.6%) | 11 (3.4%) |
| 55 to 59 Years | 191 (57.7%) | 0 (0.0%) |
| 60 to 64 Years | 128 (60.7%) | 1 (0.8%) |
| 65 to 74 Years | 114 (28.0%) | 0 (0.0%) |
| 75 Years and over | 53 (16.8%) | 8 (15.1%) |
| Total | 1,762 (57.4%) | 167 (9.5%) |
Employment Status by Educational Attainment in Tarpey Village
According to labor force statistics for Tarpey Village, 70.2% of individuals (1,416) out of the total population between 25 and 64 years of age (2,017) are in the labor force, with 6.7% or 95 of them being unemployed. The group with the highest labor force participation rate are those with the educational attainment of bachelor's degree or higher, with 90.7% or 234 individuals in the labor force. Within the labor force, individuals with less than high school education have the highest percentage of unemployment, with 16.1% or 10 of them being unemployed.
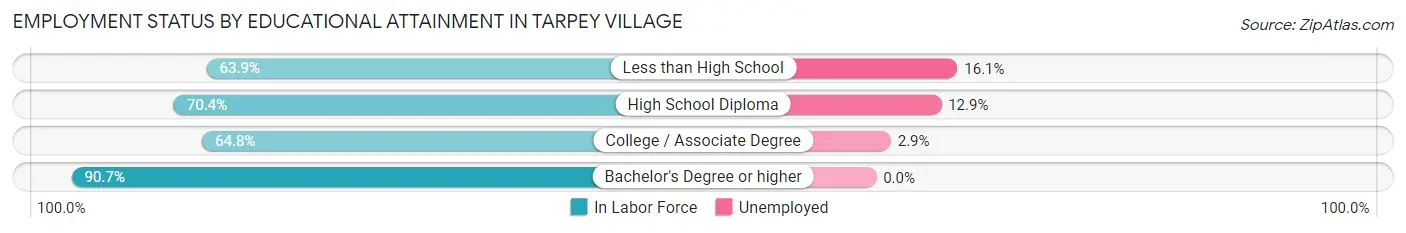
| Educational Attainment | In Labor Force | Unemployed |
| Less than High School | 62 (63.9%) | 16 (16.1%) |
| High School Diploma | 528 (70.4%) | 97 (12.9%) |
| College / Associate Degree | 591 (64.8%) | 26 (2.9%) |
| Bachelor's Degree or higher | 234 (90.7%) | 0 (0.0%) |
| Total | 1,416 (70.2%) | 135 (6.7%) |
Employment Occupations by Sex in Tarpey Village
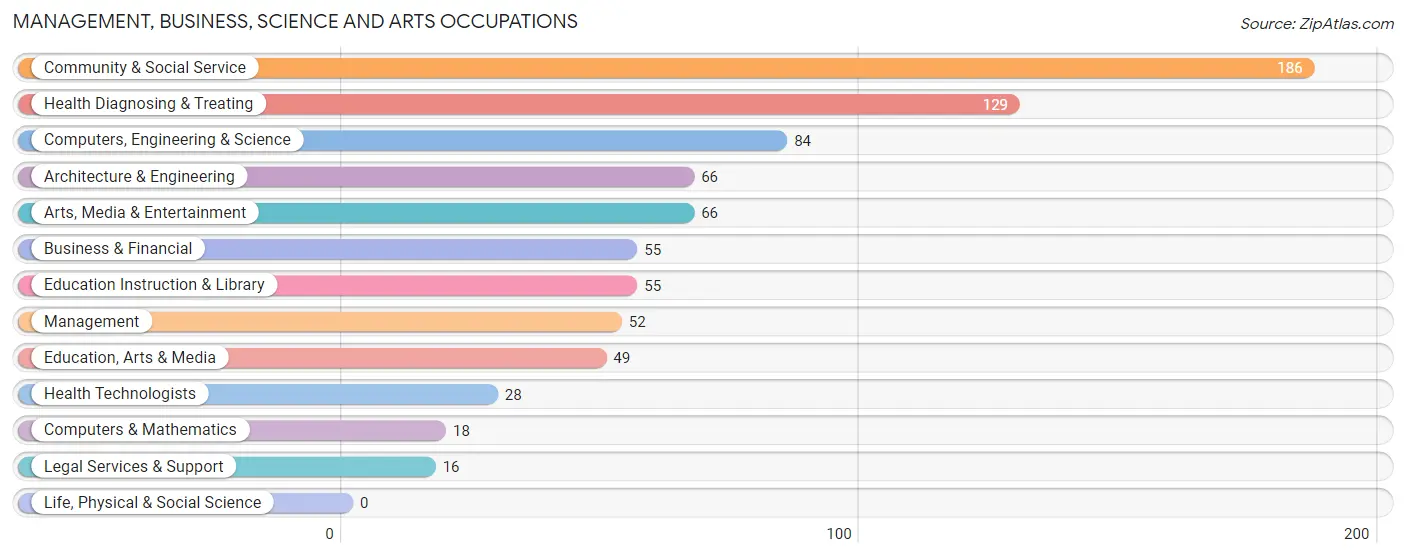
Management, Business, Science and Arts Occupations
The most common Management, Business, Science and Arts occupations in Tarpey Village are Community & Social Service (186 | 11.7%), Health Diagnosing & Treating (129 | 8.1%), Computers, Engineering & Science (84 | 5.3%), Architecture & Engineering (66 | 4.1%), and Arts, Media & Entertainment (66 | 4.1%).
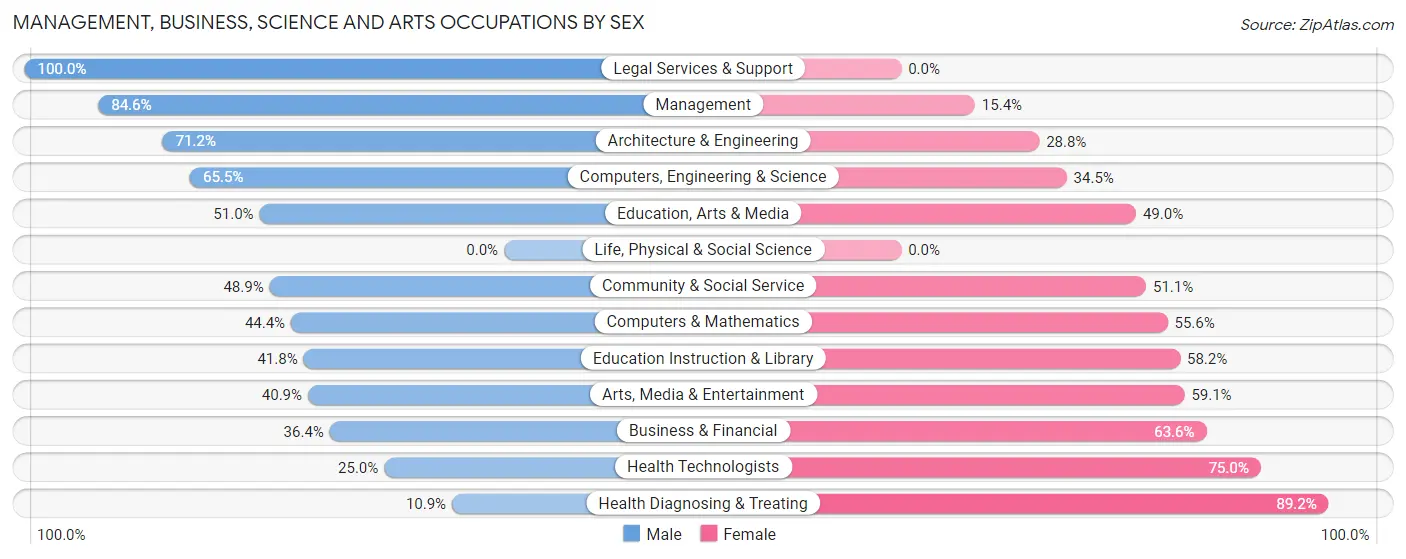
Management, Business, Science and Arts Occupations by Sex
Within the Management, Business, Science and Arts occupations in Tarpey Village, the most male-oriented occupations are Legal Services & Support (100.0%), Management (84.6%), and Architecture & Engineering (71.2%), while the most female-oriented occupations are Health Diagnosing & Treating (89.1%), Health Technologists (75.0%), and Business & Financial (63.6%).
| Occupation | Male | Female |
| Management | 44 (84.6%) | 8 (15.4%) |
| Business & Financial | 20 (36.4%) | 35 (63.6%) |
| Computers, Engineering & Science | 55 (65.5%) | 29 (34.5%) |
| Computers & Mathematics | 8 (44.4%) | 10 (55.6%) |
| Architecture & Engineering | 47 (71.2%) | 19 (28.8%) |
| Life, Physical & Social Science | 0 (0.0%) | 0 (0.0%) |
| Community & Social Service | 91 (48.9%) | 95 (51.1%) |
| Education, Arts & Media | 25 (51.0%) | 24 (49.0%) |
| Legal Services & Support | 16 (100.0%) | 0 (0.0%) |
| Education Instruction & Library | 23 (41.8%) | 32 (58.2%) |
| Arts, Media & Entertainment | 27 (40.9%) | 39 (59.1%) |
| Health Diagnosing & Treating | 14 (10.8%) | 115 (89.1%) |
| Health Technologists | 7 (25.0%) | 21 (75.0%) |
| Total (Category) | 224 (44.3%) | 282 (55.7%) |
| Total (Overall) | 873 (54.8%) | 721 (45.2%) |
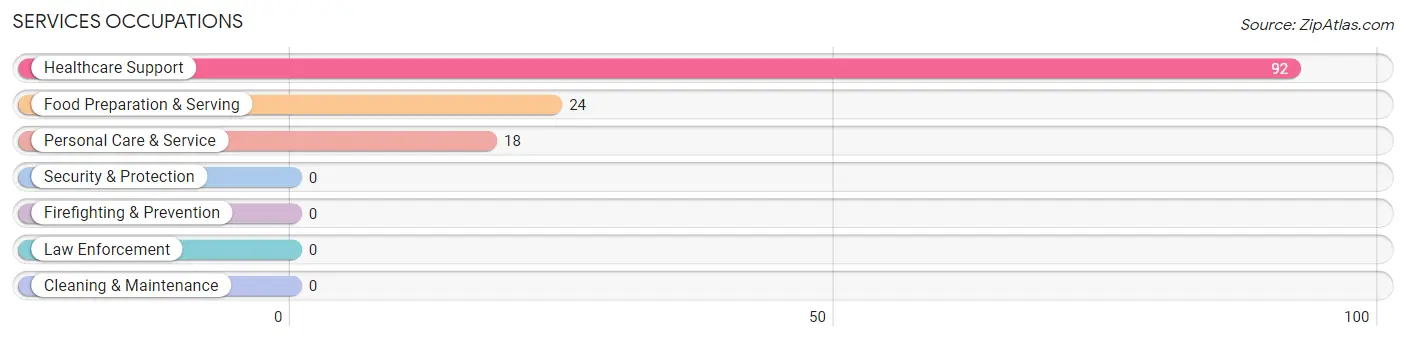
Services Occupations
The most common Services occupations in Tarpey Village are Healthcare Support (92 | 5.8%), Food Preparation & Serving (24 | 1.5%), and Personal Care & Service (18 | 1.1%).
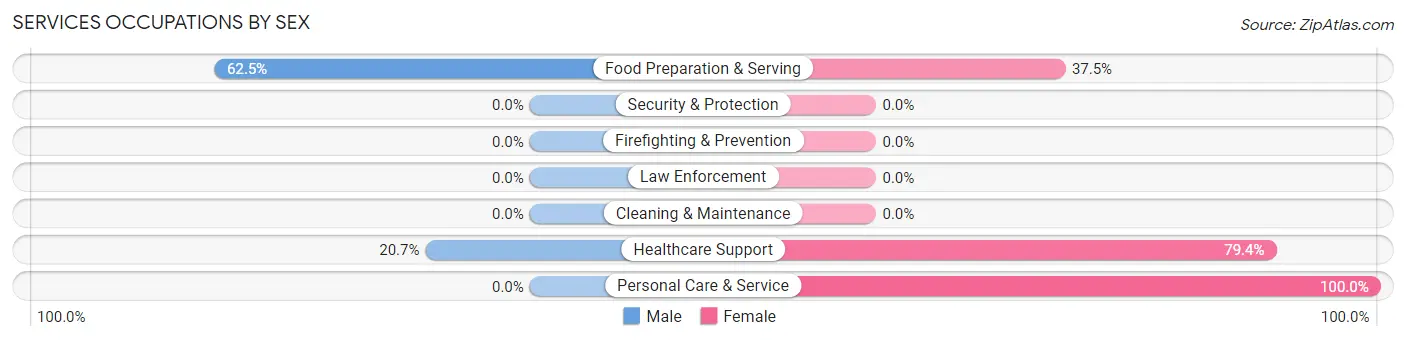
Services Occupations by Sex
Within the Services occupations in Tarpey Village, the most male-oriented occupations are Food Preparation & Serving (62.5%), and Healthcare Support (20.6%), while the most female-oriented occupations are Personal Care & Service (100.0%), Healthcare Support (79.3%), and Food Preparation & Serving (37.5%).
| Occupation | Male | Female |
| Healthcare Support | 19 (20.6%) | 73 (79.3%) |
| Security & Protection | 0 (0.0%) | 0 (0.0%) |
| Firefighting & Prevention | 0 (0.0%) | 0 (0.0%) |
| Law Enforcement | 0 (0.0%) | 0 (0.0%) |
| Food Preparation & Serving | 15 (62.5%) | 9 (37.5%) |
| Cleaning & Maintenance | 0 (0.0%) | 0 (0.0%) |
| Personal Care & Service | 0 (0.0%) | 18 (100.0%) |
| Total (Category) | 34 (25.4%) | 100 (74.6%) |
| Total (Overall) | 873 (54.8%) | 721 (45.2%) |
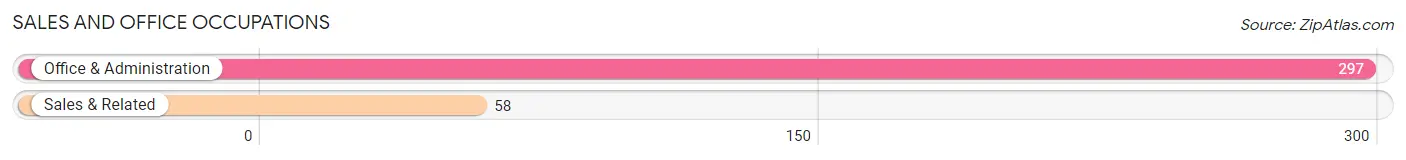
Sales and Office Occupations
The most common Sales and Office occupations in Tarpey Village are Office & Administration (297 | 18.6%), and Sales & Related (58 | 3.6%).
Sales and Office Occupations by Sex
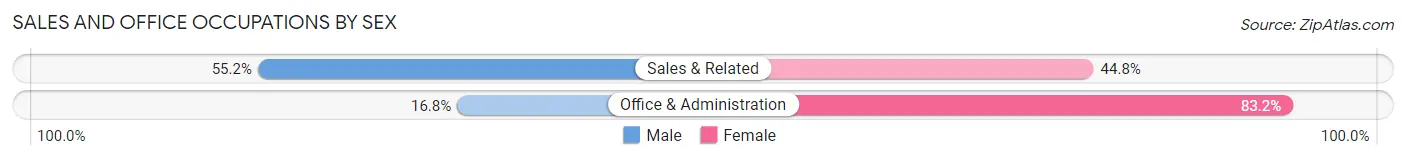
| Occupation | Male | Female |
| Sales & Related | 32 (55.2%) | 26 (44.8%) |
| Office & Administration | 50 (16.8%) | 247 (83.2%) |
| Total (Category) | 82 (23.1%) | 273 (76.9%) |
| Total (Overall) | 873 (54.8%) | 721 (45.2%) |
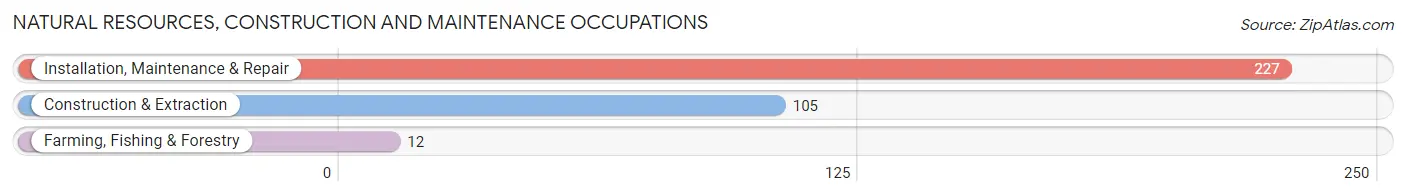
Natural Resources, Construction and Maintenance Occupations
The most common Natural Resources, Construction and Maintenance occupations in Tarpey Village are Installation, Maintenance & Repair (227 | 14.2%), Construction & Extraction (105 | 6.6%), and Farming, Fishing & Forestry (12 | 0.7%).
Natural Resources, Construction and Maintenance Occupations by Sex
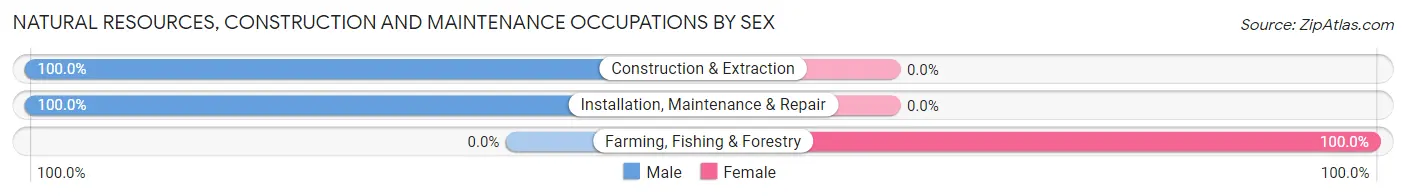
| Occupation | Male | Female |
| Farming, Fishing & Forestry | 0 (0.0%) | 12 (100.0%) |
| Construction & Extraction | 105 (100.0%) | 0 (0.0%) |
| Installation, Maintenance & Repair | 227 (100.0%) | 0 (0.0%) |
| Total (Category) | 332 (96.5%) | 12 (3.5%) |
| Total (Overall) | 873 (54.8%) | 721 (45.2%) |
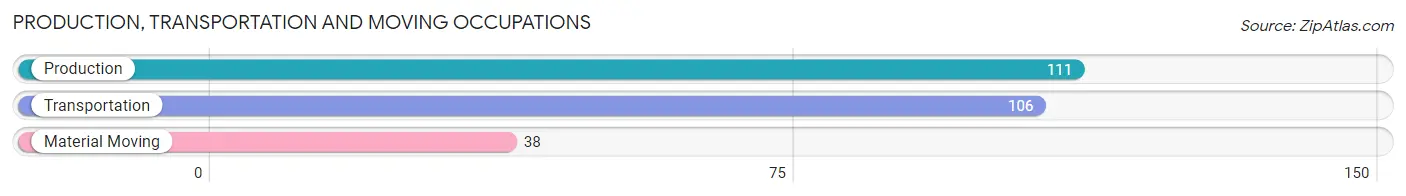
Production, Transportation and Moving Occupations
The most common Production, Transportation and Moving occupations in Tarpey Village are Production (111 | 7.0%), Transportation (106 | 6.7%), and Material Moving (38 | 2.4%).
Production, Transportation and Moving Occupations by Sex
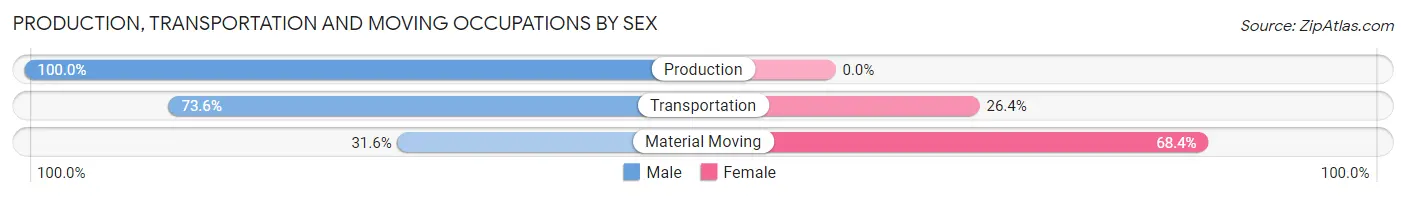
| Occupation | Male | Female |
| Production | 111 (100.0%) | 0 (0.0%) |
| Transportation | 78 (73.6%) | 28 (26.4%) |
| Material Moving | 12 (31.6%) | 26 (68.4%) |
| Total (Category) | 201 (78.8%) | 54 (21.2%) |
| Total (Overall) | 873 (54.8%) | 721 (45.2%) |
Employment Industries by Sex in Tarpey Village
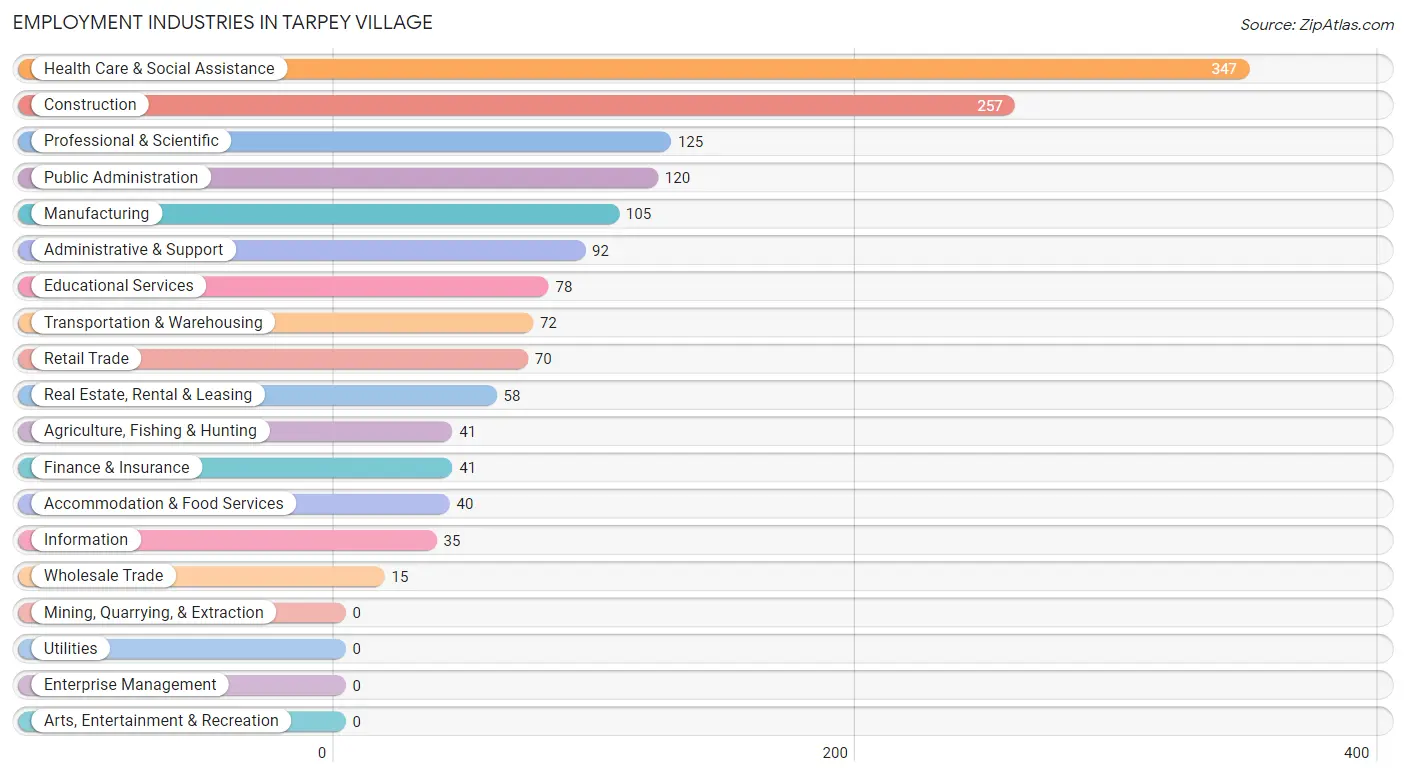
Employment Industries in Tarpey Village
The major employment industries in Tarpey Village include Health Care & Social Assistance (347 | 21.8%), Construction (257 | 16.1%), Professional & Scientific (125 | 7.8%), Public Administration (120 | 7.5%), and Manufacturing (105 | 6.6%).
Employment Industries by Sex in Tarpey Village
The Tarpey Village industries that see more men than women are Manufacturing (100.0%), Information (100.0%), and Construction (96.9%), whereas the industries that tend to have a higher number of women are Finance & Insurance (100.0%), Health Care & Social Assistance (85.3%), and Professional & Scientific (64.8%).
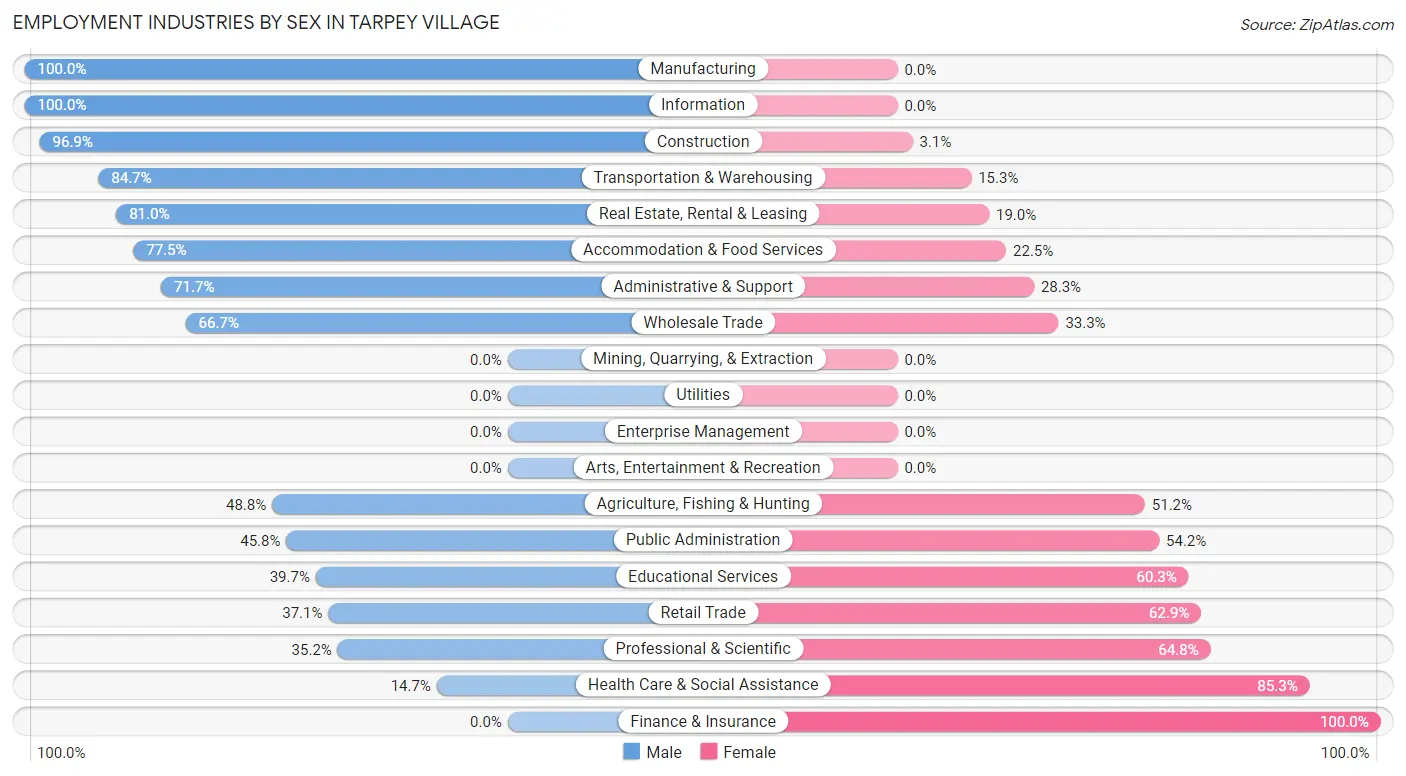
| Industry | Male | Female |
| Agriculture, Fishing & Hunting | 20 (48.8%) | 21 (51.2%) |
| Mining, Quarrying, & Extraction | 0 (0.0%) | 0 (0.0%) |
| Construction | 249 (96.9%) | 8 (3.1%) |
| Manufacturing | 105 (100.0%) | 0 (0.0%) |
| Wholesale Trade | 10 (66.7%) | 5 (33.3%) |
| Retail Trade | 26 (37.1%) | 44 (62.9%) |
| Transportation & Warehousing | 61 (84.7%) | 11 (15.3%) |
| Utilities | 0 (0.0%) | 0 (0.0%) |
| Information | 35 (100.0%) | 0 (0.0%) |
| Finance & Insurance | 0 (0.0%) | 41 (100.0%) |
| Real Estate, Rental & Leasing | 47 (81.0%) | 11 (19.0%) |
| Professional & Scientific | 44 (35.2%) | 81 (64.8%) |
| Enterprise Management | 0 (0.0%) | 0 (0.0%) |
| Administrative & Support | 66 (71.7%) | 26 (28.3%) |
| Educational Services | 31 (39.7%) | 47 (60.3%) |
| Health Care & Social Assistance | 51 (14.7%) | 296 (85.3%) |
| Arts, Entertainment & Recreation | 0 (0.0%) | 0 (0.0%) |
| Accommodation & Food Services | 31 (77.5%) | 9 (22.5%) |
| Public Administration | 55 (45.8%) | 65 (54.2%) |
| Total | 873 (54.8%) | 721 (45.2%) |
Education in Tarpey Village
School Enrollment in Tarpey Village
The most common levels of schooling among the 704 students in Tarpey Village are high school (215 | 30.5%), elementary school (190 | 27.0%), and middle school (143 | 20.3%).
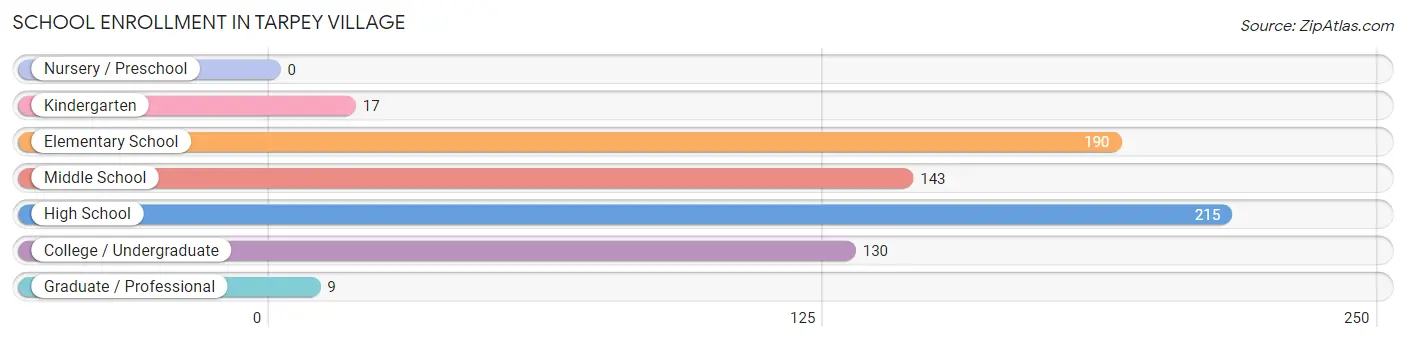
| School Level | # Students | % Students |
| Nursery / Preschool | 0 | 0.0% |
| Kindergarten | 17 | 2.4% |
| Elementary School | 190 | 27.0% |
| Middle School | 143 | 20.3% |
| High School | 215 | 30.5% |
| College / Undergraduate | 130 | 18.5% |
| Graduate / Professional | 9 | 1.3% |
| Total | 704 | 100.0% |
School Enrollment by Age by Funding Source in Tarpey Village
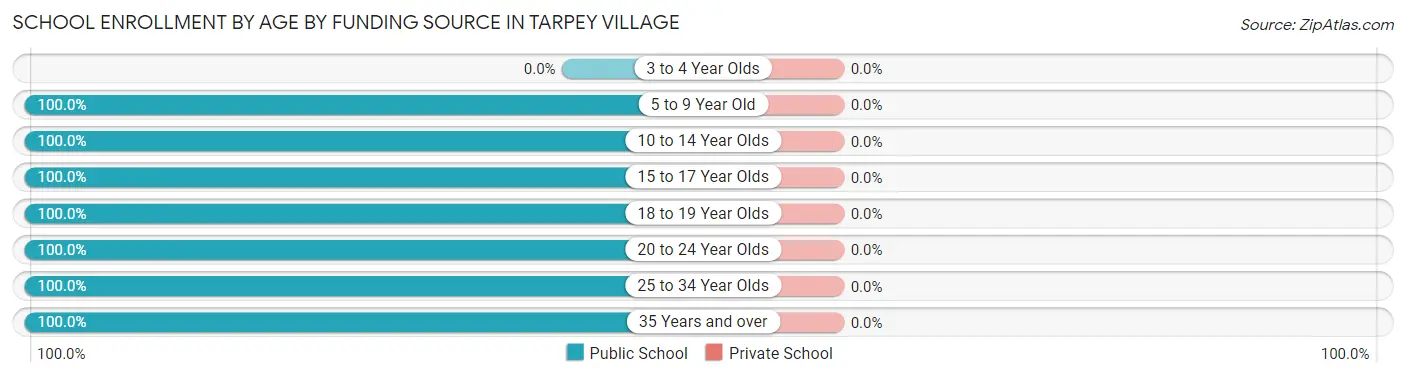
| Age Bracket | Public School | Private School |
| 3 to 4 Year Olds | 0 (0.0%) | 0 (0.0%) |
| 5 to 9 Year Old | 193 (100.0%) | 0 (0.0%) |
| 10 to 14 Year Olds | 169 (100.0%) | 0 (0.0%) |
| 15 to 17 Year Olds | 124 (100.0%) | 0 (0.0%) |
| 18 to 19 Year Olds | 109 (100.0%) | 0 (0.0%) |
| 20 to 24 Year Olds | 62 (100.0%) | 0 (0.0%) |
| 25 to 34 Year Olds | 31 (100.0%) | 0 (0.0%) |
| 35 Years and over | 16 (100.0%) | 0 (0.0%) |
| Total | 704 (100.0%) | 0 (0.0%) |
Educational Attainment by Field of Study in Tarpey Village
Bio, nature & agricultural (52 | 13.3%), psychology (51 | 13.0%), arts & humanities (51 | 13.0%), business (46 | 11.7%), and social sciences (35 | 8.9%) are the most common fields of study among 392 individuals in Tarpey Village who have obtained a bachelor's degree or higher.
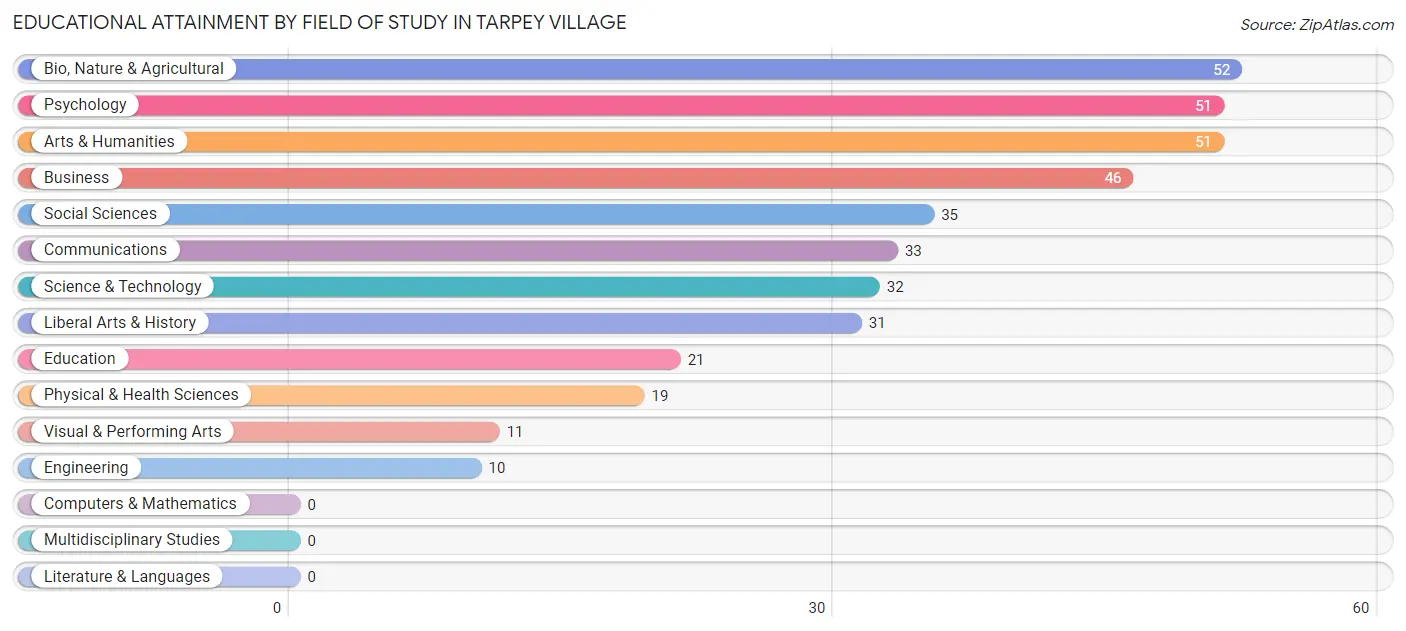
| Field of Study | # Graduates | % Graduates |
| Computers & Mathematics | 0 | 0.0% |
| Bio, Nature & Agricultural | 52 | 13.3% |
| Physical & Health Sciences | 19 | 4.9% |
| Psychology | 51 | 13.0% |
| Social Sciences | 35 | 8.9% |
| Engineering | 10 | 2.5% |
| Multidisciplinary Studies | 0 | 0.0% |
| Science & Technology | 32 | 8.2% |
| Business | 46 | 11.7% |
| Education | 21 | 5.4% |
| Literature & Languages | 0 | 0.0% |
| Liberal Arts & History | 31 | 7.9% |
| Visual & Performing Arts | 11 | 2.8% |
| Communications | 33 | 8.4% |
| Arts & Humanities | 51 | 13.0% |
| Total | 392 | 100.0% |
Transportation & Commute in Tarpey Village
Vehicle Availability by Sex in Tarpey Village
The most prevalent vehicle ownership categories in Tarpey Village are males with 2 vehicles (395, accounting for 46.0%) and females with 2 vehicles (242, making up 57.8%).
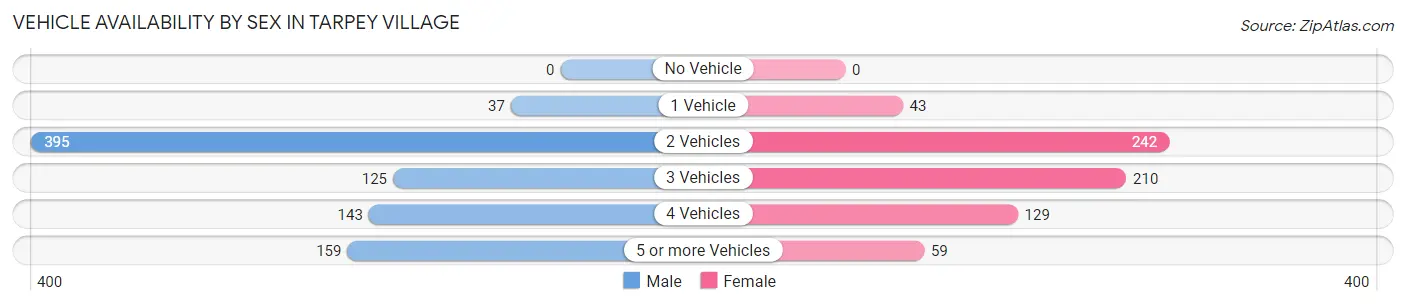
| Vehicles Available | Male | Female |
| No Vehicle | 0 (0.0%) | 0 (0.0%) |
| 1 Vehicle | 37 (4.3%) | 43 (6.3%) |
| 2 Vehicles | 395 (46.0%) | 242 (35.4%) |
| 3 Vehicles | 125 (14.5%) | 210 (30.7%) |
| 4 Vehicles | 143 (16.7%) | 129 (18.9%) |
| 5 or more Vehicles | 159 (18.5%) | 59 (8.6%) |
| Total | 859 (100.0%) | 683 (100.0%) |
Commute Time in Tarpey Village
The most frequently occuring commute durations in Tarpey Village are 15 to 19 minutes (499 commuters, 35.9%), 10 to 14 minutes (200 commuters, 14.4%), and 20 to 24 minutes (177 commuters, 12.7%).
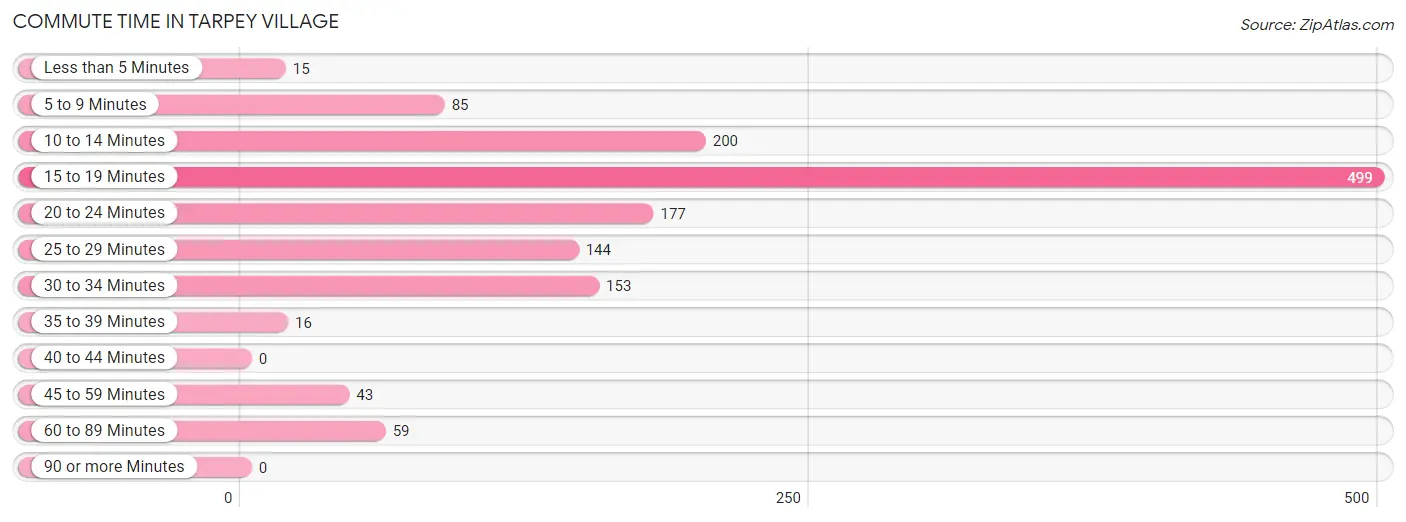
| Commute Time | # Commuters | % Commuters |
| Less than 5 Minutes | 15 | 1.1% |
| 5 to 9 Minutes | 85 | 6.1% |
| 10 to 14 Minutes | 200 | 14.4% |
| 15 to 19 Minutes | 499 | 35.9% |
| 20 to 24 Minutes | 177 | 12.7% |
| 25 to 29 Minutes | 144 | 10.3% |
| 30 to 34 Minutes | 153 | 11.0% |
| 35 to 39 Minutes | 16 | 1.1% |
| 40 to 44 Minutes | 0 | 0.0% |
| 45 to 59 Minutes | 43 | 3.1% |
| 60 to 89 Minutes | 59 | 4.2% |
| 90 or more Minutes | 0 | 0.0% |
Commute Time by Sex in Tarpey Village
The most common commute times in Tarpey Village are 15 to 19 minutes (265 commuters, 35.4%) for males and 15 to 19 minutes (234 commuters, 36.4%) for females.
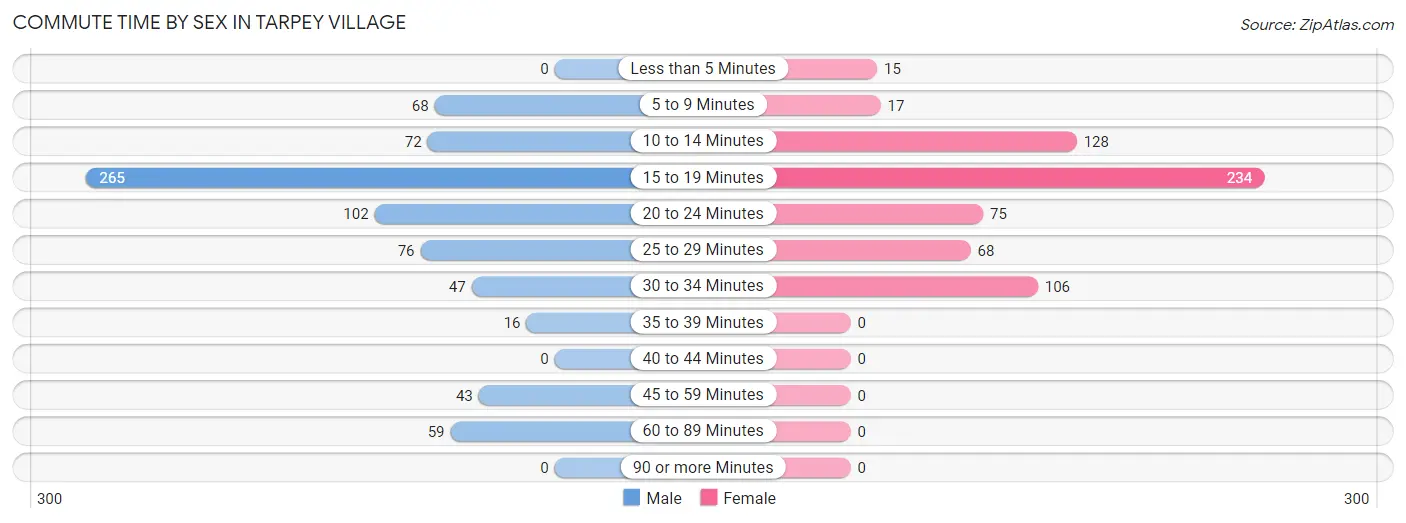
| Commute Time | Male | Female |
| Less than 5 Minutes | 0 (0.0%) | 15 (2.3%) |
| 5 to 9 Minutes | 68 (9.1%) | 17 (2.6%) |
| 10 to 14 Minutes | 72 (9.6%) | 128 (19.9%) |
| 15 to 19 Minutes | 265 (35.4%) | 234 (36.4%) |
| 20 to 24 Minutes | 102 (13.6%) | 75 (11.7%) |
| 25 to 29 Minutes | 76 (10.2%) | 68 (10.6%) |
| 30 to 34 Minutes | 47 (6.3%) | 106 (16.5%) |
| 35 to 39 Minutes | 16 (2.1%) | 0 (0.0%) |
| 40 to 44 Minutes | 0 (0.0%) | 0 (0.0%) |
| 45 to 59 Minutes | 43 (5.8%) | 0 (0.0%) |
| 60 to 89 Minutes | 59 (7.9%) | 0 (0.0%) |
| 90 or more Minutes | 0 (0.0%) | 0 (0.0%) |
Time of Departure to Work by Sex in Tarpey Village
The most frequent times of departure to work in Tarpey Village are 7:30 AM to 7:59 AM (142, 19.0%) for males and 4:00 PM to 11:59 PM (105, 16.3%) for females.
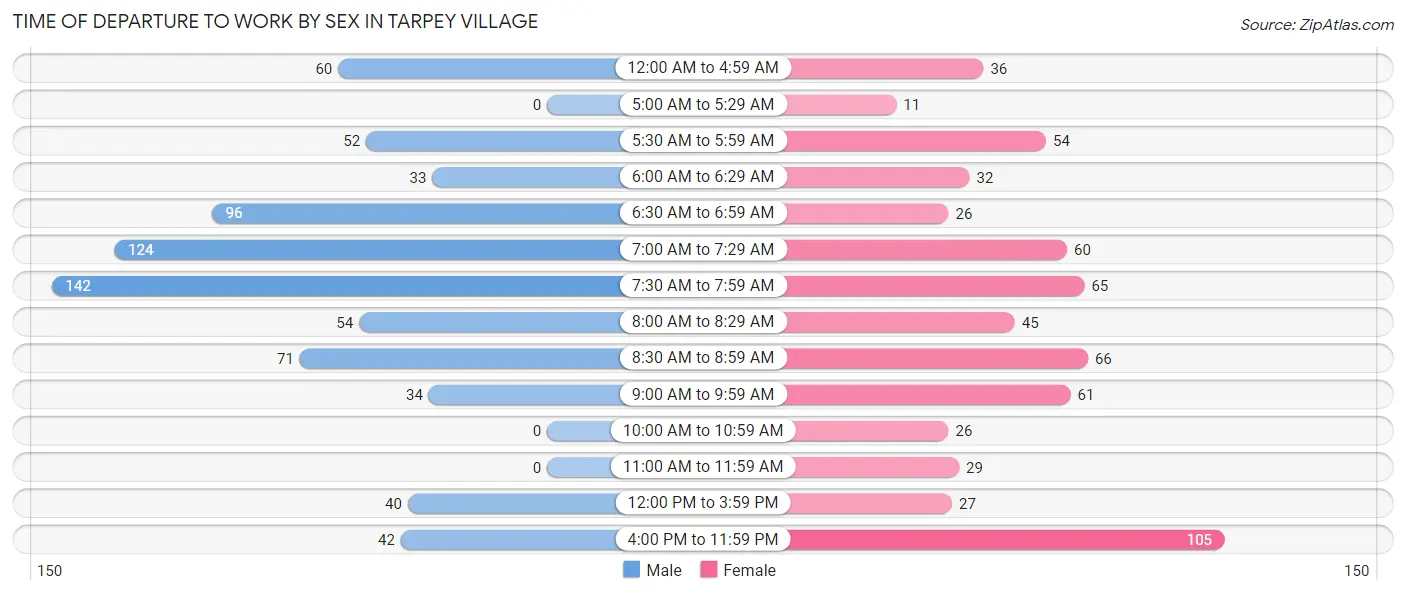
| Time of Departure | Male | Female |
| 12:00 AM to 4:59 AM | 60 (8.0%) | 36 (5.6%) |
| 5:00 AM to 5:29 AM | 0 (0.0%) | 11 (1.7%) |
| 5:30 AM to 5:59 AM | 52 (7.0%) | 54 (8.4%) |
| 6:00 AM to 6:29 AM | 33 (4.4%) | 32 (5.0%) |
| 6:30 AM to 6:59 AM | 96 (12.8%) | 26 (4.0%) |
| 7:00 AM to 7:29 AM | 124 (16.6%) | 60 (9.3%) |
| 7:30 AM to 7:59 AM | 142 (19.0%) | 65 (10.1%) |
| 8:00 AM to 8:29 AM | 54 (7.2%) | 45 (7.0%) |
| 8:30 AM to 8:59 AM | 71 (9.5%) | 66 (10.3%) |
| 9:00 AM to 9:59 AM | 34 (4.5%) | 61 (9.5%) |
| 10:00 AM to 10:59 AM | 0 (0.0%) | 26 (4.0%) |
| 11:00 AM to 11:59 AM | 0 (0.0%) | 29 (4.5%) |
| 12:00 PM to 3:59 PM | 40 (5.3%) | 27 (4.2%) |
| 4:00 PM to 11:59 PM | 42 (5.6%) | 105 (16.3%) |
| Total | 748 (100.0%) | 643 (100.0%) |
Housing Occupancy in Tarpey Village
Occupancy by Ownership in Tarpey Village
Of the total 1,295 dwellings in Tarpey Village, owner-occupied units account for 1,080 (83.4%), while renter-occupied units make up 215 (16.6%).
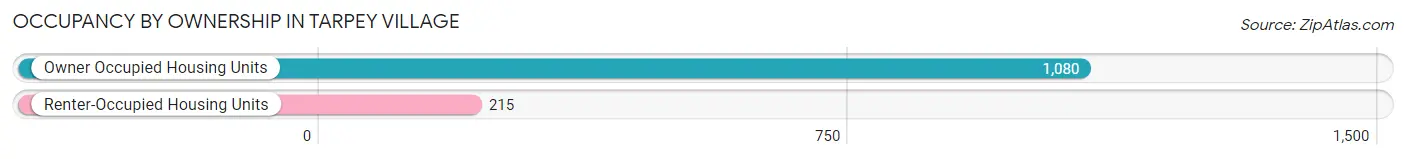
| Occupancy | # Housing Units | % Housing Units |
| Owner Occupied Housing Units | 1,080 | 83.4% |
| Renter-Occupied Housing Units | 215 | 16.6% |
| Total Occupied Housing Units | 1,295 | 100.0% |
Occupancy by Household Size in Tarpey Village
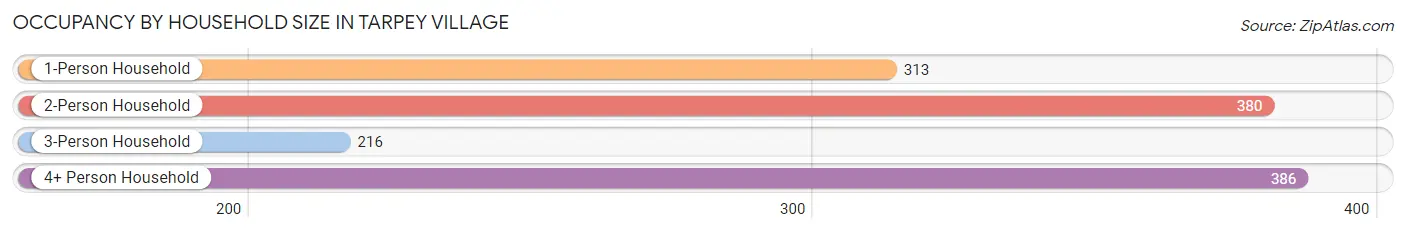
| Household Size | # Housing Units | % Housing Units |
| 1-Person Household | 313 | 24.2% |
| 2-Person Household | 380 | 29.3% |
| 3-Person Household | 216 | 16.7% |
| 4+ Person Household | 386 | 29.8% |
| Total Housing Units | 1,295 | 100.0% |
Occupancy by Ownership by Household Size in Tarpey Village
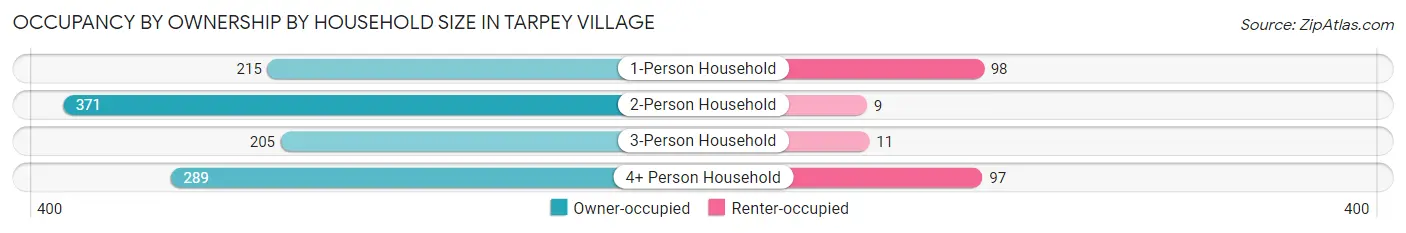
| Household Size | Owner-occupied | Renter-occupied |
| 1-Person Household | 215 (68.7%) | 98 (31.3%) |
| 2-Person Household | 371 (97.6%) | 9 (2.4%) |
| 3-Person Household | 205 (94.9%) | 11 (5.1%) |
| 4+ Person Household | 289 (74.9%) | 97 (25.1%) |
| Total Housing Units | 1,080 (83.4%) | 215 (16.6%) |
Occupancy by Educational Attainment in Tarpey Village
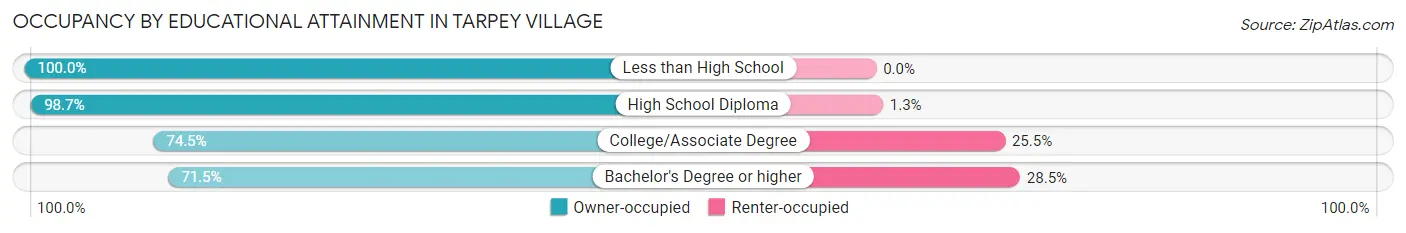
| Household Size | Owner-occupied | Renter-occupied |
| Less than High School | 117 (100.0%) | 0 (0.0%) |
| High School Diploma | 374 (98.7%) | 5 (1.3%) |
| College/Associate Degree | 446 (74.5%) | 153 (25.5%) |
| Bachelor's Degree or higher | 143 (71.5%) | 57 (28.5%) |
Occupancy by Age of Householder in Tarpey Village
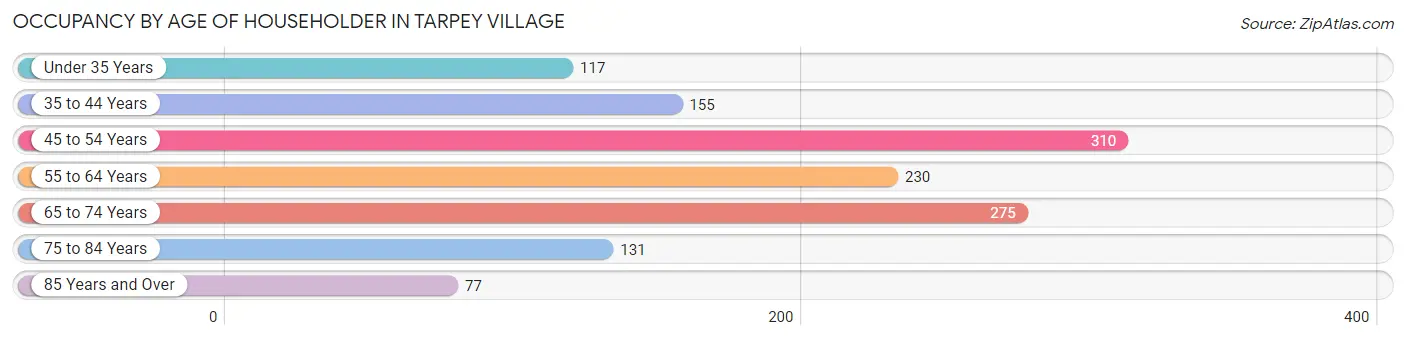
| Age Bracket | # Households | % Households |
| Under 35 Years | 117 | 9.0% |
| 35 to 44 Years | 155 | 12.0% |
| 45 to 54 Years | 310 | 23.9% |
| 55 to 64 Years | 230 | 17.8% |
| 65 to 74 Years | 275 | 21.2% |
| 75 to 84 Years | 131 | 10.1% |
| 85 Years and Over | 77 | 5.9% |
| Total | 1,295 | 100.0% |
Housing Finances in Tarpey Village
Median Income by Occupancy in Tarpey Village
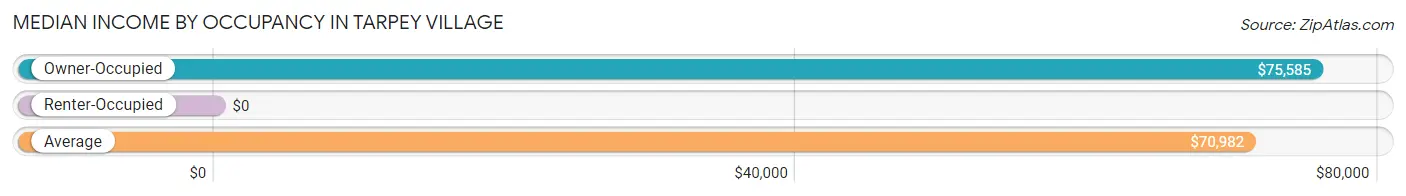
| Occupancy Type | # Households | Median Income |
| Owner-Occupied | 1,080 (83.4%) | $75,585 |
| Renter-Occupied | 215 (16.6%) | $0 |
| Average | 1,295 (100.0%) | $70,982 |
Occupancy by Householder Income Bracket in Tarpey Village
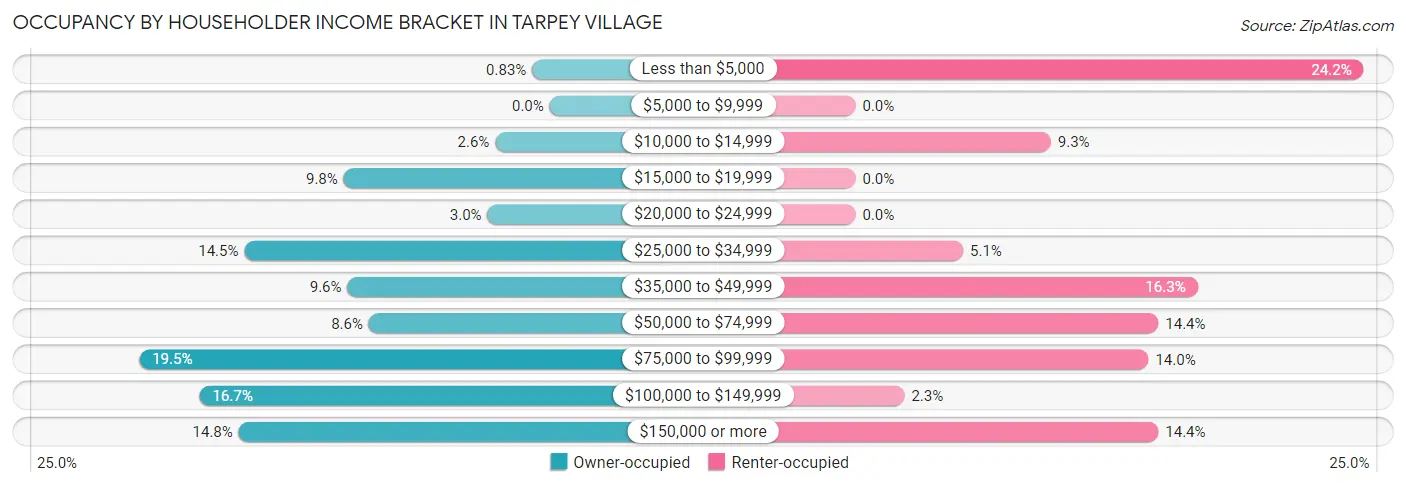
| Income Bracket | Owner-occupied | Renter-occupied |
| Less than $5,000 | 9 (0.8%) | 52 (24.2%) |
| $5,000 to $9,999 | 0 (0.0%) | 0 (0.0%) |
| $10,000 to $14,999 | 28 (2.6%) | 20 (9.3%) |
| $15,000 to $19,999 | 106 (9.8%) | 0 (0.0%) |
| $20,000 to $24,999 | 32 (3.0%) | 0 (0.0%) |
| $25,000 to $34,999 | 157 (14.5%) | 11 (5.1%) |
| $35,000 to $49,999 | 104 (9.6%) | 35 (16.3%) |
| $50,000 to $74,999 | 93 (8.6%) | 31 (14.4%) |
| $75,000 to $99,999 | 211 (19.5%) | 30 (14.0%) |
| $100,000 to $149,999 | 180 (16.7%) | 5 (2.3%) |
| $150,000 or more | 160 (14.8%) | 31 (14.4%) |
| Total | 1,080 (100.0%) | 215 (100.0%) |
Monthly Housing Cost Tiers in Tarpey Village
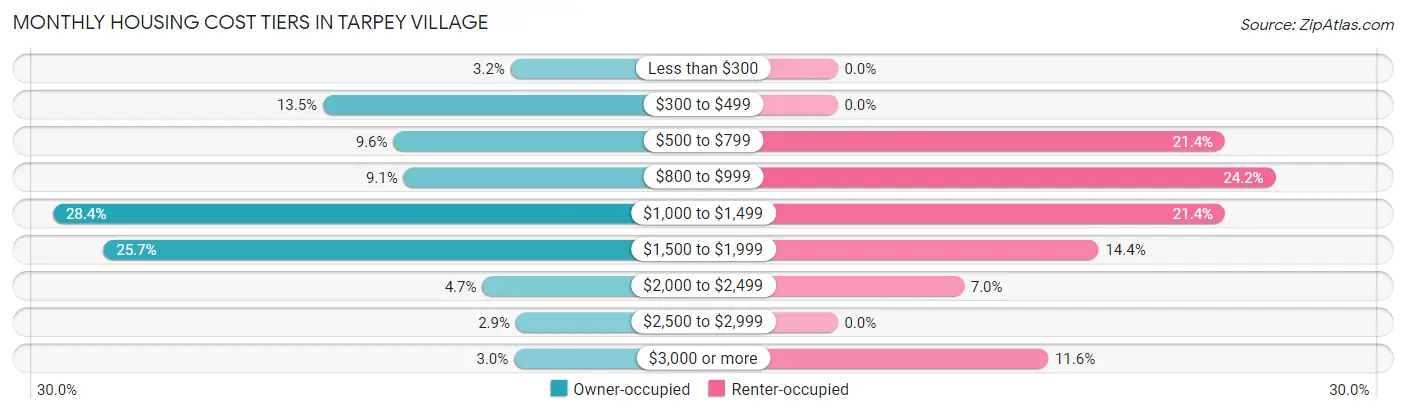
| Monthly Cost | Owner-occupied | Renter-occupied |
| Less than $300 | 34 (3.2%) | 0 (0.0%) |
| $300 to $499 | 146 (13.5%) | 0 (0.0%) |
| $500 to $799 | 104 (9.6%) | 46 (21.4%) |
| $800 to $999 | 98 (9.1%) | 52 (24.2%) |
| $1,000 to $1,499 | 307 (28.4%) | 46 (21.4%) |
| $1,500 to $1,999 | 277 (25.7%) | 31 (14.4%) |
| $2,000 to $2,499 | 51 (4.7%) | 15 (7.0%) |
| $2,500 to $2,999 | 31 (2.9%) | 0 (0.0%) |
| $3,000 or more | 32 (3.0%) | 25 (11.6%) |
| Total | 1,080 (100.0%) | 215 (100.0%) |
Physical Housing Characteristics in Tarpey Village
Housing Structures in Tarpey Village
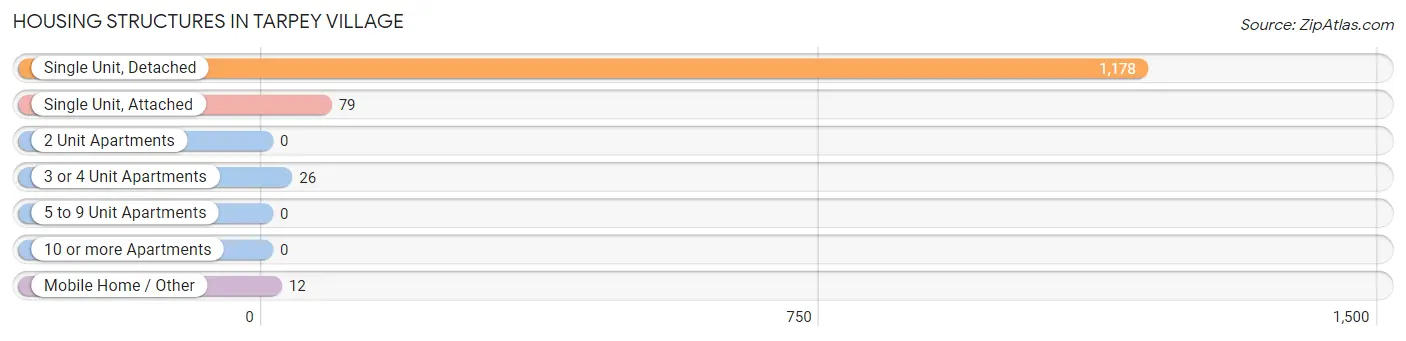
| Structure Type | # Housing Units | % Housing Units |
| Single Unit, Detached | 1,178 | 91.0% |
| Single Unit, Attached | 79 | 6.1% |
| 2 Unit Apartments | 0 | 0.0% |
| 3 or 4 Unit Apartments | 26 | 2.0% |
| 5 to 9 Unit Apartments | 0 | 0.0% |
| 10 or more Apartments | 0 | 0.0% |
| Mobile Home / Other | 12 | 0.9% |
| Total | 1,295 | 100.0% |
Housing Structures by Occupancy in Tarpey Village
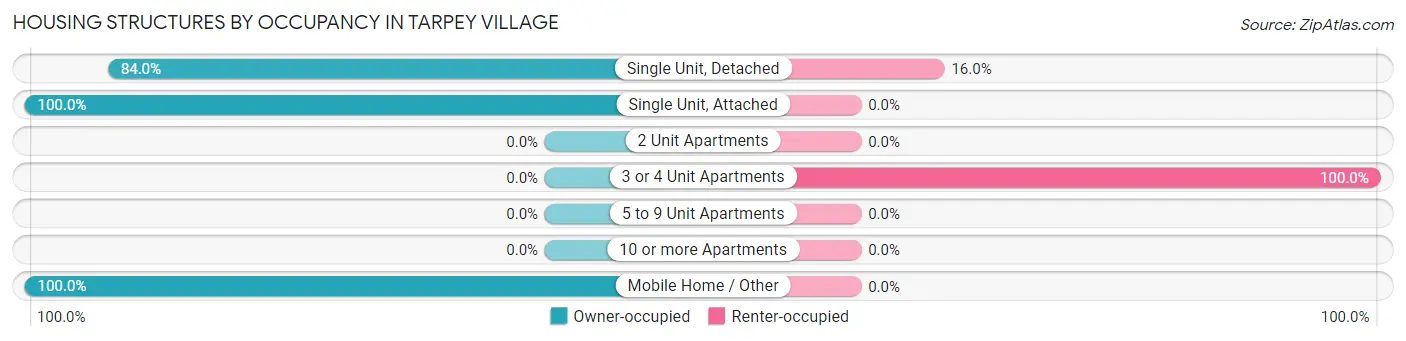
| Structure Type | Owner-occupied | Renter-occupied |
| Single Unit, Detached | 989 (84.0%) | 189 (16.0%) |
| Single Unit, Attached | 79 (100.0%) | 0 (0.0%) |
| 2 Unit Apartments | 0 (0.0%) | 0 (0.0%) |
| 3 or 4 Unit Apartments | 0 (0.0%) | 26 (100.0%) |
| 5 to 9 Unit Apartments | 0 (0.0%) | 0 (0.0%) |
| 10 or more Apartments | 0 (0.0%) | 0 (0.0%) |
| Mobile Home / Other | 12 (100.0%) | 0 (0.0%) |
| Total | 1,080 (83.4%) | 215 (16.6%) |
Housing Structures by Number of Rooms in Tarpey Village
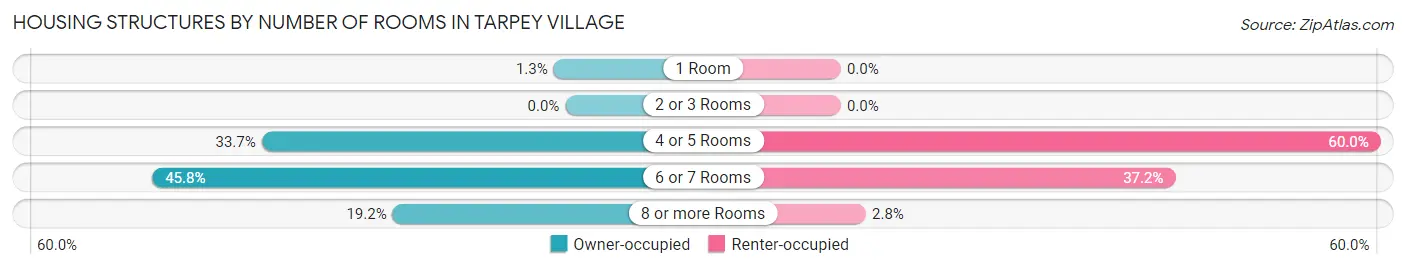
| Number of Rooms | Owner-occupied | Renter-occupied |
| 1 Room | 14 (1.3%) | 0 (0.0%) |
| 2 or 3 Rooms | 0 (0.0%) | 0 (0.0%) |
| 4 or 5 Rooms | 364 (33.7%) | 129 (60.0%) |
| 6 or 7 Rooms | 495 (45.8%) | 80 (37.2%) |
| 8 or more Rooms | 207 (19.2%) | 6 (2.8%) |
| Total | 1,080 (100.0%) | 215 (100.0%) |
Housing Structure by Heating Type in Tarpey Village
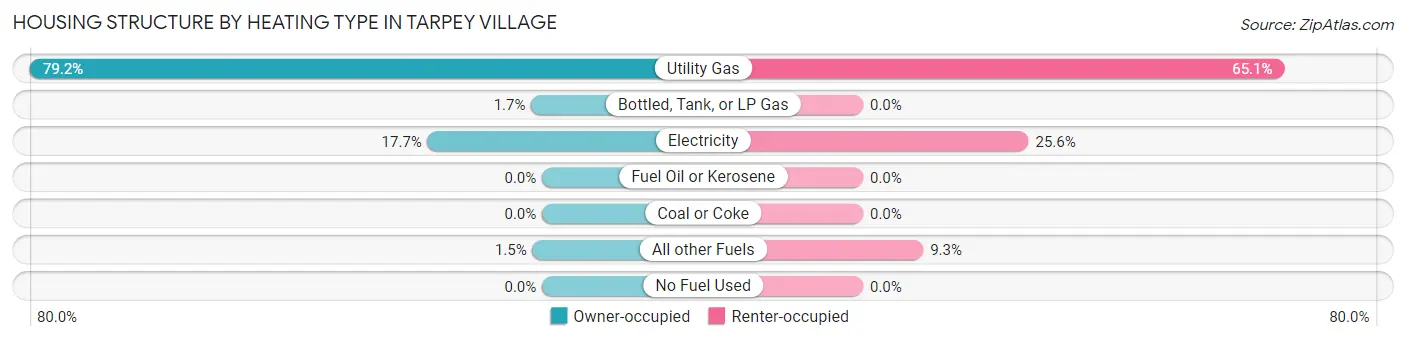
| Heating Type | Owner-occupied | Renter-occupied |
| Utility Gas | 855 (79.2%) | 140 (65.1%) |
| Bottled, Tank, or LP Gas | 18 (1.7%) | 0 (0.0%) |
| Electricity | 191 (17.7%) | 55 (25.6%) |
| Fuel Oil or Kerosene | 0 (0.0%) | 0 (0.0%) |
| Coal or Coke | 0 (0.0%) | 0 (0.0%) |
| All other Fuels | 16 (1.5%) | 20 (9.3%) |
| No Fuel Used | 0 (0.0%) | 0 (0.0%) |
| Total | 1,080 (100.0%) | 215 (100.0%) |
Household Vehicle Usage in Tarpey Village
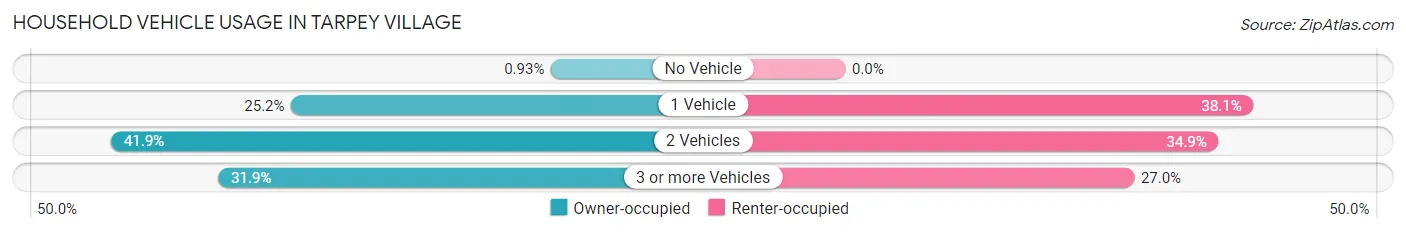
| Vehicles per Household | Owner-occupied | Renter-occupied |
| No Vehicle | 10 (0.9%) | 0 (0.0%) |
| 1 Vehicle | 272 (25.2%) | 82 (38.1%) |
| 2 Vehicles | 453 (41.9%) | 75 (34.9%) |
| 3 or more Vehicles | 345 (31.9%) | 58 (27.0%) |
| Total | 1,080 (100.0%) | 215 (100.0%) |
Real Estate & Mortgages in Tarpey Village
Real Estate and Mortgage Overview in Tarpey Village
| Characteristic | Without Mortgage | With Mortgage |
| Housing Units | 269 | 811 |
| Median Property Value | $280,900 | $322,600 |
| Median Household Income | $46,875 | $143 |
| Monthly Housing Costs | $437 | $32 |
| Real Estate Taxes | $1,504 | $9 |
Property Value by Mortgage Status in Tarpey Village
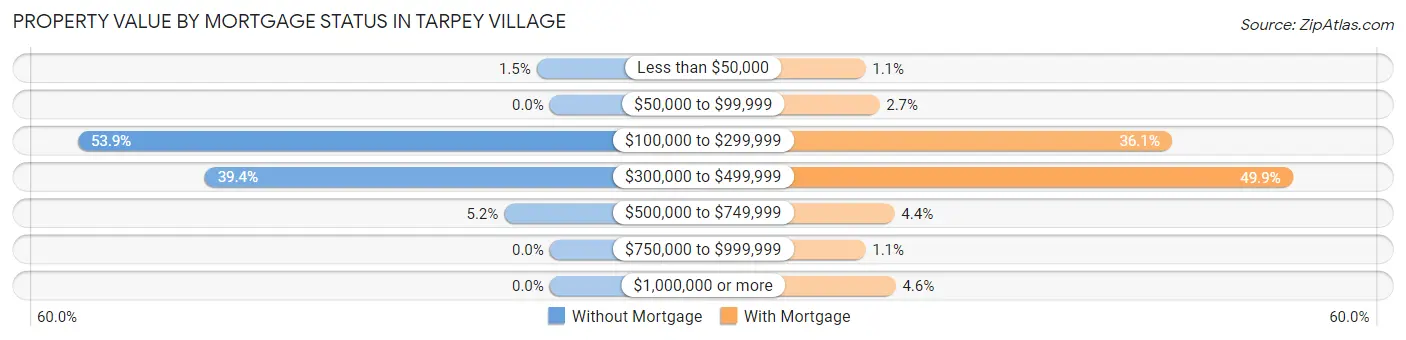
| Property Value | Without Mortgage | With Mortgage |
| Less than $50,000 | 4 (1.5%) | 9 (1.1%) |
| $50,000 to $99,999 | 0 (0.0%) | 22 (2.7%) |
| $100,000 to $299,999 | 145 (53.9%) | 293 (36.1%) |
| $300,000 to $499,999 | 106 (39.4%) | 405 (49.9%) |
| $500,000 to $749,999 | 14 (5.2%) | 36 (4.4%) |
| $750,000 to $999,999 | 0 (0.0%) | 9 (1.1%) |
| $1,000,000 or more | 0 (0.0%) | 37 (4.6%) |
| Total | 269 (100.0%) | 811 (100.0%) |
Household Income by Mortgage Status in Tarpey Village
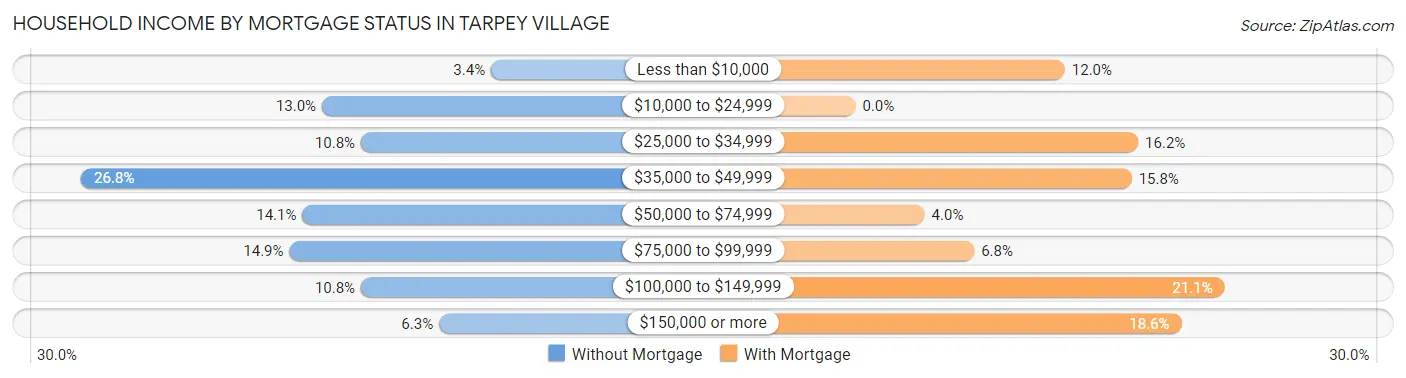
| Household Income | Without Mortgage | With Mortgage |
| Less than $10,000 | 9 (3.4%) | 97 (12.0%) |
| $10,000 to $24,999 | 35 (13.0%) | 0 (0.0%) |
| $25,000 to $34,999 | 29 (10.8%) | 131 (16.2%) |
| $35,000 to $49,999 | 72 (26.8%) | 128 (15.8%) |
| $50,000 to $74,999 | 38 (14.1%) | 32 (4.0%) |
| $75,000 to $99,999 | 40 (14.9%) | 55 (6.8%) |
| $100,000 to $149,999 | 29 (10.8%) | 171 (21.1%) |
| $150,000 or more | 17 (6.3%) | 151 (18.6%) |
| Total | 269 (100.0%) | 811 (100.0%) |
Property Value to Household Income Ratio in Tarpey Village
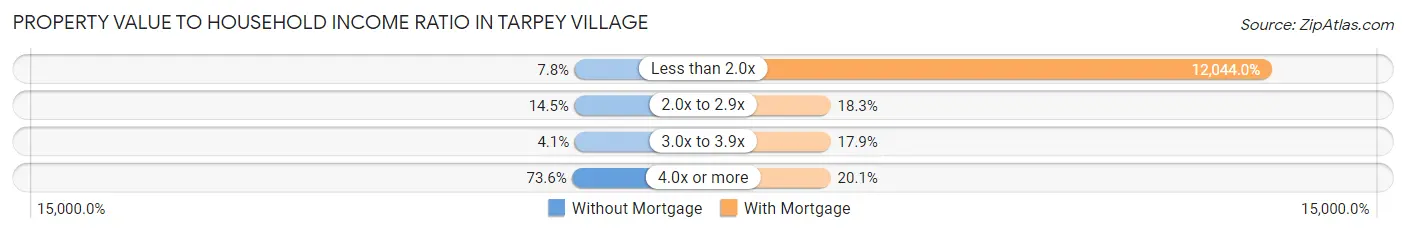
| Value-to-Income Ratio | Without Mortgage | With Mortgage |
| Less than 2.0x | 21 (7.8%) | 97,677 (12,044.0%) |
| 2.0x to 2.9x | 39 (14.5%) | 148 (18.2%) |
| 3.0x to 3.9x | 11 (4.1%) | 145 (17.9%) |
| 4.0x or more | 198 (73.6%) | 163 (20.1%) |
| Total | 269 (100.0%) | 811 (100.0%) |
Real Estate Taxes by Mortgage Status in Tarpey Village
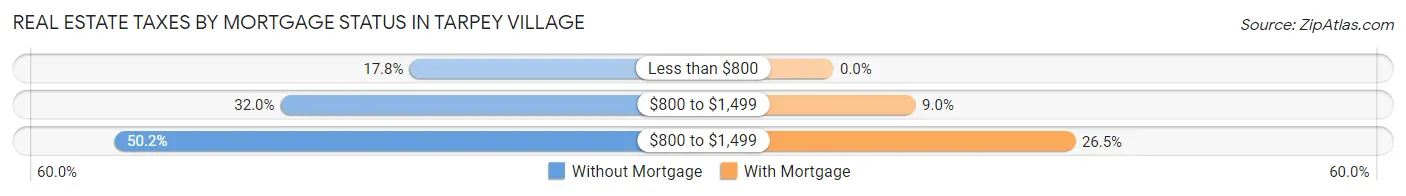
| Property Taxes | Without Mortgage | With Mortgage |
| Less than $800 | 48 (17.8%) | 0 (0.0%) |
| $800 to $1,499 | 86 (32.0%) | 73 (9.0%) |
| $800 to $1,499 | 135 (50.2%) | 215 (26.5%) |
| Total | 269 (100.0%) | 811 (100.0%) |
Health & Disability in Tarpey Village
Health Insurance Coverage by Age in Tarpey Village
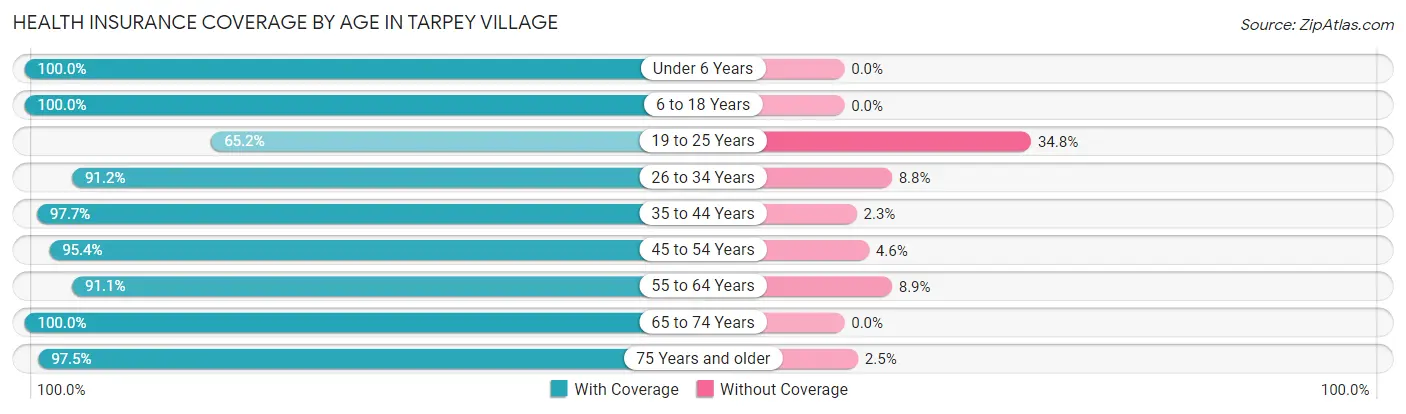
| Age Bracket | With Coverage | Without Coverage |
| Under 6 Years | 249 (100.0%) | 0 (0.0%) |
| 6 to 18 Years | 609 (100.0%) | 0 (0.0%) |
| 19 to 25 Years | 176 (65.2%) | 94 (34.8%) |
| 26 to 34 Years | 361 (91.2%) | 35 (8.8%) |
| 35 to 44 Years | 468 (97.7%) | 11 (2.3%) |
| 45 to 54 Years | 457 (95.4%) | 22 (4.6%) |
| 55 to 64 Years | 494 (91.1%) | 48 (8.9%) |
| 65 to 74 Years | 407 (100.0%) | 0 (0.0%) |
| 75 Years and older | 307 (97.5%) | 8 (2.5%) |
| Total | 3,528 (94.2%) | 218 (5.8%) |
Health Insurance Coverage by Citizenship Status in Tarpey Village
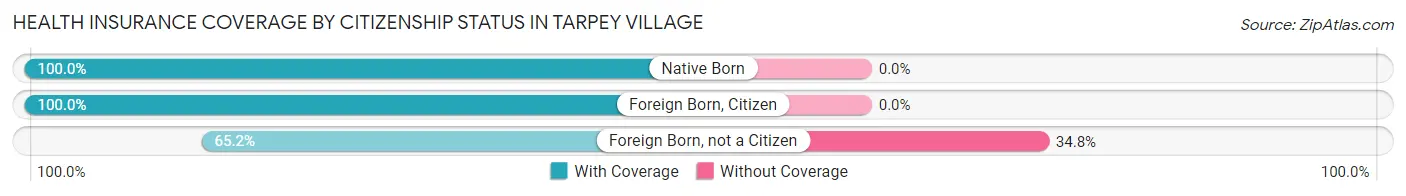
| Citizenship Status | With Coverage | Without Coverage |
| Native Born | 249 (100.0%) | 0 (0.0%) |
| Foreign Born, Citizen | 609 (100.0%) | 0 (0.0%) |
| Foreign Born, not a Citizen | 176 (65.2%) | 94 (34.8%) |
Health Insurance Coverage by Household Income in Tarpey Village
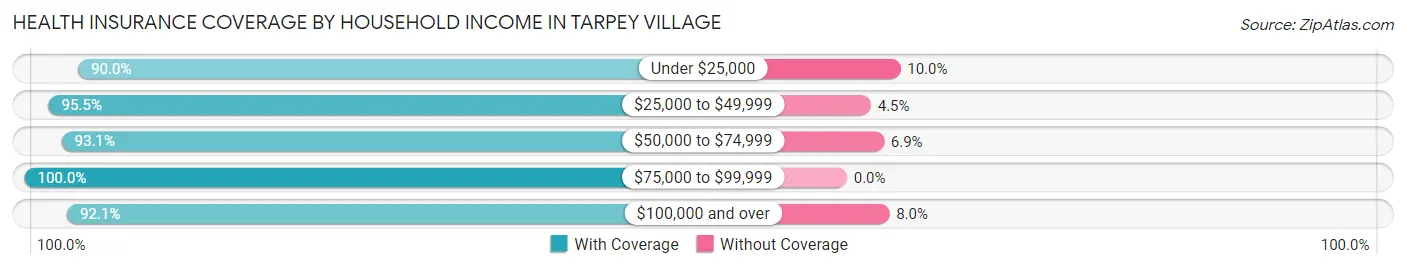
| Household Income | With Coverage | Without Coverage |
| Under $25,000 | 305 (90.0%) | 34 (10.0%) |
| $25,000 to $49,999 | 870 (95.5%) | 41 (4.5%) |
| $50,000 to $74,999 | 402 (93.1%) | 30 (6.9%) |
| $75,000 to $99,999 | 742 (100.0%) | 0 (0.0%) |
| $100,000 and over | 1,204 (92.0%) | 104 (8.0%) |
Public vs Private Health Insurance Coverage by Age in Tarpey Village
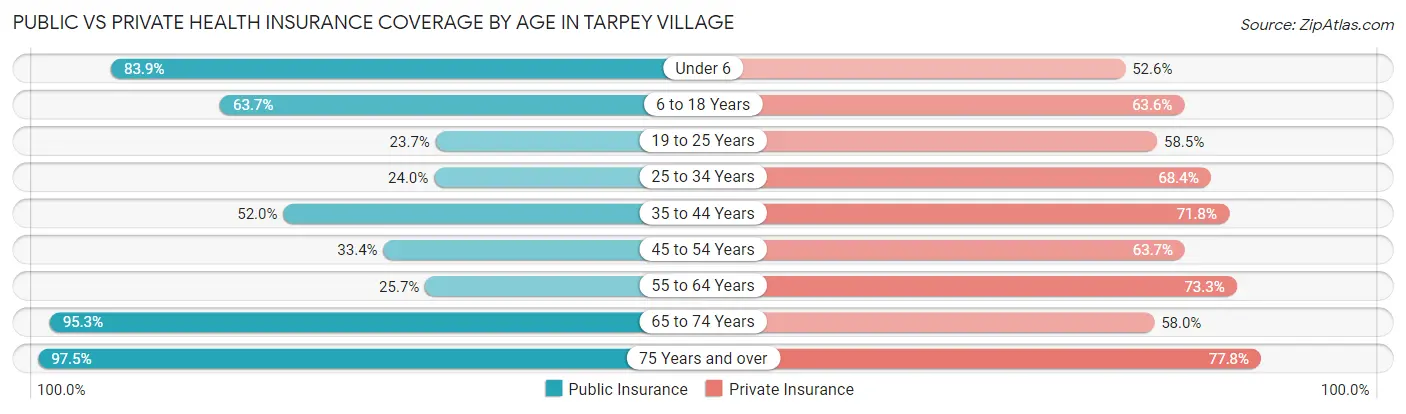
| Age Bracket | Public Insurance | Private Insurance |
| Under 6 | 209 (83.9%) | 131 (52.6%) |
| 6 to 18 Years | 388 (63.7%) | 387 (63.5%) |
| 19 to 25 Years | 64 (23.7%) | 158 (58.5%) |
| 25 to 34 Years | 95 (24.0%) | 271 (68.4%) |
| 35 to 44 Years | 249 (52.0%) | 344 (71.8%) |
| 45 to 54 Years | 160 (33.4%) | 305 (63.7%) |
| 55 to 64 Years | 139 (25.7%) | 397 (73.3%) |
| 65 to 74 Years | 388 (95.3%) | 236 (58.0%) |
| 75 Years and over | 307 (97.5%) | 245 (77.8%) |
| Total | 1,999 (53.4%) | 2,474 (66.0%) |
Disability Status by Sex by Age in Tarpey Village
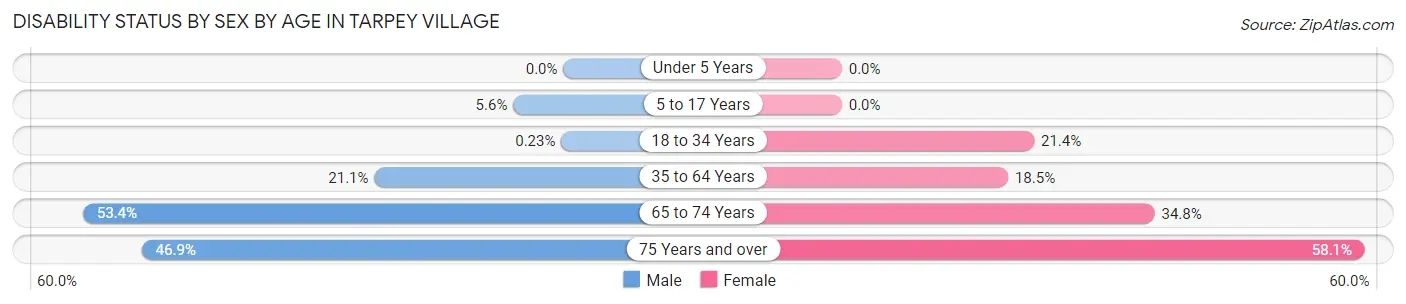
| Age Bracket | Male | Female |
| Under 5 Years | 0 (0.0%) | 0 (0.0%) |
| 5 to 17 Years | 12 (5.6%) | 0 (0.0%) |
| 18 to 34 Years | 1 (0.2%) | 73 (21.4%) |
| 35 to 64 Years | 177 (21.0%) | 122 (18.5%) |
| 65 to 74 Years | 110 (53.4%) | 70 (34.8%) |
| 75 Years and over | 67 (46.9%) | 100 (58.1%) |
Disability Class by Sex by Age in Tarpey Village
Disability Class: Hearing Difficulty
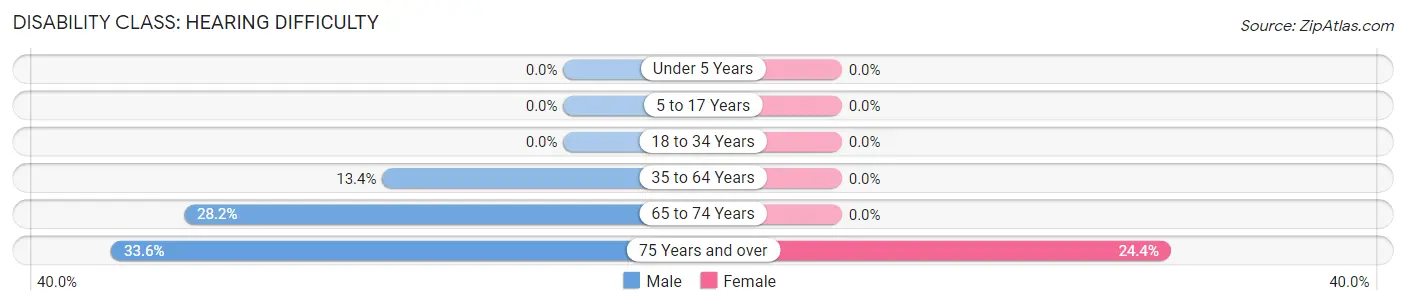
| Age Bracket | Male | Female |
| Under 5 Years | 0 (0.0%) | 0 (0.0%) |
| 5 to 17 Years | 0 (0.0%) | 0 (0.0%) |
| 18 to 34 Years | 0 (0.0%) | 0 (0.0%) |
| 35 to 64 Years | 113 (13.4%) | 0 (0.0%) |
| 65 to 74 Years | 58 (28.2%) | 0 (0.0%) |
| 75 Years and over | 48 (33.6%) | 42 (24.4%) |
Disability Class: Vision Difficulty
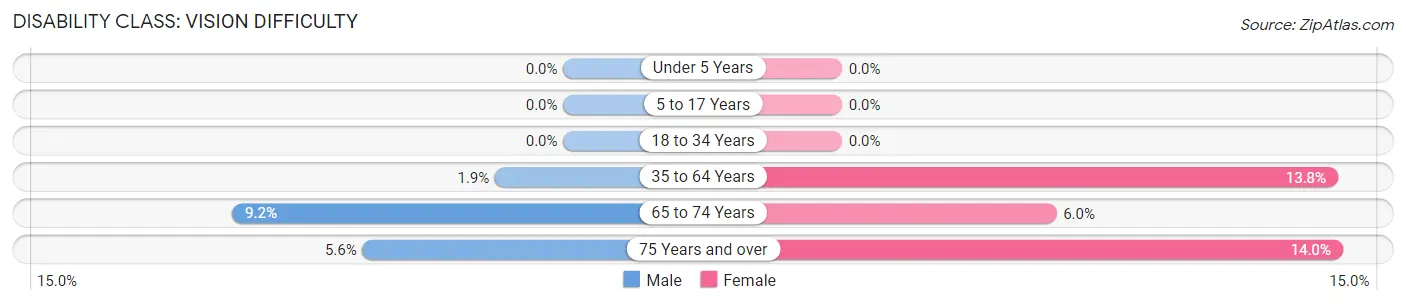
| Age Bracket | Male | Female |
| Under 5 Years | 0 (0.0%) | 0 (0.0%) |
| 5 to 17 Years | 0 (0.0%) | 0 (0.0%) |
| 18 to 34 Years | 0 (0.0%) | 0 (0.0%) |
| 35 to 64 Years | 16 (1.9%) | 91 (13.8%) |
| 65 to 74 Years | 19 (9.2%) | 12 (6.0%) |
| 75 Years and over | 8 (5.6%) | 24 (14.0%) |
Disability Class: Cognitive Difficulty
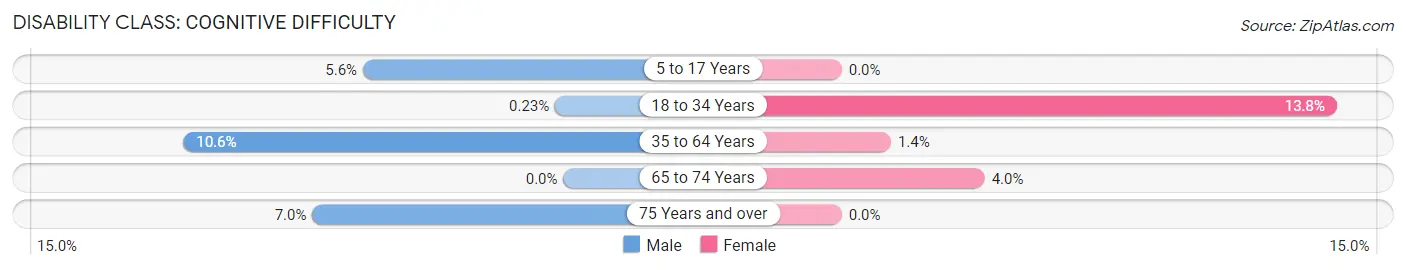
| Age Bracket | Male | Female |
| 5 to 17 Years | 12 (5.6%) | 0 (0.0%) |
| 18 to 34 Years | 1 (0.2%) | 47 (13.8%) |
| 35 to 64 Years | 89 (10.6%) | 9 (1.4%) |
| 65 to 74 Years | 0 (0.0%) | 8 (4.0%) |
| 75 Years and over | 10 (7.0%) | 0 (0.0%) |
Disability Class: Ambulatory Difficulty
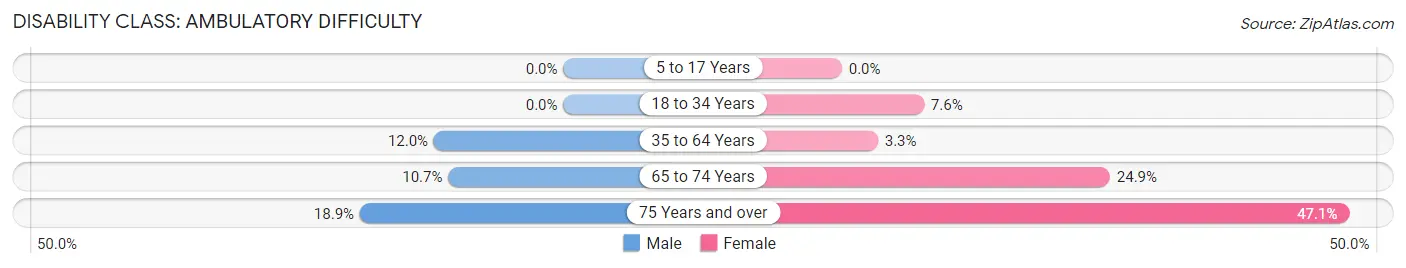
| Age Bracket | Male | Female |
| 5 to 17 Years | 0 (0.0%) | 0 (0.0%) |
| 18 to 34 Years | 0 (0.0%) | 26 (7.6%) |
| 35 to 64 Years | 101 (12.0%) | 22 (3.3%) |
| 65 to 74 Years | 22 (10.7%) | 50 (24.9%) |
| 75 Years and over | 27 (18.9%) | 81 (47.1%) |
Disability Class: Self-Care Difficulty
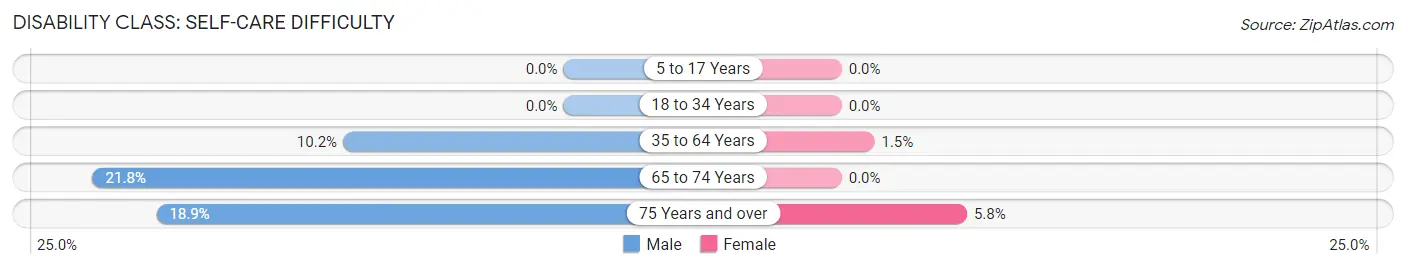
| Age Bracket | Male | Female |
| 5 to 17 Years | 0 (0.0%) | 0 (0.0%) |
| 18 to 34 Years | 0 (0.0%) | 0 (0.0%) |
| 35 to 64 Years | 86 (10.2%) | 10 (1.5%) |
| 65 to 74 Years | 45 (21.8%) | 0 (0.0%) |
| 75 Years and over | 27 (18.9%) | 10 (5.8%) |
Technology Access in Tarpey Village
Computing Device Access in Tarpey Village
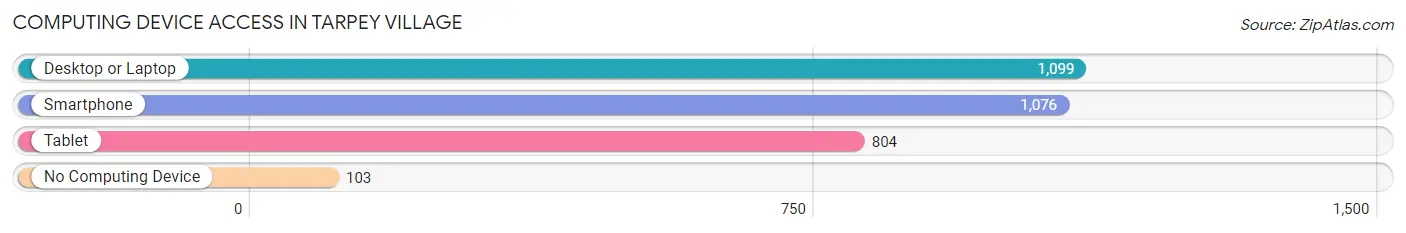
| Device Type | # Households | % Households |
| Desktop or Laptop | 1,099 | 84.9% |
| Smartphone | 1,076 | 83.1% |
| Tablet | 804 | 62.1% |
| No Computing Device | 103 | 8.0% |
| Total | 1,295 | 100.0% |
Internet Access in Tarpey Village
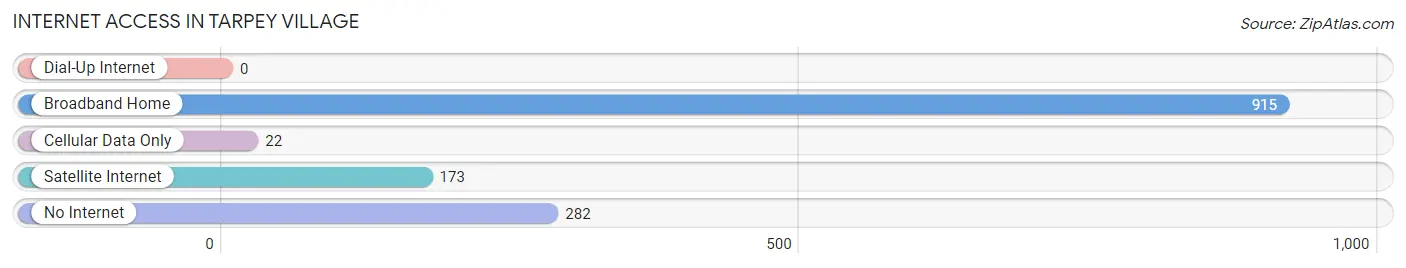
| Internet Type | # Households | % Households |
| Dial-Up Internet | 0 | 0.0% |
| Broadband Home | 915 | 70.7% |
| Cellular Data Only | 22 | 1.7% |
| Satellite Internet | 173 | 13.4% |
| No Internet | 282 | 21.8% |
| Total | 1,295 | 100.0% |
Tarpey Village Summary
Tarpey Village is a small unincorporated community located in Fresno County, California. It is situated in the San Joaquin Valley, approximately 8 miles south of the city of Fresno. The population of Tarpey Village was estimated to be 1,845 in 2019.
History
Tarpey Village was founded in 1891 by William Tarpey, a rancher from Ireland. Tarpey purchased a large tract of land in the area and began to develop it into a small farming community. He built a general store, a post office, and a school. The community grew slowly over the years, and by the early 1900s, it had become a thriving agricultural center.
The town was named after William Tarpey, and the name was officially adopted in 1910. In the 1920s, the town began to experience a period of growth and prosperity. The population increased from around 500 to over 1,000 by the end of the decade.
During the Great Depression, Tarpey Village suffered a severe economic downturn. Many of the businesses in the town closed, and the population declined. However, the town was able to recover in the 1940s and 1950s, and by the 1960s, it had become a thriving agricultural center once again.
Geography
Tarpey Village is located in the San Joaquin Valley, approximately 8 miles south of the city of Fresno. The town is situated on the banks of the San Joaquin River, and it is surrounded by rolling hills and farmland. The climate in the area is hot and dry in the summer, and mild and wet in the winter.
Economy
The economy of Tarpey Village is largely based on agriculture. The town is home to several large farms, which produce a variety of crops, including grapes, almonds, and cotton. In addition, the town is home to several small businesses, including restaurants, grocery stores, and gas stations.
Demographics
As of 2019, the population of Tarpey Village was estimated to be 1,845. The racial makeup of the town was 79.3% White, 8.2% Hispanic or Latino, 6.2% Asian, and 4.3% African American. The median household income in the town was $45,000, and the median home value was $250,000.
Conclusion
Tarpey Village is a small unincorporated community located in Fresno County, California. It was founded in 1891 by William Tarpey, and it has since become a thriving agricultural center. The town is home to several large farms, which produce a variety of crops, and it is also home to several small businesses. The population of Tarpey Village was estimated to be 1,845 in 2019, and the racial makeup of the town was 79.3% White, 8.2% Hispanic or Latino, 6.2% Asian, and 4.3% African American.
Common Questions
What is Per Capita Income in Tarpey Village?
Per Capita income in Tarpey Village is $33,539.
What is the Median Family Income in Tarpey Village?
Median Family Income in Tarpey Village is $98,394.
What is the Median Household income in Tarpey Village?
Median Household Income in Tarpey Village is $70,982.
What is Income or Wage Gap in Tarpey Village?
Income or Wage Gap in Tarpey Village is 32.7%.
Women in Tarpey Village earn 67.3 cents for every dollar earned by a man.
What is Inequality or Gini Index in Tarpey Village?
Inequality or Gini Index in Tarpey Village is 0.52.
What is the Total Population of Tarpey Village?
Total Population of Tarpey Village is 3,746.
What is the Total Male Population of Tarpey Village?
Total Male Population of Tarpey Village is 1,947.
What is the Total Female Population of Tarpey Village?
Total Female Population of Tarpey Village is 1,799.
What is the Ratio of Males per 100 Females in Tarpey Village?
There are 108.23 Males per 100 Females in Tarpey Village.
What is the Ratio of Females per 100 Males in Tarpey Village?
There are 92.40 Females per 100 Males in Tarpey Village.
What is the Median Population Age in Tarpey Village?
Median Population Age in Tarpey Village is 39.1 Years.
What is the Average Family Size in Tarpey Village
Average Family Size in Tarpey Village is 3.5 People.
What is the Average Household Size in Tarpey Village
Average Household Size in Tarpey Village is 2.9 People.
How Large is the Labor Force in Tarpey Village?
There are 1,762 People in the Labor Forcein in Tarpey Village.
What is the Percentage of People in the Labor Force in Tarpey Village?
57.4% of People are in the Labor Force in Tarpey Village.
What is the Unemployment Rate in Tarpey Village?
Unemployment Rate in Tarpey Village is 9.5%.