Cities with the Highest Percentage of Households with Income Above $100,000 in California
RELATED REPORTS & OPTIONS
Household Income | $100k+
California
Compare Cities
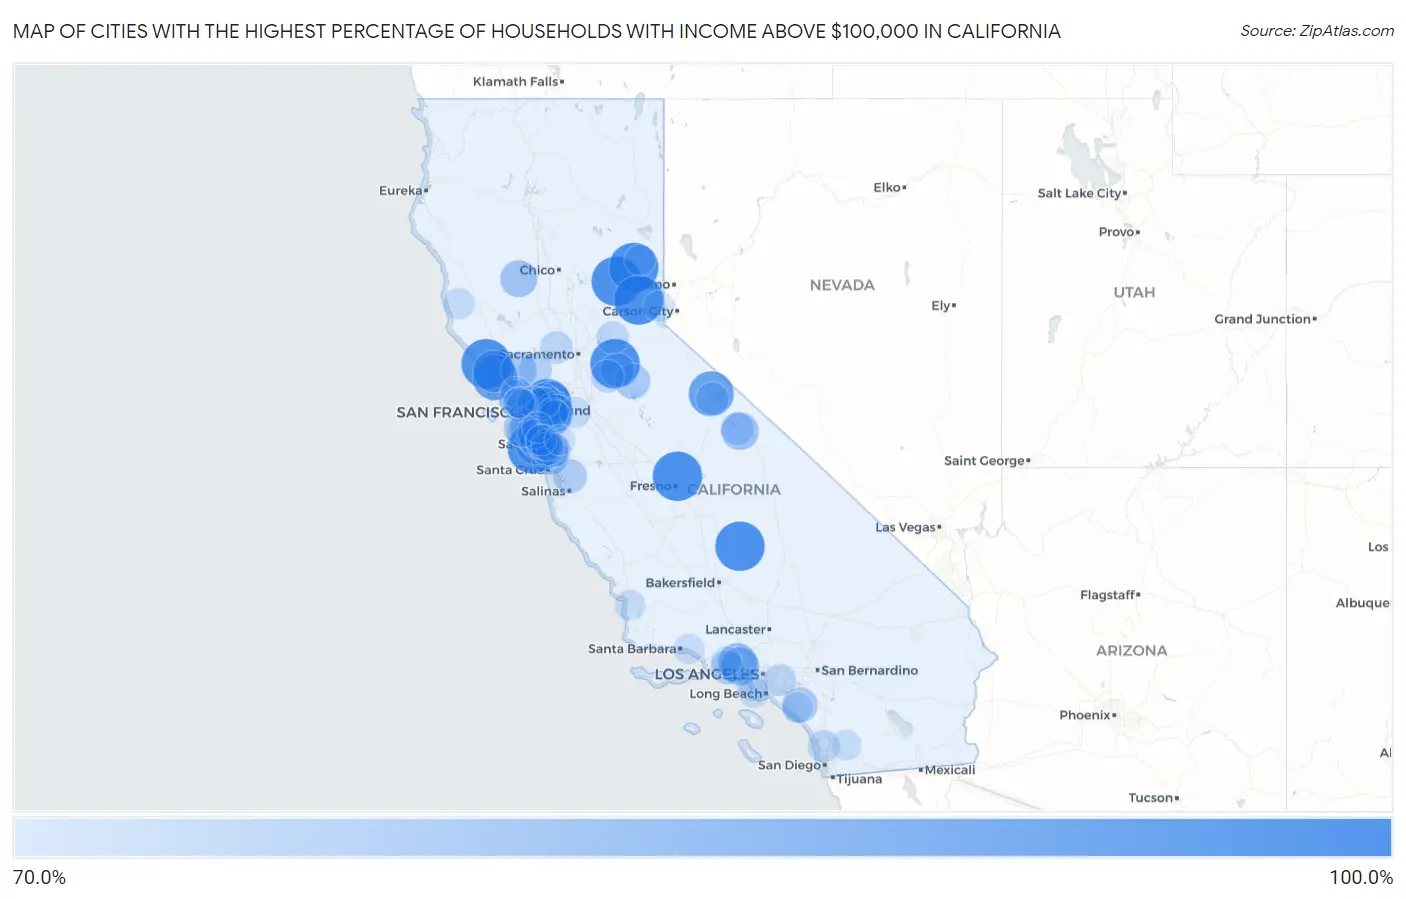
Map of Cities with the Highest Percentage of Households with Income Above $100,000 in California
0.0%
100.0%
Cities with the Highest Percentage of Households with Income Above $100,000 in California
| City | Households with Income > $100k | vs State | vs National | |
| 1. | Fort Washington | 100.0% | 46.4%(+53.6)#1 | 37.3%(+62.7)#32 |
| 2. | Loma Mar | 100.0% | 46.4%(+53.6)#2 | 37.3%(+62.7)#52 |
| 3. | Old River | 100.0% | 46.4%(+53.6)#3 | 37.3%(+62.7)#58 |
| 4. | Downieville | 100.0% | 46.4%(+53.6)#4 | 37.3%(+62.7)#59 |
| 5. | Gold Mountain | 100.0% | 46.4%(+53.6)#5 | 37.3%(+62.7)#66 |
| 6. | Kingvale | 100.0% | 46.4%(+53.6)#6 | 37.3%(+62.7)#77 |
| 7. | Drytown | 100.0% | 46.4%(+53.6)#7 | 37.3%(+62.7)#95 |
| 8. | California Hot Springs | 100.0% | 46.4%(+53.6)#8 | 37.3%(+62.7)#160 |
| 9. | Jenner | 100.0% | 46.4%(+53.6)#9 | 37.3%(+62.7)#169 |
| 10. | Olde Stockdale | 97.5% | 46.4%(+51.1)#10 | 37.3%(+60.2)#200 |
| 11. | Shell Ridge | 96.9% | 46.4%(+50.5)#11 | 37.3%(+59.6)#203 |
| 12. | Elfin Forest | 95.8% | 46.4%(+49.4)#12 | 37.3%(+58.5)#204 |
| 13. | Norris Canyon | 94.3% | 46.4%(+47.9)#13 | 37.3%(+57.0)#207 |
| 14. | Dillon Beach | 94.1% | 46.4%(+47.7)#14 | 37.3%(+56.8)#209 |
| 15. | Mono City | 93.9% | 46.4%(+47.5)#15 | 37.3%(+56.6)#210 |
| 16. | Pepperdine University | 92.8% | 46.4%(+46.4)#16 | 37.3%(+55.5)#217 |
| 17. | North Gate | 90.6% | 46.4%(+44.2)#17 | 37.3%(+53.3)#243 |
| 18. | Bodega | 89.5% | 46.4%(+43.1)#18 | 37.3%(+52.2)#265 |
| 19. | La Honda | 85.9% | 46.4%(+39.5)#19 | 37.3%(+48.6)#325 |
| 20. | Atherton | 85.6% | 46.4%(+39.2)#20 | 37.3%(+48.3)#328 |
| 21. | El Macero | 85.6% | 46.4%(+39.2)#21 | 37.3%(+48.3)#330 |
| 22. | Bell Canyon | 85.4% | 46.4%(+39.0)#22 | 37.3%(+48.1)#335 |
| 23. | Hidden Hills | 85.1% | 46.4%(+38.7)#23 | 37.3%(+47.8)#339 |
| 24. | Ladera | 85.1% | 46.4%(+38.7)#24 | 37.3%(+47.8)#341 |
| 25. | Piedmont | 84.9% | 46.4%(+38.5)#25 | 37.3%(+47.6)#345 |
| 26. | Swall Meadows | 83.9% | 46.4%(+37.5)#26 | 37.3%(+46.6)#374 |
| 27. | Ross | 83.7% | 46.4%(+37.3)#27 | 37.3%(+46.4)#378 |
| 28. | Hillsborough | 83.5% | 46.4%(+37.1)#28 | 37.3%(+46.2)#386 |
| 29. | Castle Hill | 83.5% | 46.4%(+37.1)#29 | 37.3%(+46.2)#388 |
| 30. | Lexington Hills | 83.4% | 46.4%(+37.0)#30 | 37.3%(+46.1)#393 |
| 31. | Los Altos | 83.3% | 46.4%(+36.9)#31 | 37.3%(+46.0)#396 |
| 32. | Elk Creek | 83.3% | 46.4%(+36.9)#32 | 37.3%(+46.0)#401 |
| 33. | West Menlo Park | 83.2% | 46.4%(+36.8)#33 | 37.3%(+45.9)#406 |
| 34. | Emerald Lake Hills | 83.1% | 46.4%(+36.7)#34 | 37.3%(+45.8)#408 |
| 35. | Alamo | 83.0% | 46.4%(+36.6)#35 | 37.3%(+45.7)#413 |
| 36. | Monte Sereno | 82.8% | 46.4%(+36.4)#36 | 37.3%(+45.5)#426 |
| 37. | Tiburon | 81.7% | 46.4%(+35.3)#37 | 37.3%(+44.4)#469 |
| 38. | Mountain Ranch | 81.5% | 46.4%(+35.1)#38 | 37.3%(+44.2)#479 |
| 39. | Glen Ellen | 81.4% | 46.4%(+35.0)#39 | 37.3%(+44.1)#483 |
| 40. | Coto De Caza | 81.3% | 46.4%(+34.9)#40 | 37.3%(+44.0)#485 |
| 41. | Montara | 81.1% | 46.4%(+34.7)#41 | 37.3%(+43.8)#497 |
| 42. | Woodside | 80.7% | 46.4%(+34.3)#42 | 37.3%(+43.4)#513 |
| 43. | Bear Valley Cdp Mariposa County | 80.7% | 46.4%(+34.3)#43 | 37.3%(+43.4)#518 |
| 44. | Portola Valley | 80.6% | 46.4%(+34.2)#44 | 37.3%(+43.3)#519 |
| 45. | Loyola | 80.6% | 46.4%(+34.2)#45 | 37.3%(+43.3)#521 |
| 46. | Orinda | 80.3% | 46.4%(+33.9)#46 | 37.3%(+43.0)#529 |
| 47. | Blackhawk | 80.3% | 46.4%(+33.9)#47 | 37.3%(+43.0)#530 |
| 48. | Los Altos Hills | 79.6% | 46.4%(+33.2)#48 | 37.3%(+42.3)#571 |
| 49. | Mountain Meadows | 79.6% | 46.4%(+33.2)#49 | 37.3%(+42.3)#574 |
| 50. | Martell | 79.6% | 46.4%(+33.2)#50 | 37.3%(+42.3)#575 |
| 51. | La Canada Flintridge | 79.5% | 46.4%(+33.1)#51 | 37.3%(+42.2)#576 |
| 52. | Aromas | 79.5% | 46.4%(+33.1)#52 | 37.3%(+42.2)#580 |
| 53. | Lake Sherwood | 79.3% | 46.4%(+32.9)#53 | 37.3%(+42.0)#594 |
| 54. | San Miguel Cdp Contra Costa County | 79.1% | 46.4%(+32.7)#54 | 37.3%(+41.8)#606 |
| 55. | Silverado Resort | 79.1% | 46.4%(+32.7)#55 | 37.3%(+41.8)#608 |
| 56. | Danville | 78.9% | 46.4%(+32.5)#56 | 37.3%(+41.6)#616 |
| 57. | Cambrian Park | 78.8% | 46.4%(+32.4)#57 | 37.3%(+41.5)#628 |
| 58. | Reliez Valley | 78.6% | 46.4%(+32.2)#58 | 37.3%(+41.3)#638 |
| 59. | Highlands | 78.5% | 46.4%(+32.1)#59 | 37.3%(+41.2)#644 |
| 60. | Tamalpais Homestead Valley | 78.4% | 46.4%(+32.0)#60 | 37.3%(+41.1)#648 |
| 61. | Camino Tassajara | 78.4% | 46.4%(+32.0)#61 | 37.3%(+41.1)#650 |
| 62. | Aspen Springs | 78.3% | 46.4%(+31.9)#62 | 37.3%(+41.0)#660 |
| 63. | Camanche Village | 78.0% | 46.4%(+31.6)#63 | 37.3%(+40.7)#682 |
| 64. | Saratoga | 77.9% | 46.4%(+31.5)#64 | 37.3%(+40.6)#686 |
| 65. | Kensington | 77.9% | 46.4%(+31.5)#65 | 37.3%(+40.6)#687 |
| 66. | Lee Vining | 77.9% | 46.4%(+31.5)#66 | 37.3%(+40.6)#694 |
| 67. | San Carlos | 77.7% | 46.4%(+31.3)#67 | 37.3%(+40.4)#706 |
| 68. | Lafayette | 77.5% | 46.4%(+31.1)#68 | 37.3%(+40.2)#721 |
| 69. | Monument Hills | 77.5% | 46.4%(+31.1)#69 | 37.3%(+40.2)#726 |
| 70. | Coloma | 77.5% | 46.4%(+31.1)#70 | 37.3%(+40.2)#728 |
| 71. | Harmony Grove | 77.4% | 46.4%(+31.0)#71 | 37.3%(+40.1)#736 |
| 72. | Fairbanks Ranch | 77.2% | 46.4%(+30.8)#72 | 37.3%(+39.9)#747 |
| 73. | El Granada | 77.1% | 46.4%(+30.7)#73 | 37.3%(+39.8)#750 |
| 74. | La Habra Heights | 77.1% | 46.4%(+30.7)#74 | 37.3%(+39.8)#752 |
| 75. | Baywood Park | 77.1% | 46.4%(+30.7)#75 | 37.3%(+39.8)#761 |
| 76. | Dublin | 76.8% | 46.4%(+30.4)#76 | 37.3%(+39.5)#775 |
| 77. | California Polytechnic State University | 76.7% | 46.4%(+30.3)#77 | 37.3%(+39.4)#779 |
| 78. | Manhattan Beach | 76.6% | 46.4%(+30.2)#78 | 37.3%(+39.3)#783 |
| 79. | Cupertino | 76.5% | 46.4%(+30.1)#79 | 37.3%(+39.2)#787 |
| 80. | Mountain House | 76.2% | 46.4%(+29.8)#80 | 37.3%(+38.9)#801 |
| 81. | Goodmanville | 76.2% | 46.4%(+29.8)#81 | 37.3%(+38.9)#807 |
| 82. | Comptche | 76.1% | 46.4%(+29.7)#82 | 37.3%(+38.8)#811 |
| 83. | Alto | 75.9% | 46.4%(+29.5)#83 | 37.3%(+38.6)#820 |
| 84. | San Ramon | 75.7% | 46.4%(+29.3)#84 | 37.3%(+38.4)#836 |
| 85. | Carnelian Bay | 75.6% | 46.4%(+29.2)#85 | 37.3%(+38.3)#846 |
| 86. | Ladera Ranch | 75.5% | 46.4%(+29.1)#86 | 37.3%(+38.2)#849 |
| 87. | Lucas Valley Marinwood | 75.5% | 46.4%(+29.1)#87 | 37.3%(+38.2)#851 |
| 88. | Belvedere | 75.5% | 46.4%(+29.1)#88 | 37.3%(+38.2)#853 |
| 89. | Palos Verdes Estates | 75.4% | 46.4%(+29.0)#89 | 37.3%(+38.1)#857 |
| 90. | Bayview Cdp Contra Costa County | 75.4% | 46.4%(+29.0)#90 | 37.3%(+38.1)#863 |
| 91. | Foster City | 75.3% | 46.4%(+28.9)#91 | 37.3%(+38.0)#867 |
| 92. | San Diego Country Estates | 75.3% | 46.4%(+28.9)#92 | 37.3%(+38.0)#868 |
| 93. | Callender | 75.2% | 46.4%(+28.8)#93 | 37.3%(+37.9)#878 |
| 94. | Mill Valley | 75.1% | 46.4%(+28.7)#94 | 37.3%(+37.8)#880 |
| 95. | Beckwourth | 75.1% | 46.4%(+28.7)#95 | 37.3%(+37.8)#885 |
| 96. | Palo Alto | 75.0% | 46.4%(+28.6)#96 | 37.3%(+37.7)#886 |
| 97. | East Foothills | 75.0% | 46.4%(+28.6)#97 | 37.3%(+37.7)#890 |
| 98. | Toro Canyon | 75.0% | 46.4%(+28.6)#98 | 37.3%(+37.7)#895 |
| 99. | Millerton | 74.8% | 46.4%(+28.4)#99 | 37.3%(+37.5)#918 |
| 100. | Santa Rosa Valley | 74.5% | 46.4%(+28.1)#100 | 37.3%(+37.2)#939 |
Common Questions
What are the Top 10 Cities with the Highest Percentage of Households with Income Above $100,000 in California?
Top 10 Cities with the Highest Percentage of Households with Income Above $100,000 in California are:
#1
100.0%
#2
100.0%
#3
100.0%
#4
100.0%
#5
100.0%
#6
100.0%
#7
100.0%
#8
100.0%
#9
96.9%
#10
94.3%
What city has the Highest Percentage of Households with Income Above $100,000 in California?
Fort Washington has the Highest Percentage of Households with Income Above $100,000 in California with 100.0%.
What is the Percentage of Households with Income Above $100,000 in the State of California?
Percentage of Households with Income Above $100,000 in California is 46.4%.
What is the Percentage of Households with Income Above $100,000 in the United States?
Percentage of Households with Income Above $100,000 in the United States is 37.3%.