Jackson, CA Map & Demographics
Jackson Map
Jackson Overview
$36,010
PER CAPITA INCOME
$86,094
AVG FAMILY INCOME
$70,805
AVG HOUSEHOLD INCOME
53.9%
WAGE / INCOME GAP [ % ]
46.1¢/ $1
WAGE / INCOME GAP [ $ ]
0.44
INEQUALITY / GINI INDEX
5,004
TOTAL POPULATION
2,591
MALE POPULATION
2,413
FEMALE POPULATION
107.38
MALES / 100 FEMALES
93.13
FEMALES / 100 MALES
43.7
MEDIAN AGE
2.8
AVG FAMILY SIZE
2.2
AVG HOUSEHOLD SIZE
2,129
LABOR FORCE [ PEOPLE ]
50.7%
PERCENT IN LABOR FORCE
5.0%
UNEMPLOYMENT RATE
Jackson Zip Codes
Jackson Area Codes
Income in Jackson
Income Overview in Jackson
Per Capita Income in Jackson is $36,010, while median incomes of families and households are $86,094 and $70,805 respectively.
| Characteristic | Number | Measure |
| Per Capita Income | 5,004 | $36,010 |
| Median Family Income | 1,363 | $86,094 |
| Mean Family Income | 1,363 | $99,742 |
| Median Household Income | 2,166 | $70,805 |
| Mean Household Income | 2,166 | $80,420 |
| Income Deficit | 1,363 | $0 |
| Wage / Income Gap (%) | 5,004 | 53.90% |
| Wage / Income Gap ($) | 5,004 | 46.10¢ per $1 |
| Gini / Inequality Index | 5,004 | 0.44 |
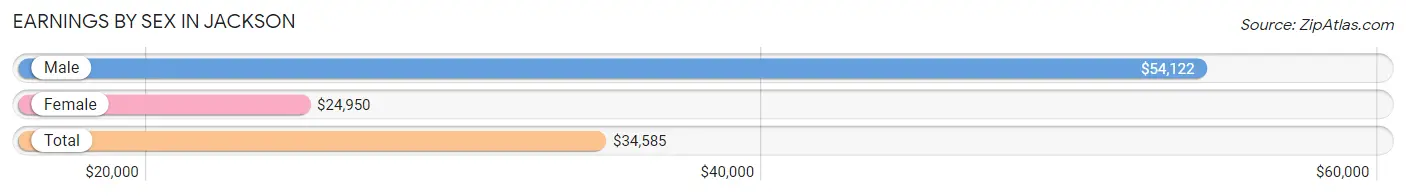
Earnings by Sex in Jackson
Average Earnings in Jackson are $34,585, $54,122 for men and $24,950 for women, a difference of 53.9%.
| Sex | Number | Average Earnings |
| Male | 1,152 (50.6%) | $54,122 |
| Female | 1,124 (49.4%) | $24,950 |
| Total | 2,276 (100.0%) | $34,585 |
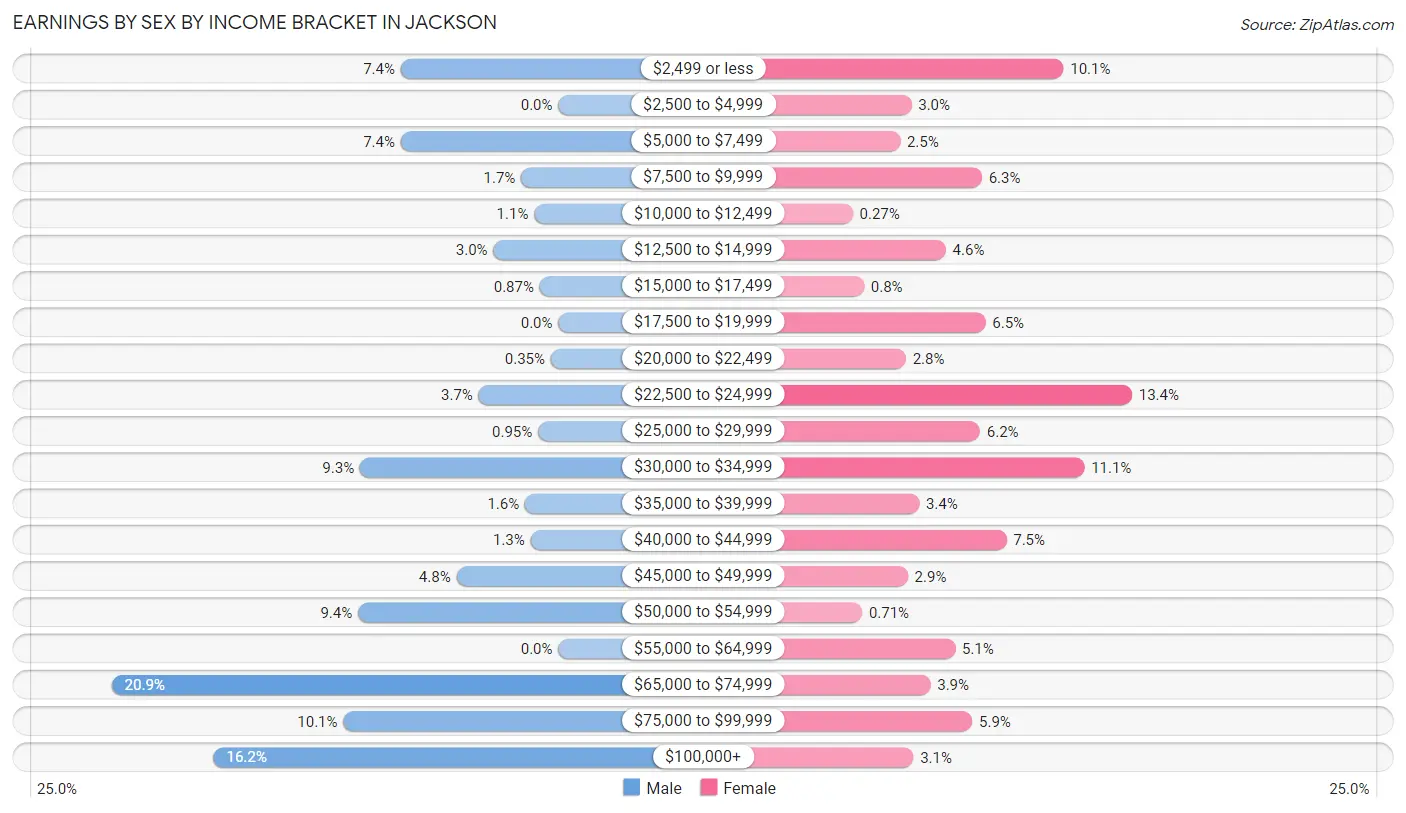
Earnings by Sex by Income Bracket in Jackson
The most common earnings brackets in Jackson are $65,000 to $74,999 for men (241 | 20.9%) and $22,500 to $24,999 for women (150 | 13.4%).
| Income | Male | Female |
| $2,499 or less | 85 (7.4%) | 114 (10.1%) |
| $2,500 to $4,999 | 0 (0.0%) | 34 (3.0%) |
| $5,000 to $7,499 | 85 (7.4%) | 28 (2.5%) |
| $7,500 to $9,999 | 20 (1.7%) | 71 (6.3%) |
| $10,000 to $12,499 | 13 (1.1%) | 3 (0.3%) |
| $12,500 to $14,999 | 35 (3.0%) | 52 (4.6%) |
| $15,000 to $17,499 | 10 (0.9%) | 9 (0.8%) |
| $17,500 to $19,999 | 0 (0.0%) | 73 (6.5%) |
| $20,000 to $22,499 | 4 (0.4%) | 31 (2.8%) |
| $22,500 to $24,999 | 43 (3.7%) | 150 (13.4%) |
| $25,000 to $29,999 | 11 (0.9%) | 70 (6.2%) |
| $30,000 to $34,999 | 107 (9.3%) | 125 (11.1%) |
| $35,000 to $39,999 | 18 (1.6%) | 38 (3.4%) |
| $40,000 to $44,999 | 15 (1.3%) | 84 (7.5%) |
| $45,000 to $49,999 | 55 (4.8%) | 32 (2.9%) |
| $50,000 to $54,999 | 108 (9.4%) | 8 (0.7%) |
| $55,000 to $64,999 | 0 (0.0%) | 57 (5.1%) |
| $65,000 to $74,999 | 241 (20.9%) | 44 (3.9%) |
| $75,000 to $99,999 | 116 (10.1%) | 66 (5.9%) |
| $100,000+ | 186 (16.2%) | 35 (3.1%) |
| Total | 1,152 (100.0%) | 1,124 (100.0%) |
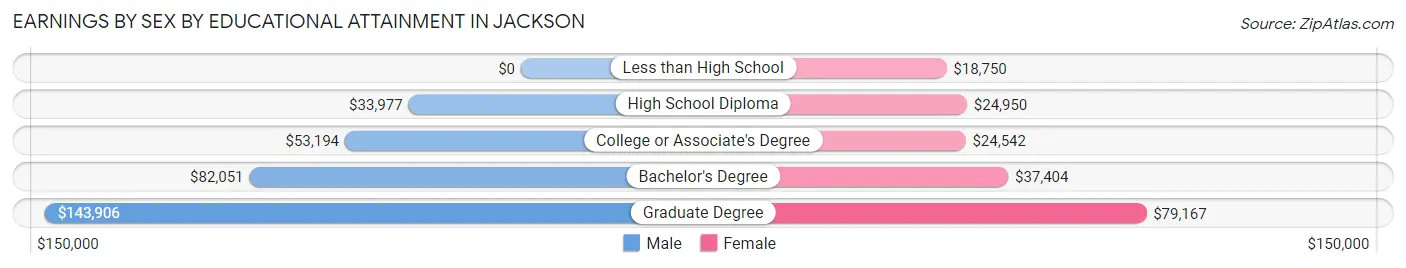
Earnings by Sex by Educational Attainment in Jackson
Average earnings in Jackson are $52,846 for men and $26,518 for women, a difference of 49.8%. Men with an educational attainment of graduate degree enjoy the highest average annual earnings of $143,906, while those with high school diploma education earn the least with $33,977. Women with an educational attainment of graduate degree earn the most with the average annual earnings of $79,167, while those with less than high school education have the smallest earnings of $18,750.
| Educational Attainment | Male Income | Female Income |
| Less than High School | - | - |
| High School Diploma | $33,977 | $24,950 |
| College or Associate's Degree | $53,194 | $24,542 |
| Bachelor's Degree | $82,051 | $37,404 |
| Graduate Degree | $143,906 | $79,167 |
| Total | $52,846 | $26,518 |
Family Income in Jackson
Family Income Brackets in Jackson
According to the Jackson family income data, there are 367 families falling into the $100,000 to $149,999 income range, which is the most common income bracket and makes up 26.9% of all families. Conversely, the $10,000 to $14,999 income bracket is the least frequent group with only 8 families (0.6%) belonging to this category.
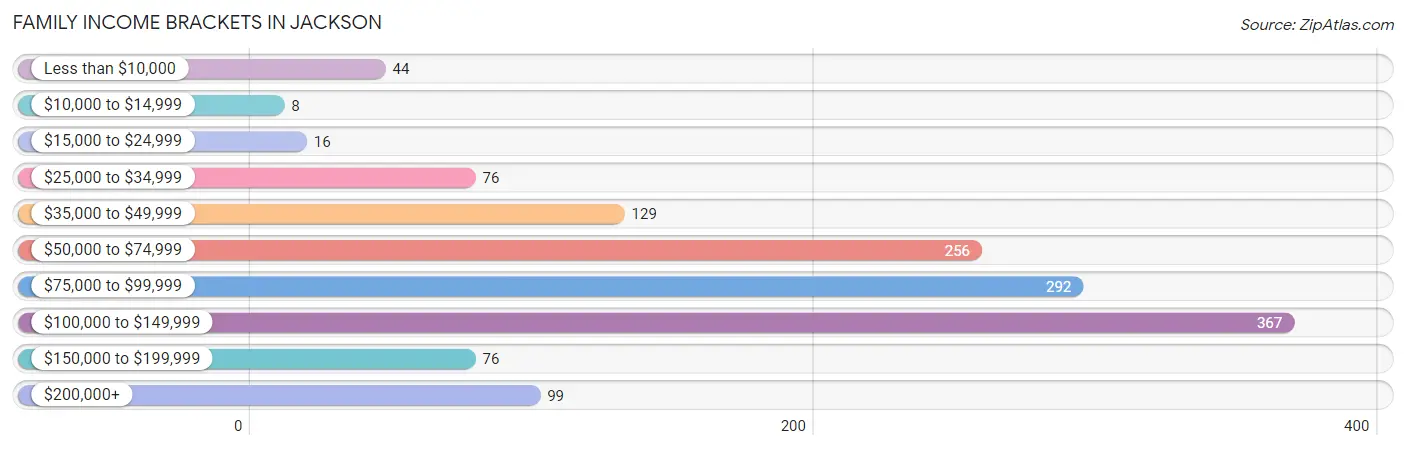
| Income Bracket | # Families | % Families |
| Less than $10,000 | 44 | 3.2% |
| $10,000 to $14,999 | 8 | 0.6% |
| $15,000 to $24,999 | 16 | 1.2% |
| $25,000 to $34,999 | 76 | 5.6% |
| $35,000 to $49,999 | 129 | 9.5% |
| $50,000 to $74,999 | 256 | 18.8% |
| $75,000 to $99,999 | 292 | 21.4% |
| $100,000 to $149,999 | 367 | 26.9% |
| $150,000 to $199,999 | 76 | 5.6% |
| $200,000+ | 99 | 7.3% |
Family Income by Famaliy Size in Jackson
5-person families (59 | 4.3%) account for the highest median family income in Jackson with $106,756 per family, while 2-person families (820 | 60.2%) have the highest median income of $42,795 per family member.
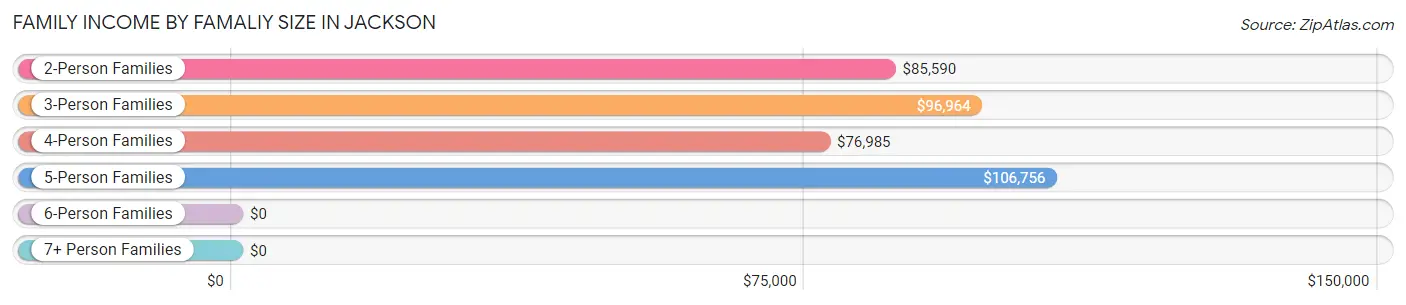
| Income Bracket | # Families | Median Income |
| 2-Person Families | 820 (60.2%) | $85,590 |
| 3-Person Families | 182 (13.4%) | $96,964 |
| 4-Person Families | 250 (18.3%) | $76,985 |
| 5-Person Families | 59 (4.3%) | $106,756 |
| 6-Person Families | 24 (1.8%) | $0 |
| 7+ Person Families | 28 (2.1%) | $0 |
| Total | 1,363 (100.0%) | $86,094 |
Family Income by Number of Earners in Jackson
The median family income in Jackson is $86,094, with families comprising 3+ earners (138) having the highest median family income of $141,500, while families with no earners (504) have the lowest median family income of $60,250, accounting for 10.1% and 37.0% of families, respectively.
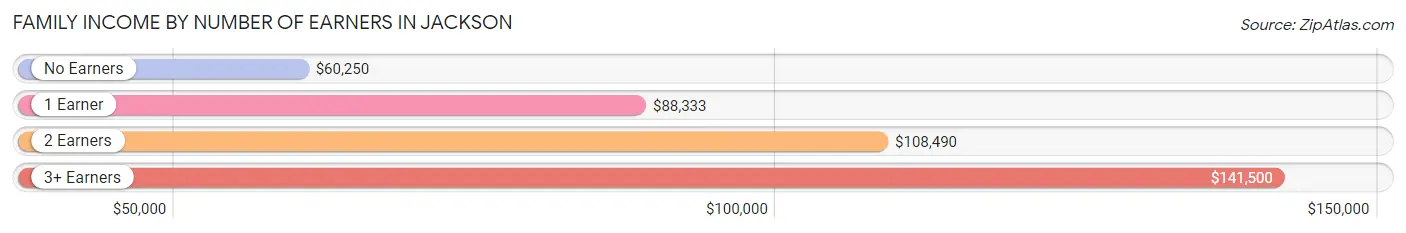
| Number of Earners | # Families | Median Income |
| No Earners | 504 (37.0%) | $60,250 |
| 1 Earner | 180 (13.2%) | $88,333 |
| 2 Earners | 541 (39.7%) | $108,490 |
| 3+ Earners | 138 (10.1%) | $141,500 |
| Total | 1,363 (100.0%) | $86,094 |
Household Income in Jackson
Household Income Brackets in Jackson
With 379 households falling in the category, the $100,000 to $149,999 income range is the most frequent in Jackson, accounting for 17.5% of all households. In contrast, only 91 households (4.2%) fall into the $150,000 to $199,999 income bracket, making it the least populous group.
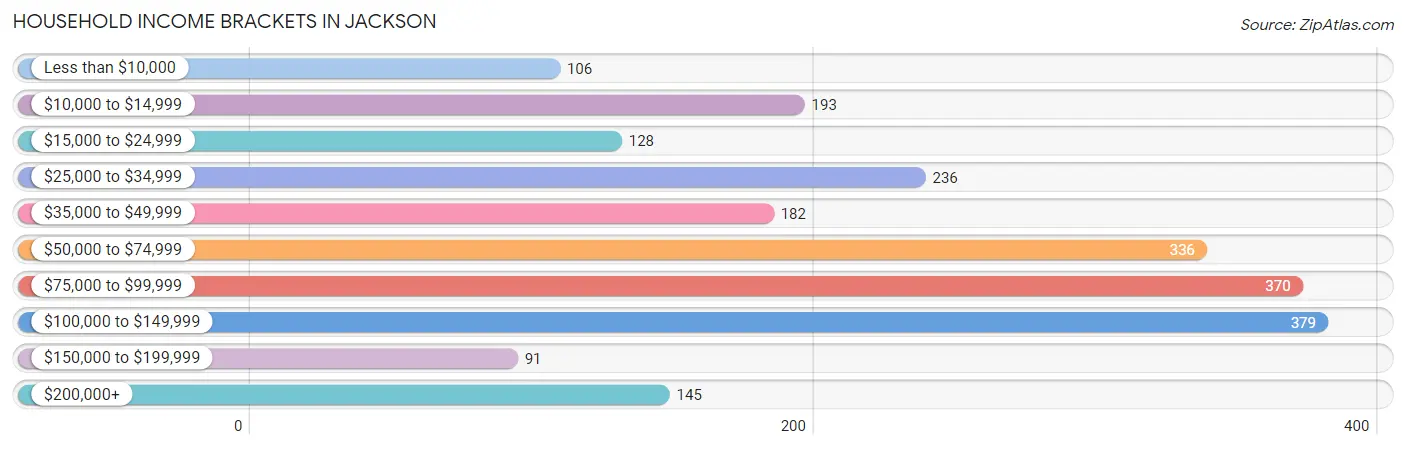
| Income Bracket | # Households | % Households |
| Less than $10,000 | 106 | 4.9% |
| $10,000 to $14,999 | 193 | 8.9% |
| $15,000 to $24,999 | 128 | 5.9% |
| $25,000 to $34,999 | 236 | 10.9% |
| $35,000 to $49,999 | 182 | 8.4% |
| $50,000 to $74,999 | 336 | 15.5% |
| $75,000 to $99,999 | 370 | 17.1% |
| $100,000 to $149,999 | 379 | 17.5% |
| $150,000 to $199,999 | 91 | 4.2% |
| $200,000+ | 145 | 6.7% |
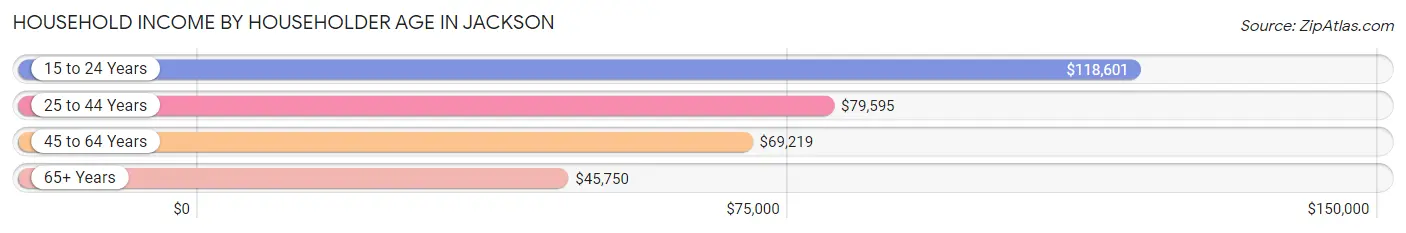
Household Income by Householder Age in Jackson
The median household income in Jackson is $70,805, with the highest median household income of $118,601 found in the 15 to 24 years age bracket for the primary householder. A total of 213 households (9.8%) fall into this category. Meanwhile, the 65+ years age bracket for the primary householder has the lowest median household income of $45,750, with 991 households (45.8%) in this group.
| Income Bracket | # Households | Median Income |
| 15 to 24 Years | 213 (9.8%) | $118,601 |
| 25 to 44 Years | 455 (21.0%) | $79,595 |
| 45 to 64 Years | 507 (23.4%) | $69,219 |
| 65+ Years | 991 (45.8%) | $45,750 |
| Total | 2,166 (100.0%) | $70,805 |
Poverty in Jackson
Income Below Poverty by Sex and Age in Jackson
With 9.8% poverty level for males and 8.7% for females among the residents of Jackson, 65 to 74 year old males and 65 to 74 year old females are the most vulnerable to poverty, with 115 males (30.9%) and 66 females (16.8%) in their respective age groups living below the poverty level.
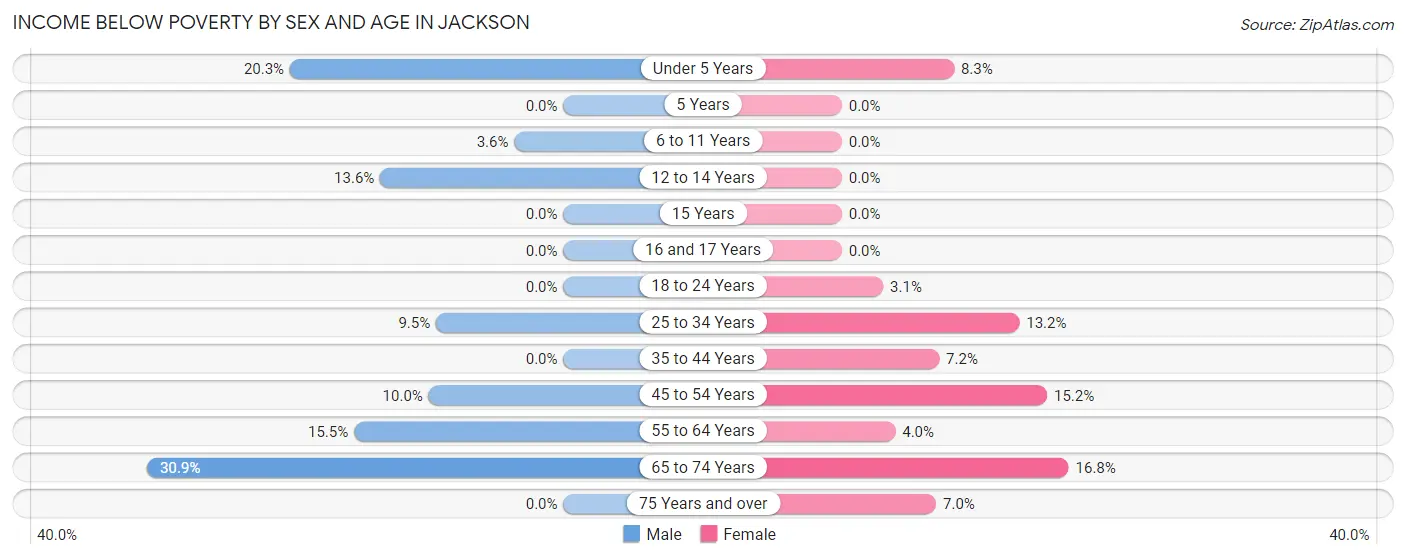
| Age Bracket | Male | Female |
| Under 5 Years | 27 (20.3%) | 5 (8.3%) |
| 5 Years | 0 (0.0%) | 0 (0.0%) |
| 6 to 11 Years | 8 (3.6%) | 0 (0.0%) |
| 12 to 14 Years | 17 (13.6%) | 0 (0.0%) |
| 15 Years | 0 (0.0%) | 0 (0.0%) |
| 16 and 17 Years | 0 (0.0%) | 0 (0.0%) |
| 18 to 24 Years | 0 (0.0%) | 9 (3.1%) |
| 25 to 34 Years | 31 (9.5%) | 34 (13.2%) |
| 35 to 44 Years | 0 (0.0%) | 12 (7.2%) |
| 45 to 54 Years | 14 (10.0%) | 41 (15.2%) |
| 55 to 64 Years | 30 (15.5%) | 11 (4.0%) |
| 65 to 74 Years | 115 (30.9%) | 66 (16.8%) |
| 75 Years and over | 0 (0.0%) | 28 (7.0%) |
| Total | 242 (9.8%) | 206 (8.7%) |
Income Above Poverty by Sex and Age in Jackson
According to the poverty statistics in Jackson, males aged 5 years and females aged 5 years are the age groups that are most secure financially, with 100.0% of males and 100.0% of females in these age groups living above the poverty line.
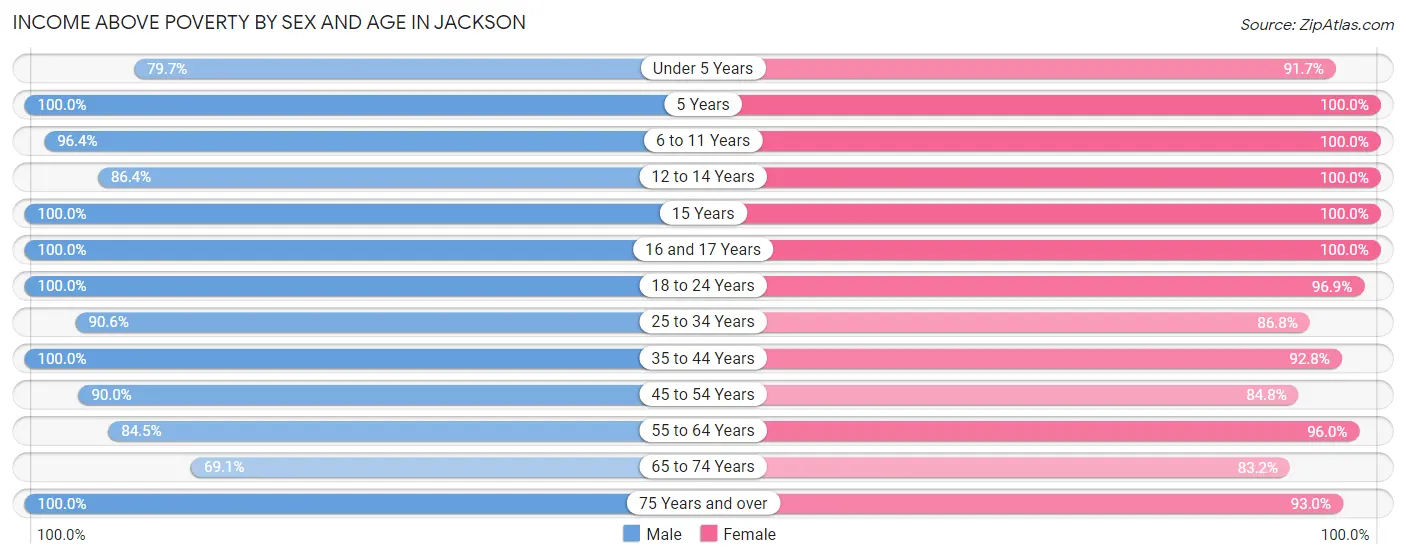
| Age Bracket | Male | Female |
| Under 5 Years | 106 (79.7%) | 55 (91.7%) |
| 5 Years | 34 (100.0%) | 10 (100.0%) |
| 6 to 11 Years | 212 (96.4%) | 126 (100.0%) |
| 12 to 14 Years | 108 (86.4%) | 54 (100.0%) |
| 15 Years | 22 (100.0%) | 16 (100.0%) |
| 16 and 17 Years | 34 (100.0%) | 44 (100.0%) |
| 18 to 24 Years | 274 (100.0%) | 284 (96.9%) |
| 25 to 34 Years | 297 (90.5%) | 224 (86.8%) |
| 35 to 44 Years | 316 (100.0%) | 154 (92.8%) |
| 45 to 54 Years | 126 (90.0%) | 228 (84.8%) |
| 55 to 64 Years | 163 (84.5%) | 266 (96.0%) |
| 65 to 74 Years | 257 (69.1%) | 326 (83.2%) |
| 75 Years and over | 284 (100.0%) | 372 (93.0%) |
| Total | 2,233 (90.2%) | 2,159 (91.3%) |
Income Below Poverty Among Married-Couple Families in Jackson
The poverty statistics for married-couple families in Jackson show that 0.7% or 8 of the total 1,069 families live below the poverty line. Families with no children have the highest poverty rate of 1.1%, comprising of 8 families. On the other hand, families with 1 or 2 children have the lowest poverty rate of 0.0%, which includes 0 families.
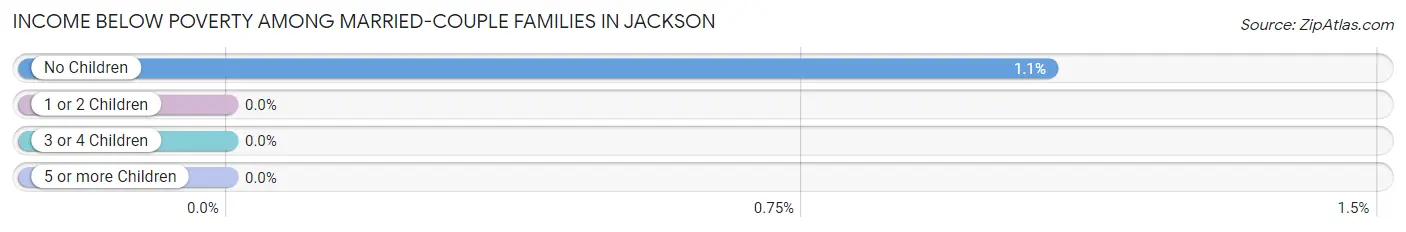
| Children | Above Poverty | Below Poverty |
| No Children | 737 (98.9%) | 8 (1.1%) |
| 1 or 2 Children | 234 (100.0%) | 0 (0.0%) |
| 3 or 4 Children | 67 (100.0%) | 0 (0.0%) |
| 5 or more Children | 23 (100.0%) | 0 (0.0%) |
| Total | 1,061 (99.3%) | 8 (0.7%) |
Income Below Poverty Among Single-Parent Households in Jackson
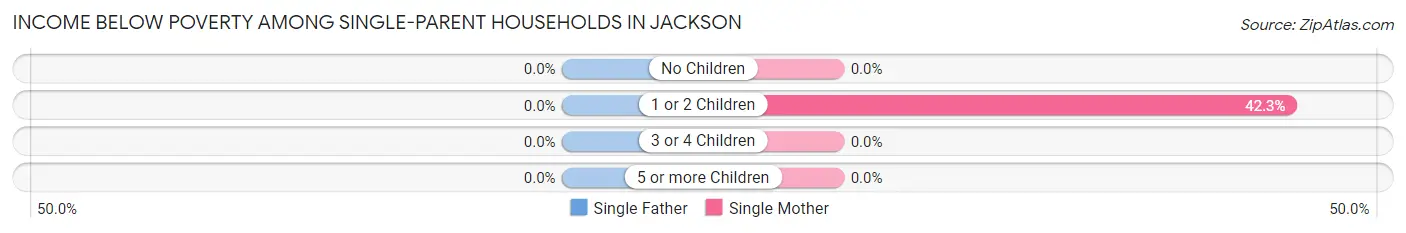
| Children | Single Father | Single Mother |
| No Children | 0 (0.0%) | 0 (0.0%) |
| 1 or 2 Children | 0 (0.0%) | 60 (42.2%) |
| 3 or 4 Children | 0 (0.0%) | 0 (0.0%) |
| 5 or more Children | 0 (0.0%) | 0 (0.0%) |
| Total | 0 (0.0%) | 60 (30.9%) |
Income Below Poverty Among Married-Couple vs Single-Parent Households in Jackson
The poverty data for Jackson shows that 8 of the married-couple family households (0.7%) and 60 of the single-parent households (20.4%) are living below the poverty level. Within the married-couple family households, those with no children have the highest poverty rate, with 8 households (1.1%) falling below the poverty line. Among the single-parent households, those with 1 or 2 children have the highest poverty rate, with 60 household (33.3%) living below poverty.
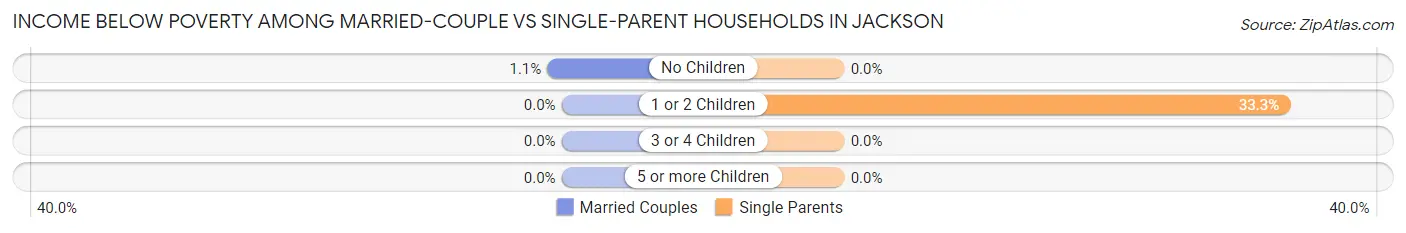
| Children | Married-Couple Families | Single-Parent Households |
| No Children | 8 (1.1%) | 0 (0.0%) |
| 1 or 2 Children | 0 (0.0%) | 60 (33.3%) |
| 3 or 4 Children | 0 (0.0%) | 0 (0.0%) |
| 5 or more Children | 0 (0.0%) | 0 (0.0%) |
| Total | 8 (0.7%) | 60 (20.4%) |
Race in Jackson
The most populous races in Jackson are White / Caucasian (3,923 | 78.4%), Hispanic or Latino (1,072 | 21.4%), and Two or more Races (591 | 11.8%).
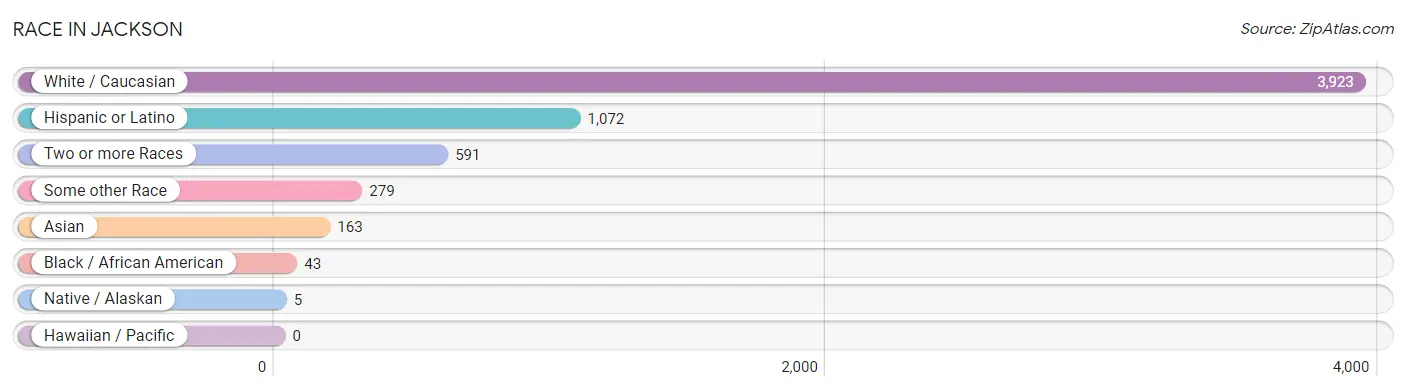
| Race | # Population | % Population |
| Asian | 163 | 3.3% |
| Black / African American | 43 | 0.9% |
| Hawaiian / Pacific | 0 | 0.0% |
| Hispanic or Latino | 1,072 | 21.4% |
| Native / Alaskan | 5 | 0.1% |
| White / Caucasian | 3,923 | 78.4% |
| Two or more Races | 591 | 11.8% |
| Some other Race | 279 | 5.6% |
| Total | 5,004 | 100.0% |
Ancestry in Jackson
The most populous ancestries reported in Jackson are English (813 | 16.3%), German (794 | 15.9%), Mexican (705 | 14.1%), Italian (343 | 6.9%), and Irish (340 | 6.8%), together accounting for 59.9% of all Jackson residents.
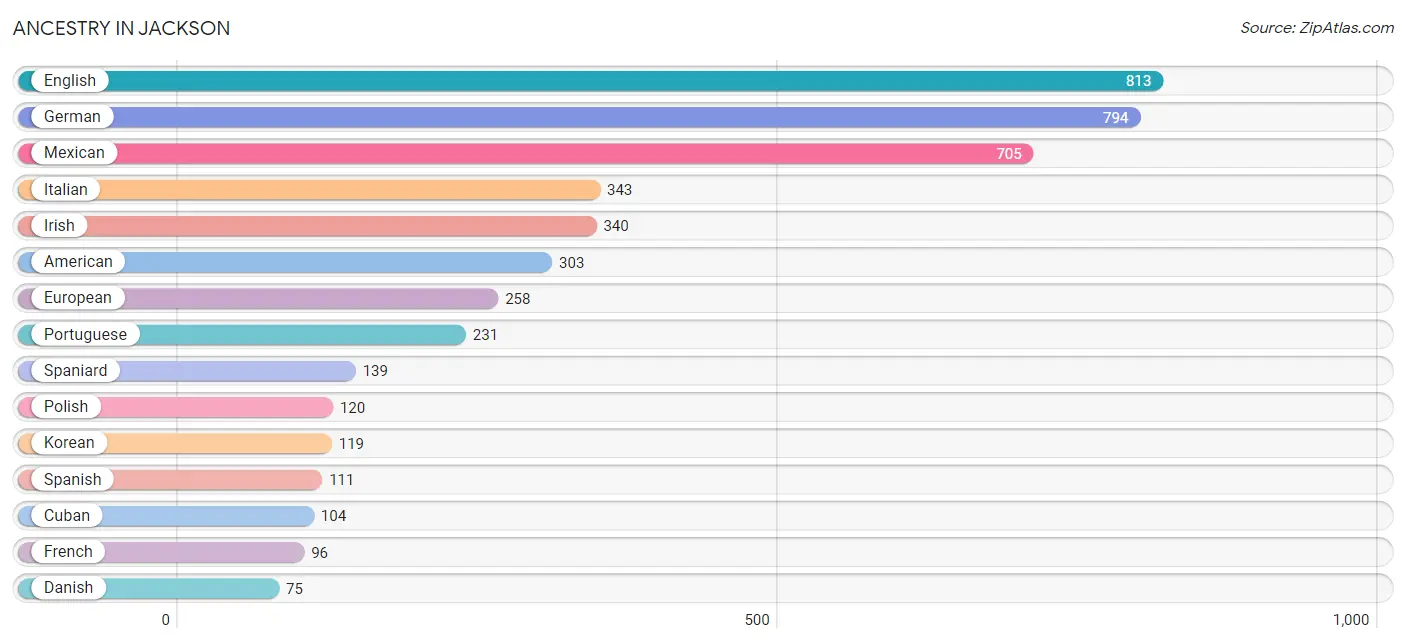
| Ancestry | # Population | % Population |
| American | 303 | 6.1% |
| Armenian | 17 | 0.3% |
| Blackfeet | 2 | 0.0% |
| British | 40 | 0.8% |
| Canadian | 15 | 0.3% |
| Cherokee | 66 | 1.3% |
| Chinese | 10 | 0.2% |
| Choctaw | 8 | 0.2% |
| Croatian | 66 | 1.3% |
| Cuban | 104 | 2.1% |
| Danish | 75 | 1.5% |
| Dutch | 3 | 0.1% |
| English | 813 | 16.3% |
| European | 258 | 5.2% |
| Finnish | 23 | 0.5% |
| French | 96 | 1.9% |
| French Canadian | 27 | 0.5% |
| German | 794 | 15.9% |
| Hungarian | 14 | 0.3% |
| Indian (Asian) | 55 | 1.1% |
| Irish | 340 | 6.8% |
| Italian | 343 | 6.9% |
| Korean | 119 | 2.4% |
| Mexican | 705 | 14.1% |
| Mexican American Indian | 3 | 0.1% |
| Norwegian | 42 | 0.8% |
| Pennsylvania German | 4 | 0.1% |
| Polish | 120 | 2.4% |
| Portuguese | 231 | 4.6% |
| Scandinavian | 46 | 0.9% |
| Scotch-Irish | 73 | 1.5% |
| Scottish | 33 | 0.7% |
| Sioux | 11 | 0.2% |
| Spaniard | 139 | 2.8% |
| Spanish | 111 | 2.2% |
| Sri Lankan | 30 | 0.6% |
| Swedish | 37 | 0.7% |
| Swiss | 34 | 0.7% |
| Welsh | 17 | 0.3% |
| Yugoslavian | 5 | 0.1% | View All 40 Rows |
Immigrants in Jackson
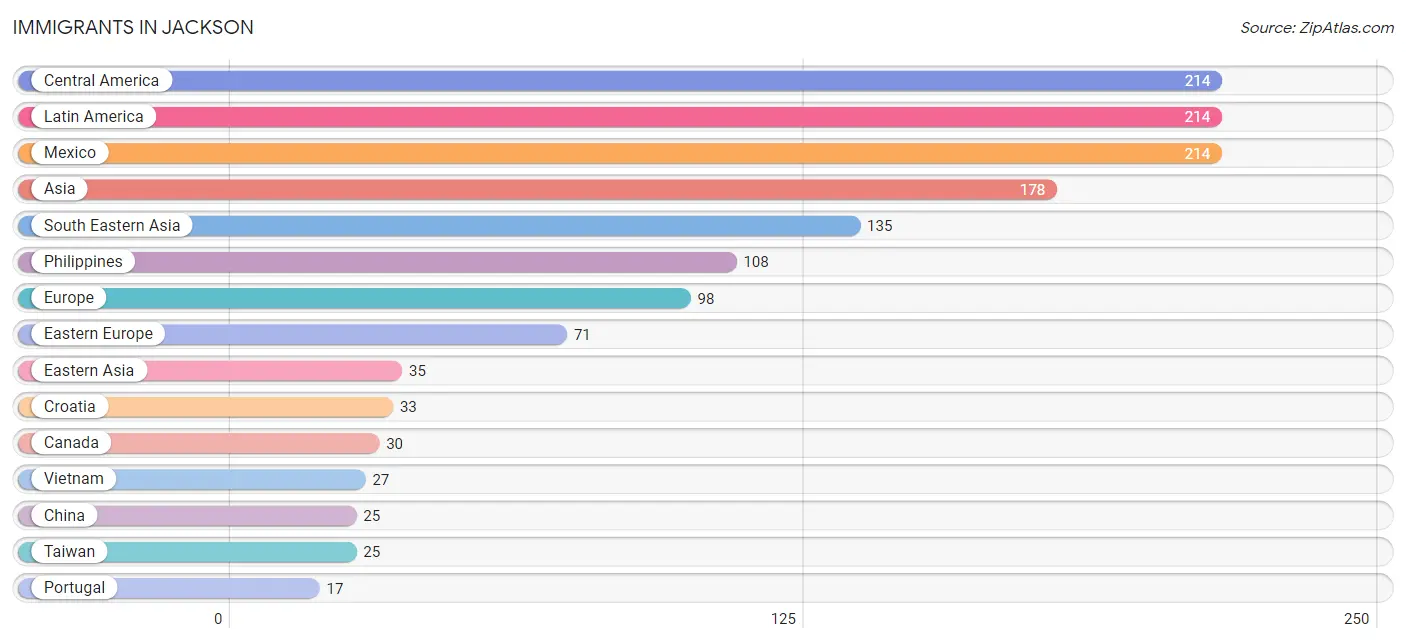
The most numerous immigrant groups reported in Jackson came from Central America (214 | 4.3%), Latin America (214 | 4.3%), Mexico (214 | 4.3%), Asia (178 | 3.6%), and South Eastern Asia (135 | 2.7%), together accounting for 19.1% of all Jackson residents.
| Immigration Origin | # Population | % Population |
| Asia | 178 | 3.6% |
| Canada | 30 | 0.6% |
| Central America | 214 | 4.3% |
| China | 25 | 0.5% |
| Croatia | 33 | 0.7% |
| Eastern Asia | 35 | 0.7% |
| Eastern Europe | 71 | 1.4% |
| Europe | 98 | 2.0% |
| Germany | 10 | 0.2% |
| Iran | 8 | 0.2% |
| Japan | 10 | 0.2% |
| Latin America | 214 | 4.3% |
| Mexico | 214 | 4.3% |
| Philippines | 108 | 2.2% |
| Poland | 5 | 0.1% |
| Portugal | 17 | 0.3% |
| South Central Asia | 8 | 0.2% |
| South Eastern Asia | 135 | 2.7% |
| Southern Europe | 17 | 0.3% |
| Taiwan | 25 | 0.5% |
| Vietnam | 27 | 0.5% |
| Western Europe | 10 | 0.2% | View All 22 Rows |
Sex and Age in Jackson
Sex and Age in Jackson
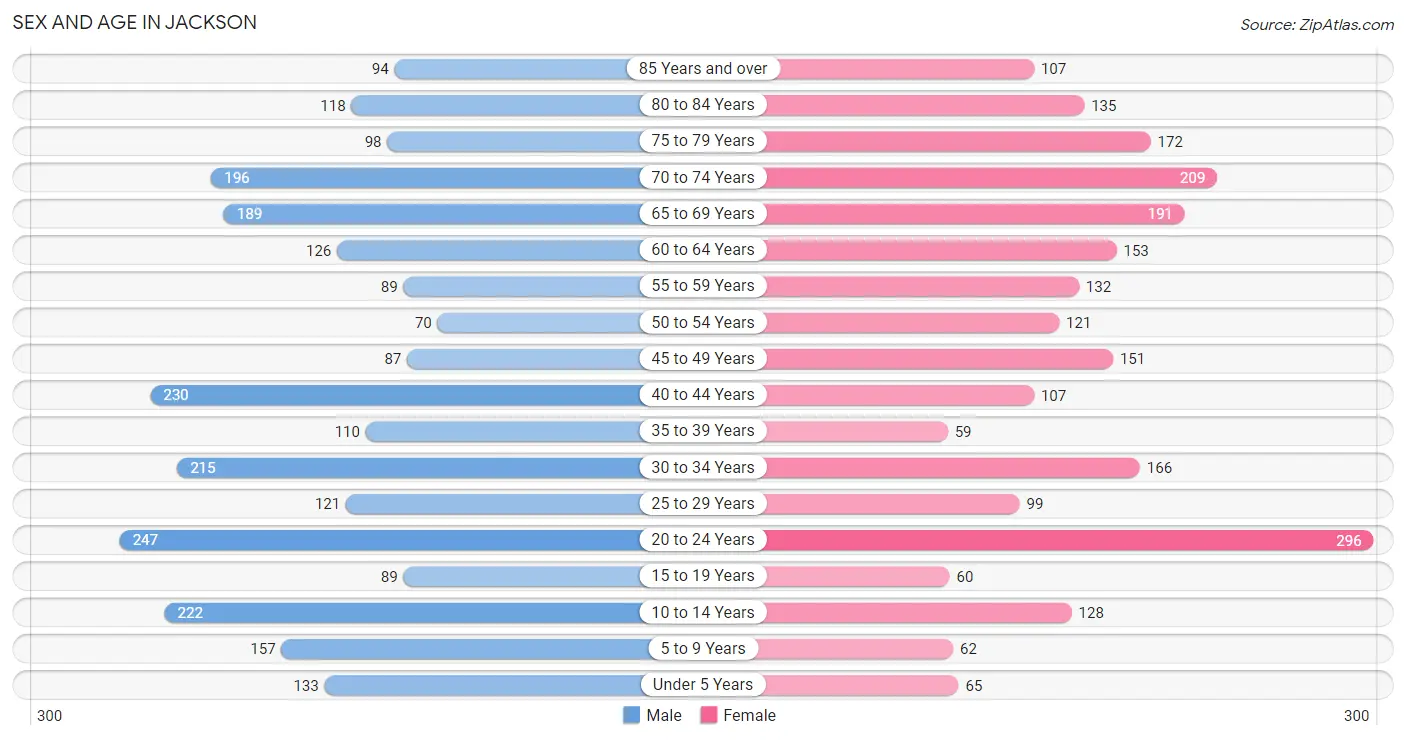
The most populous age groups in Jackson are 20 to 24 Years (247 | 9.5%) for men and 20 to 24 Years (296 | 12.3%) for women.
| Age Bracket | Male | Female |
| Under 5 Years | 133 (5.1%) | 65 (2.7%) |
| 5 to 9 Years | 157 (6.1%) | 62 (2.6%) |
| 10 to 14 Years | 222 (8.6%) | 128 (5.3%) |
| 15 to 19 Years | 89 (3.4%) | 60 (2.5%) |
| 20 to 24 Years | 247 (9.5%) | 296 (12.3%) |
| 25 to 29 Years | 121 (4.7%) | 99 (4.1%) |
| 30 to 34 Years | 215 (8.3%) | 166 (6.9%) |
| 35 to 39 Years | 110 (4.3%) | 59 (2.5%) |
| 40 to 44 Years | 230 (8.9%) | 107 (4.4%) |
| 45 to 49 Years | 87 (3.4%) | 151 (6.3%) |
| 50 to 54 Years | 70 (2.7%) | 121 (5.0%) |
| 55 to 59 Years | 89 (3.4%) | 132 (5.5%) |
| 60 to 64 Years | 126 (4.9%) | 153 (6.3%) |
| 65 to 69 Years | 189 (7.3%) | 191 (7.9%) |
| 70 to 74 Years | 196 (7.6%) | 209 (8.7%) |
| 75 to 79 Years | 98 (3.8%) | 172 (7.1%) |
| 80 to 84 Years | 118 (4.5%) | 135 (5.6%) |
| 85 Years and over | 94 (3.6%) | 107 (4.4%) |
| Total | 2,591 (100.0%) | 2,413 (100.0%) |
Families and Households in Jackson
Median Family Size in Jackson
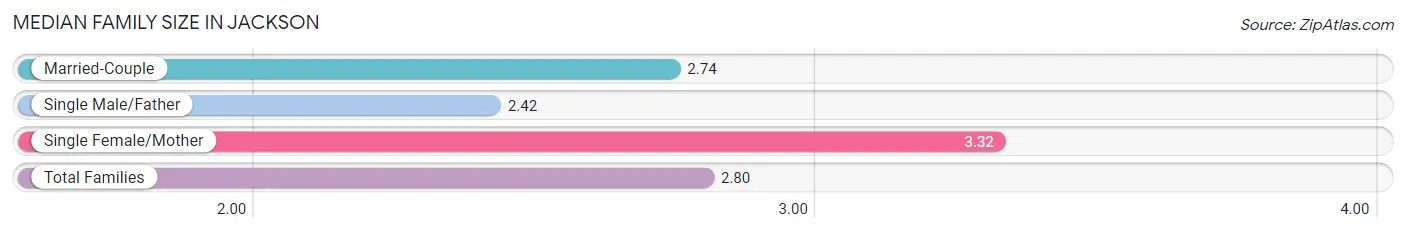
The median family size in Jackson is 2.80 persons per family, with single female/mother families (194 | 14.2%) accounting for the largest median family size of 3.32 persons per family. On the other hand, single male/father families (100 | 7.3%) represent the smallest median family size with 2.42 persons per family.
| Family Type | # Families | Family Size |
| Married-Couple | 1,069 (78.4%) | 2.74 |
| Single Male/Father | 100 (7.3%) | 2.42 |
| Single Female/Mother | 194 (14.2%) | 3.32 |
| Total Families | 1,363 (100.0%) | 2.80 |
Median Household Size in Jackson
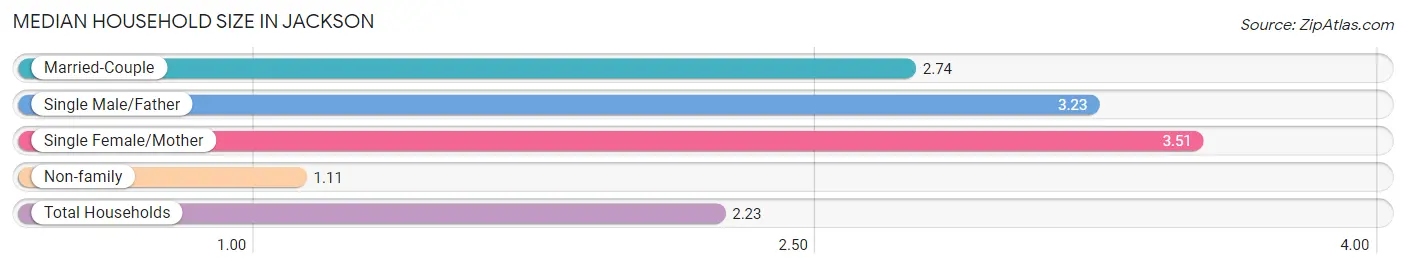
The median household size in Jackson is 2.23 persons per household, with single female/mother households (194 | 9.0%) accounting for the largest median household size of 3.51 persons per household. non-family households (803 | 37.1%) represent the smallest median household size with 1.11 persons per household.
| Household Type | # Households | Household Size |
| Married-Couple | 1,069 (49.3%) | 2.74 |
| Single Male/Father | 100 (4.6%) | 3.23 |
| Single Female/Mother | 194 (9.0%) | 3.51 |
| Non-family | 803 (37.1%) | 1.11 |
| Total Households | 2,166 (100.0%) | 2.23 |
Household Size by Marriage Status in Jackson
Out of a total of 2,166 households in Jackson, 1,363 (62.9%) are family households, while 803 (37.1%) are nonfamily households. The most numerous type of family households are 2-person households, comprising 796, and the most common type of nonfamily households are 1-person households, comprising 734.
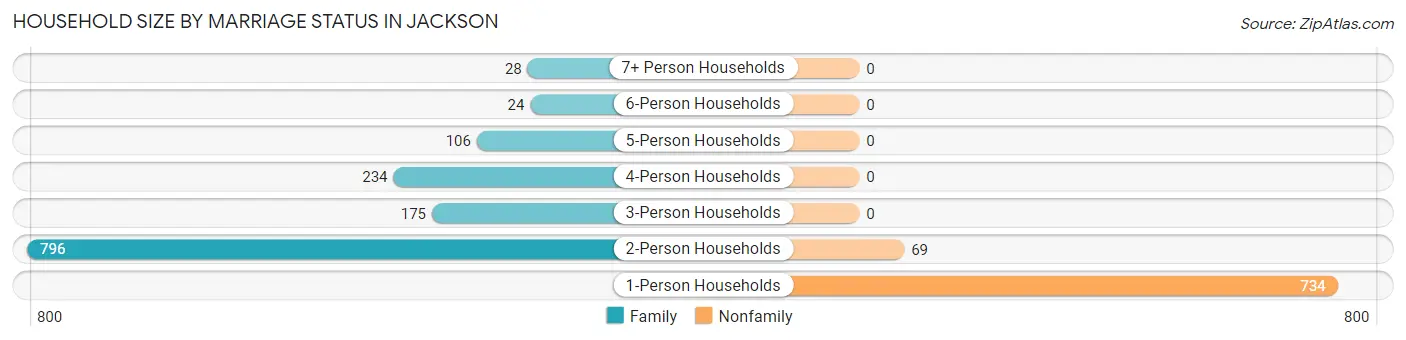
| Household Size | Family Households | Nonfamily Households |
| 1-Person Households | - | 734 (33.9%) |
| 2-Person Households | 796 (36.7%) | 69 (3.2%) |
| 3-Person Households | 175 (8.1%) | 0 (0.0%) |
| 4-Person Households | 234 (10.8%) | 0 (0.0%) |
| 5-Person Households | 106 (4.9%) | 0 (0.0%) |
| 6-Person Households | 24 (1.1%) | 0 (0.0%) |
| 7+ Person Households | 28 (1.3%) | 0 (0.0%) |
| Total | 1,363 (62.9%) | 803 (37.1%) |
Female Fertility in Jackson
Fertility by Age in Jackson
Average fertility rate in Jackson is 57.0 births per 1,000 women. Women in the age bracket of 20 to 34 years have the highest fertility rate with 75.0 births per 1,000 women. Women in the age bracket of 20 to 34 years acount for 77.8% of all women with births.
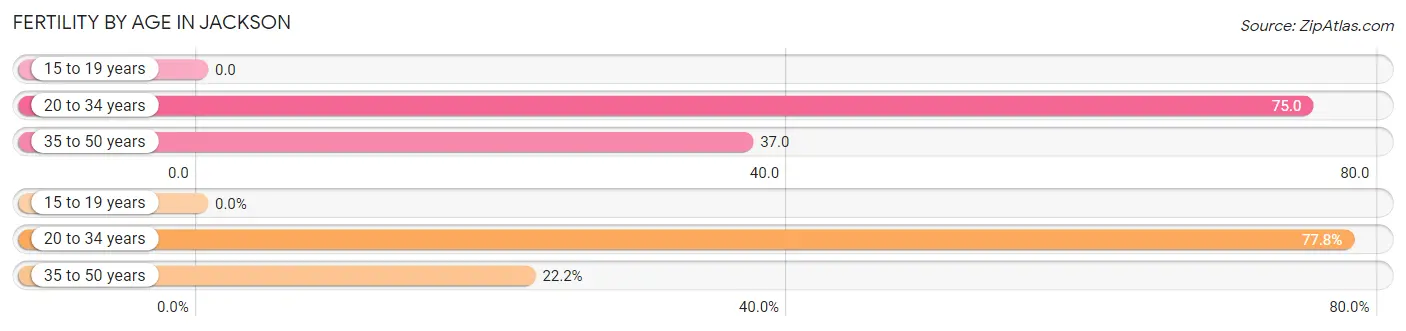
| Age Bracket | Women with Births | Births / 1,000 Women |
| 15 to 19 years | 0 (0.0%) | 0.0 |
| 20 to 34 years | 42 (77.8%) | 75.0 |
| 35 to 50 years | 12 (22.2%) | 37.0 |
| Total | 54 (100.0%) | 57.0 |
Fertility by Age by Marriage Status in Jackson
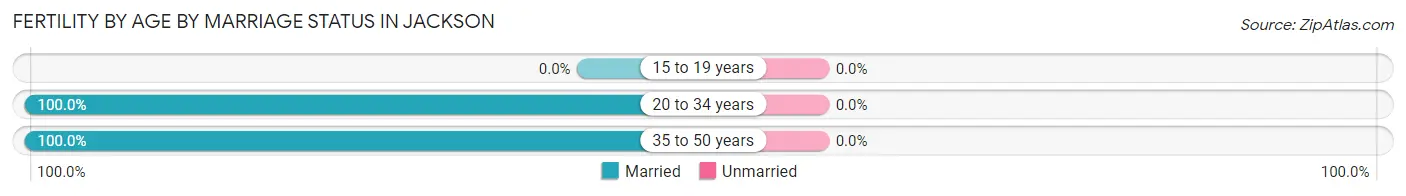
| Age Bracket | Married | Unmarried |
| 15 to 19 years | 0 (0.0%) | 0 (0.0%) |
| 20 to 34 years | 42 (100.0%) | 0 (0.0%) |
| 35 to 50 years | 12 (100.0%) | 0 (0.0%) |
| Total | 54 (100.0%) | 0 (0.0%) |
Fertility by Education in Jackson
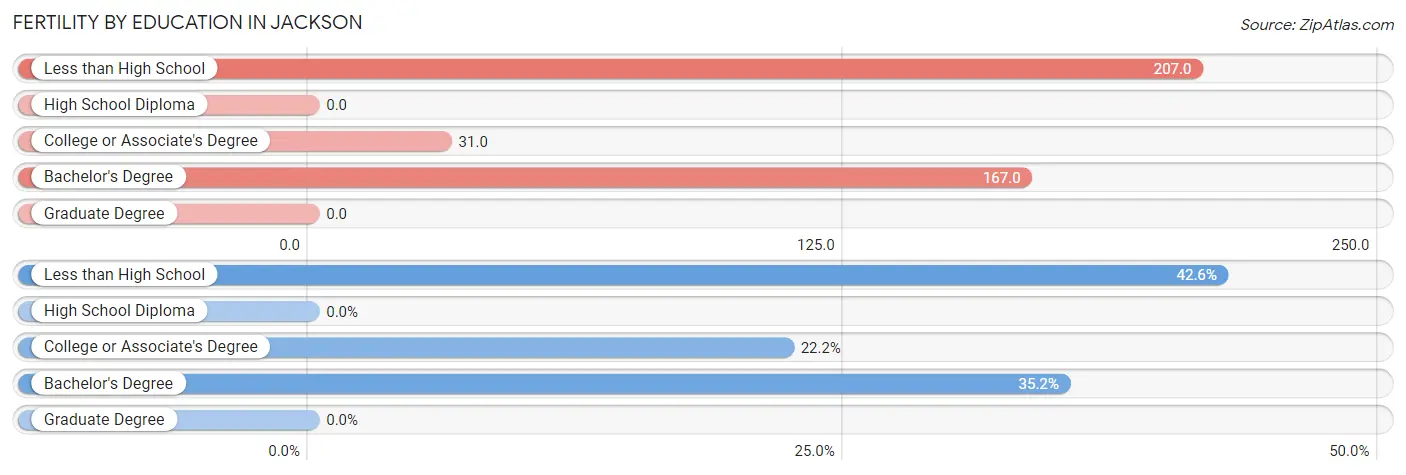
| Educational Attainment | Women with Births | Births / 1,000 Women |
| Less than High School | 23 (42.6%) | 207.0 |
| High School Diploma | 0 (0.0%) | 0.0 |
| College or Associate's Degree | 12 (22.2%) | 31.0 |
| Bachelor's Degree | 19 (35.2%) | 167.0 |
| Graduate Degree | 0 (0.0%) | 0.0 |
| Total | 54 (100.0%) | 57.0 |
Fertility by Education by Marriage Status in Jackson
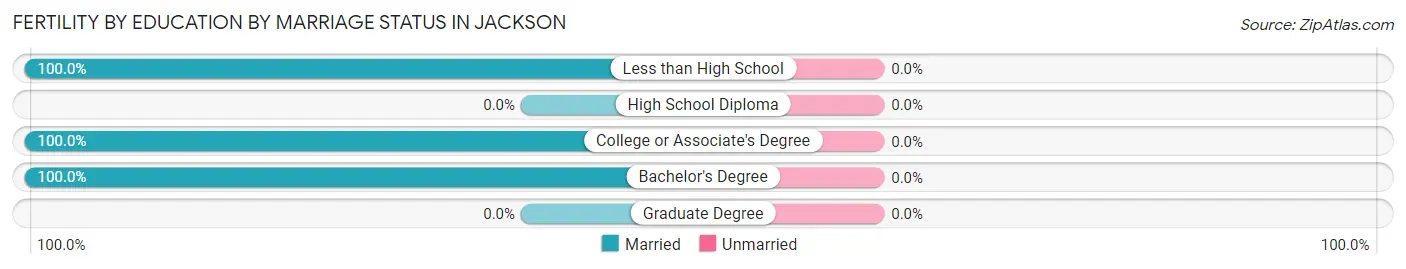
| Educational Attainment | Married | Unmarried |
| Less than High School | 23 (100.0%) | 0 (0.0%) |
| High School Diploma | 0 (0.0%) | 0 (0.0%) |
| College or Associate's Degree | 12 (100.0%) | 0 (0.0%) |
| Bachelor's Degree | 19 (100.0%) | 0 (0.0%) |
| Graduate Degree | 0 (0.0%) | 0 (0.0%) |
| Total | 54 (100.0%) | 0 (0.0%) |
Employment Characteristics in Jackson
Employment by Class of Employer in Jackson
Among the 2,023 employed individuals in Jackson, private company employees (1,362 | 67.3%), self-employed (not incorporated) (202 | 10.0%), and local government employees (143 | 7.1%) make up the most common classes of employment.
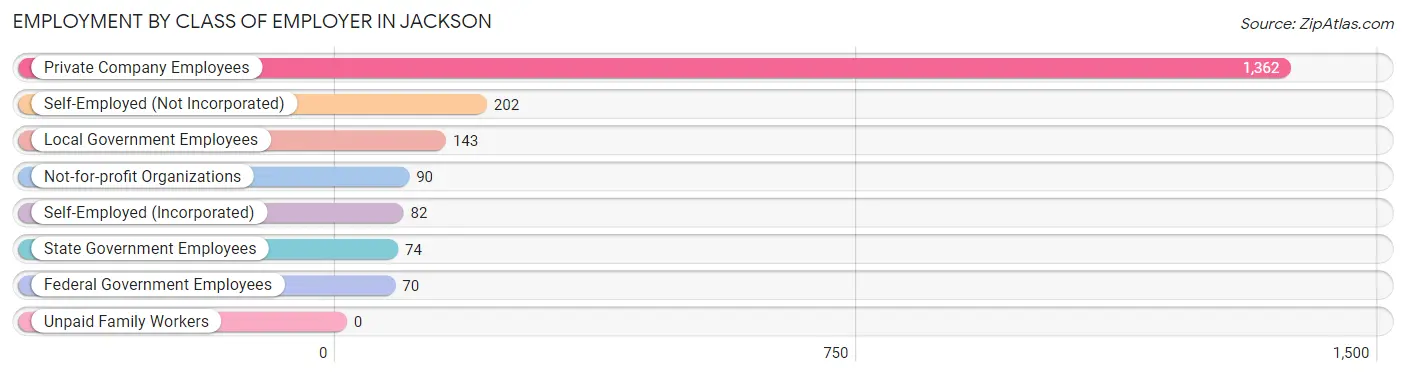
| Employer Class | # Employees | % Employees |
| Private Company Employees | 1,362 | 67.3% |
| Self-Employed (Incorporated) | 82 | 4.1% |
| Self-Employed (Not Incorporated) | 202 | 10.0% |
| Not-for-profit Organizations | 90 | 4.4% |
| Local Government Employees | 143 | 7.1% |
| State Government Employees | 74 | 3.7% |
| Federal Government Employees | 70 | 3.5% |
| Unpaid Family Workers | 0 | 0.0% |
| Total | 2,023 | 100.0% |
Employment Status by Age in Jackson
According to the labor force statistics for Jackson, out of the total population over 16 years of age (4,199), 50.7% or 2,129 individuals are in the labor force, with 5.0% or 106 of them unemployed. The age group with the highest labor force participation rate is 20 to 24 years, with 87.7% or 476 individuals in the labor force. Within the labor force, the 60 to 64 years age range has the highest percentage of unemployed individuals, with 12.8% or 12 of them being unemployed.
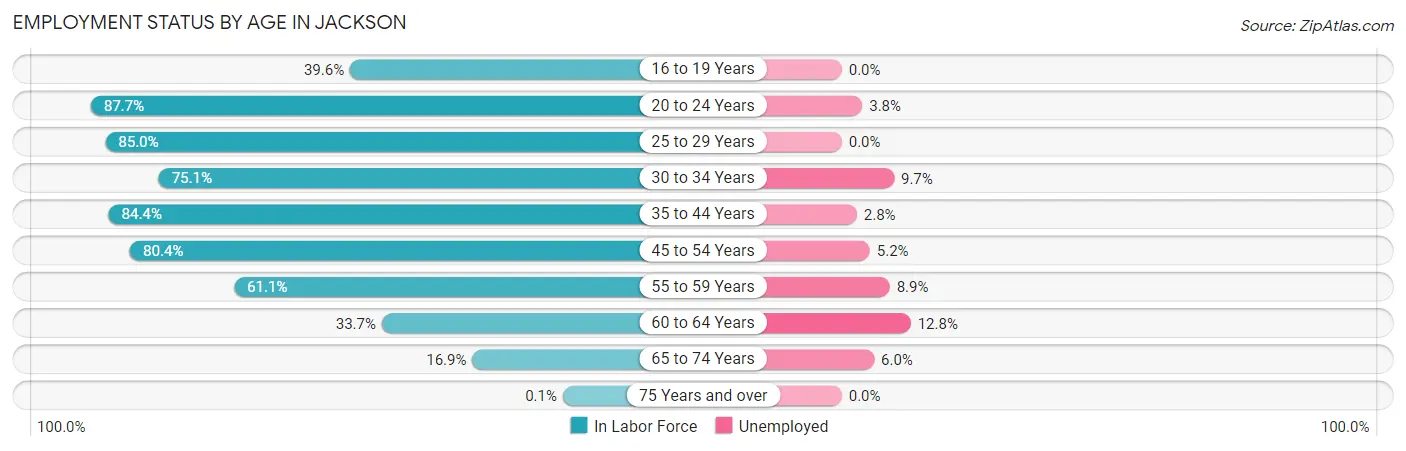
| Age Bracket | In Labor Force | Unemployed |
| 16 to 19 Years | 44 (39.6%) | 0 (0.0%) |
| 20 to 24 Years | 476 (87.7%) | 18 (3.8%) |
| 25 to 29 Years | 187 (85.0%) | 0 (0.0%) |
| 30 to 34 Years | 286 (75.1%) | 28 (9.7%) |
| 35 to 44 Years | 427 (84.4%) | 12 (2.8%) |
| 45 to 54 Years | 345 (80.4%) | 18 (5.2%) |
| 55 to 59 Years | 135 (61.1%) | 12 (8.9%) |
| 60 to 64 Years | 94 (33.7%) | 12 (12.8%) |
| 65 to 74 Years | 133 (16.9%) | 8 (6.0%) |
| 75 Years and over | 1 (0.1%) | 0 (0.0%) |
| Total | 2,129 (50.7%) | 106 (5.0%) |
Employment Status by Educational Attainment in Jackson
According to labor force statistics for Jackson, 72.4% of individuals (1,474) out of the total population between 25 and 64 years of age (2,036) are in the labor force, with 5.5% or 81 of them being unemployed. The group with the highest labor force participation rate are those with the educational attainment of bachelor's degree or higher, with 92.6% or 327 individuals in the labor force. Within the labor force, individuals with less than high school education have the highest percentage of unemployment, with 10.5% or 12 of them being unemployed.
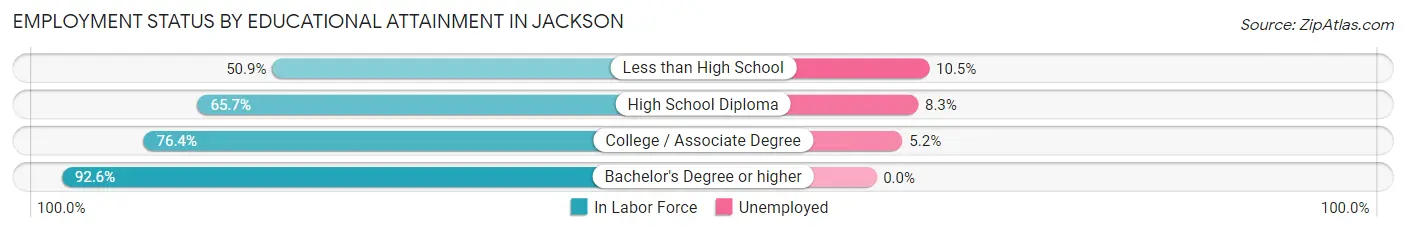
| Educational Attainment | In Labor Force | Unemployed |
| Less than High School | 114 (50.9%) | 24 (10.5%) |
| High School Diploma | 499 (65.7%) | 63 (8.3%) |
| College / Associate Degree | 534 (76.4%) | 36 (5.2%) |
| Bachelor's Degree or higher | 327 (92.6%) | 0 (0.0%) |
| Total | 1,474 (72.4%) | 112 (5.5%) |
Employment Occupations by Sex in Jackson
Management, Business, Science and Arts Occupations
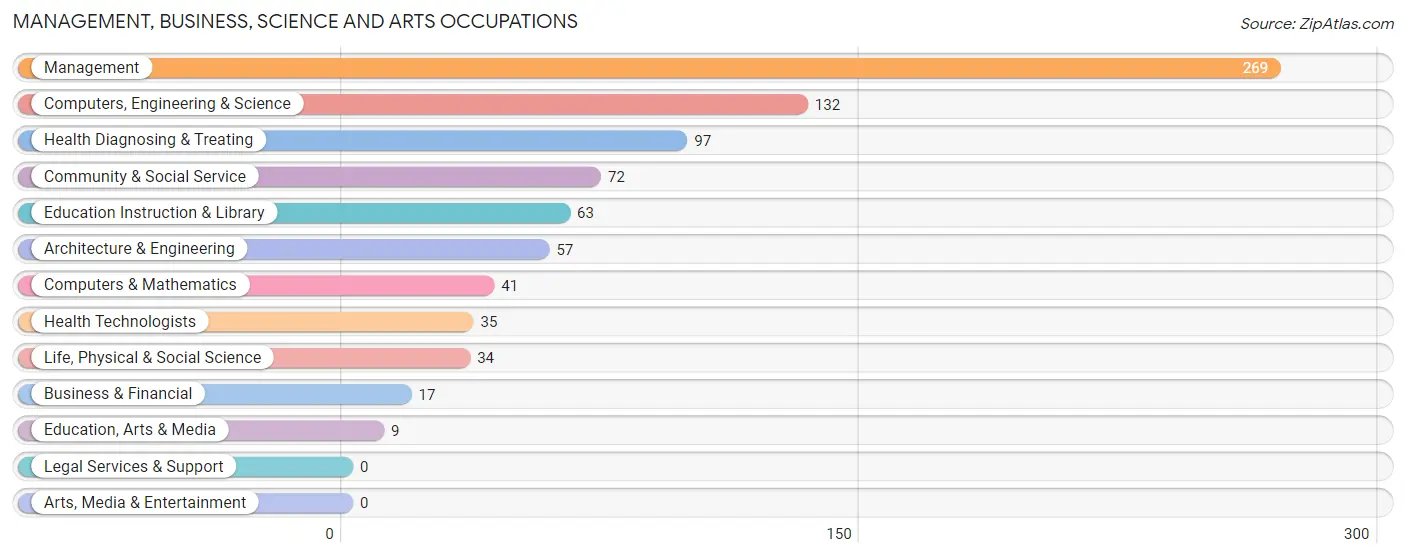
The most common Management, Business, Science and Arts occupations in Jackson are Management (269 | 13.5%), Computers, Engineering & Science (132 | 6.6%), Health Diagnosing & Treating (97 | 4.9%), Community & Social Service (72 | 3.6%), and Education Instruction & Library (63 | 3.2%).
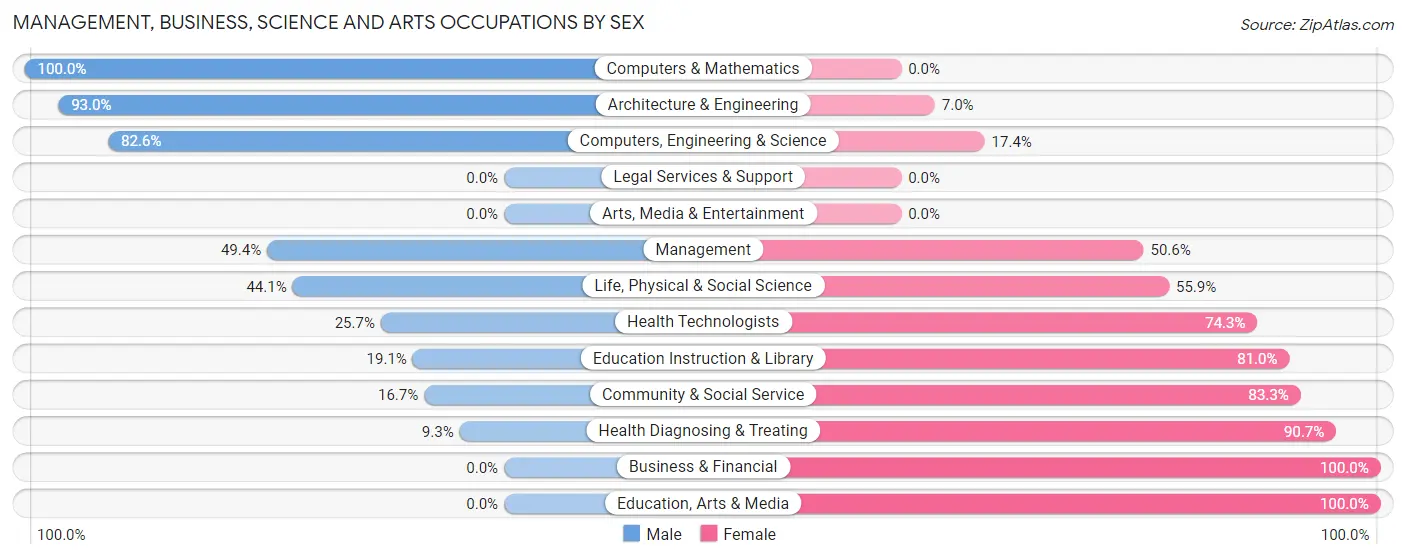
Management, Business, Science and Arts Occupations by Sex
Within the Management, Business, Science and Arts occupations in Jackson, the most male-oriented occupations are Computers & Mathematics (100.0%), Architecture & Engineering (93.0%), and Computers, Engineering & Science (82.6%), while the most female-oriented occupations are Business & Financial (100.0%), Education, Arts & Media (100.0%), and Health Diagnosing & Treating (90.7%).
| Occupation | Male | Female |
| Management | 133 (49.4%) | 136 (50.6%) |
| Business & Financial | 0 (0.0%) | 17 (100.0%) |
| Computers, Engineering & Science | 109 (82.6%) | 23 (17.4%) |
| Computers & Mathematics | 41 (100.0%) | 0 (0.0%) |
| Architecture & Engineering | 53 (93.0%) | 4 (7.0%) |
| Life, Physical & Social Science | 15 (44.1%) | 19 (55.9%) |
| Community & Social Service | 12 (16.7%) | 60 (83.3%) |
| Education, Arts & Media | 0 (0.0%) | 9 (100.0%) |
| Legal Services & Support | 0 (0.0%) | 0 (0.0%) |
| Education Instruction & Library | 12 (19.1%) | 51 (80.9%) |
| Arts, Media & Entertainment | 0 (0.0%) | 0 (0.0%) |
| Health Diagnosing & Treating | 9 (9.3%) | 88 (90.7%) |
| Health Technologists | 9 (25.7%) | 26 (74.3%) |
| Total (Category) | 263 (44.8%) | 324 (55.2%) |
| Total (Overall) | 1,022 (51.2%) | 974 (48.8%) |
Services Occupations
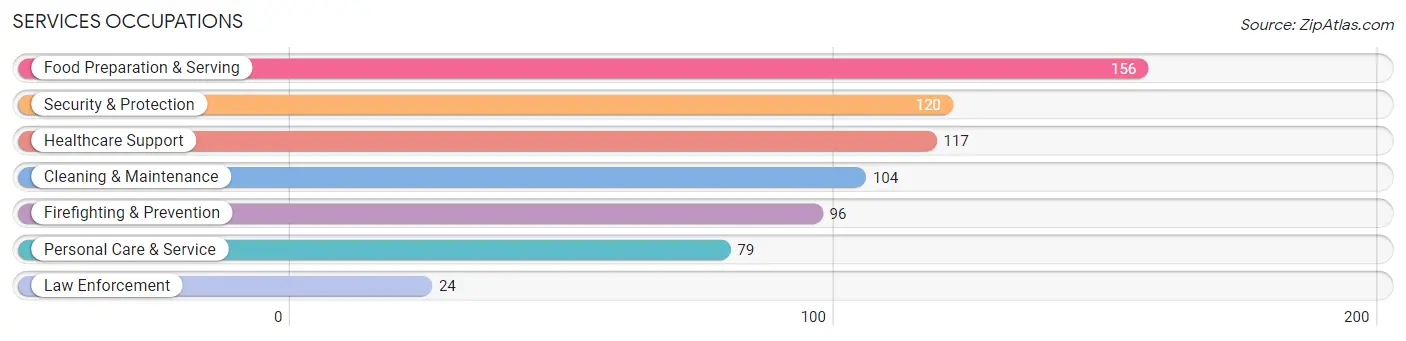
The most common Services occupations in Jackson are Food Preparation & Serving (156 | 7.8%), Security & Protection (120 | 6.0%), Healthcare Support (117 | 5.9%), Cleaning & Maintenance (104 | 5.2%), and Firefighting & Prevention (96 | 4.8%).
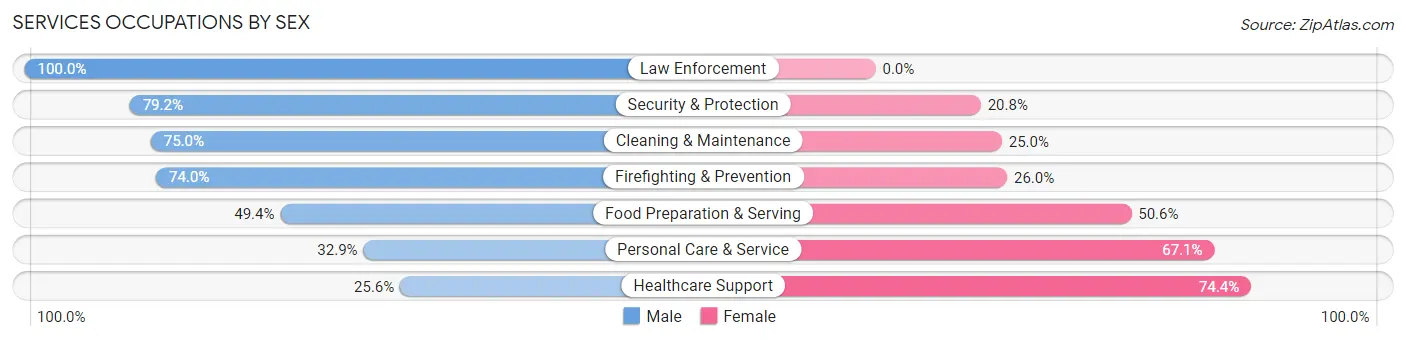
Services Occupations by Sex
Within the Services occupations in Jackson, the most male-oriented occupations are Law Enforcement (100.0%), Security & Protection (79.2%), and Cleaning & Maintenance (75.0%), while the most female-oriented occupations are Healthcare Support (74.4%), Personal Care & Service (67.1%), and Food Preparation & Serving (50.6%).
| Occupation | Male | Female |
| Healthcare Support | 30 (25.6%) | 87 (74.4%) |
| Security & Protection | 95 (79.2%) | 25 (20.8%) |
| Firefighting & Prevention | 71 (74.0%) | 25 (26.0%) |
| Law Enforcement | 24 (100.0%) | 0 (0.0%) |
| Food Preparation & Serving | 77 (49.4%) | 79 (50.6%) |
| Cleaning & Maintenance | 78 (75.0%) | 26 (25.0%) |
| Personal Care & Service | 26 (32.9%) | 53 (67.1%) |
| Total (Category) | 306 (53.1%) | 270 (46.9%) |
| Total (Overall) | 1,022 (51.2%) | 974 (48.8%) |
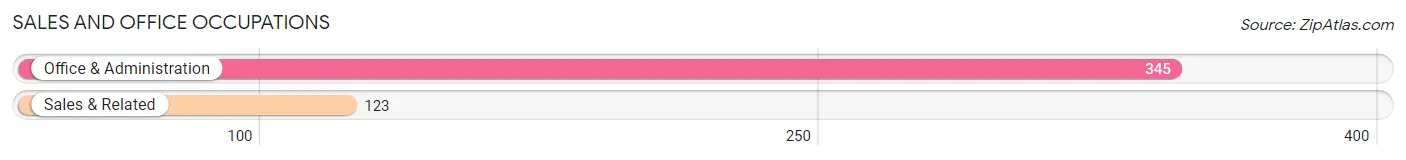
Sales and Office Occupations
The most common Sales and Office occupations in Jackson are Office & Administration (345 | 17.3%), and Sales & Related (123 | 6.2%).
Sales and Office Occupations by Sex
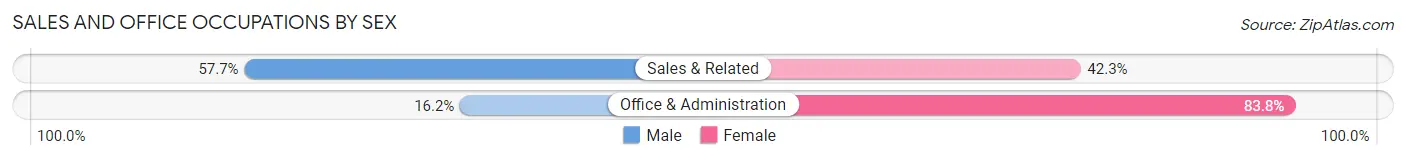
| Occupation | Male | Female |
| Sales & Related | 71 (57.7%) | 52 (42.3%) |
| Office & Administration | 56 (16.2%) | 289 (83.8%) |
| Total (Category) | 127 (27.1%) | 341 (72.9%) |
| Total (Overall) | 1,022 (51.2%) | 974 (48.8%) |
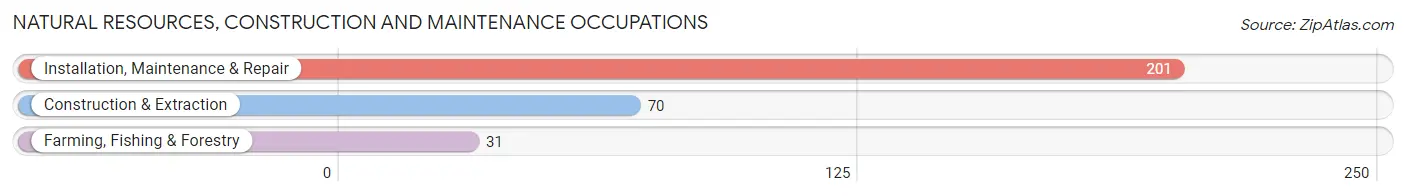
Natural Resources, Construction and Maintenance Occupations
The most common Natural Resources, Construction and Maintenance occupations in Jackson are Installation, Maintenance & Repair (201 | 10.1%), Construction & Extraction (70 | 3.5%), and Farming, Fishing & Forestry (31 | 1.5%).
Natural Resources, Construction and Maintenance Occupations by Sex
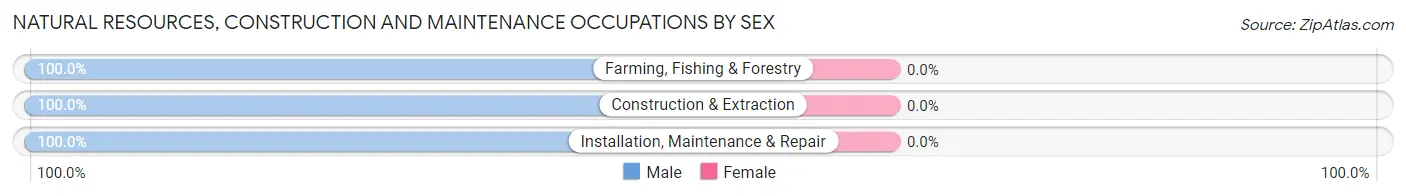
| Occupation | Male | Female |
| Farming, Fishing & Forestry | 31 (100.0%) | 0 (0.0%) |
| Construction & Extraction | 70 (100.0%) | 0 (0.0%) |
| Installation, Maintenance & Repair | 201 (100.0%) | 0 (0.0%) |
| Total (Category) | 302 (100.0%) | 0 (0.0%) |
| Total (Overall) | 1,022 (51.2%) | 974 (48.8%) |
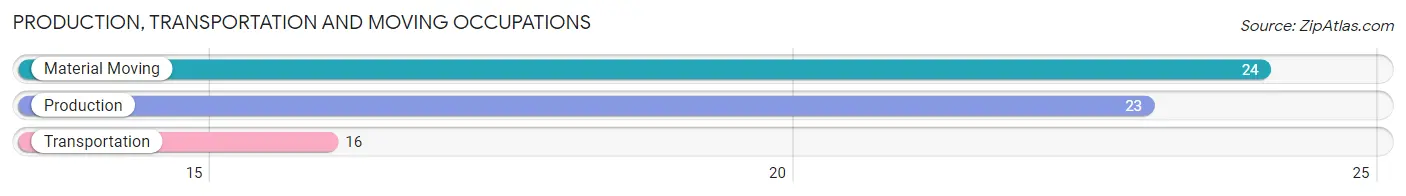
Production, Transportation and Moving Occupations
The most common Production, Transportation and Moving occupations in Jackson are Material Moving (24 | 1.2%), Production (23 | 1.1%), and Transportation (16 | 0.8%).
Production, Transportation and Moving Occupations by Sex
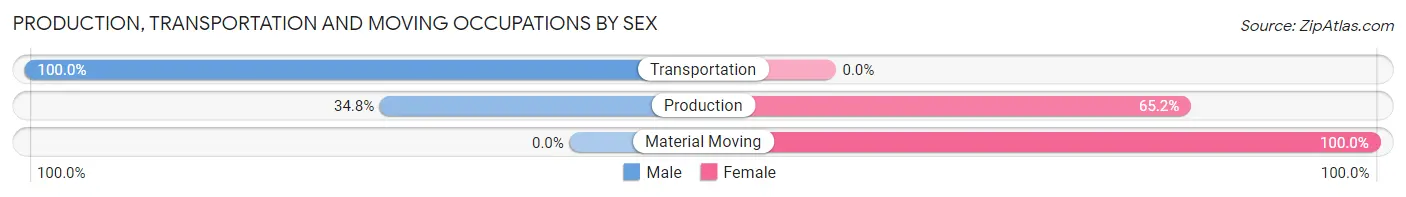
| Occupation | Male | Female |
| Production | 8 (34.8%) | 15 (65.2%) |
| Transportation | 16 (100.0%) | 0 (0.0%) |
| Material Moving | 0 (0.0%) | 24 (100.0%) |
| Total (Category) | 24 (38.1%) | 39 (61.9%) |
| Total (Overall) | 1,022 (51.2%) | 974 (48.8%) |
Employment Industries by Sex in Jackson
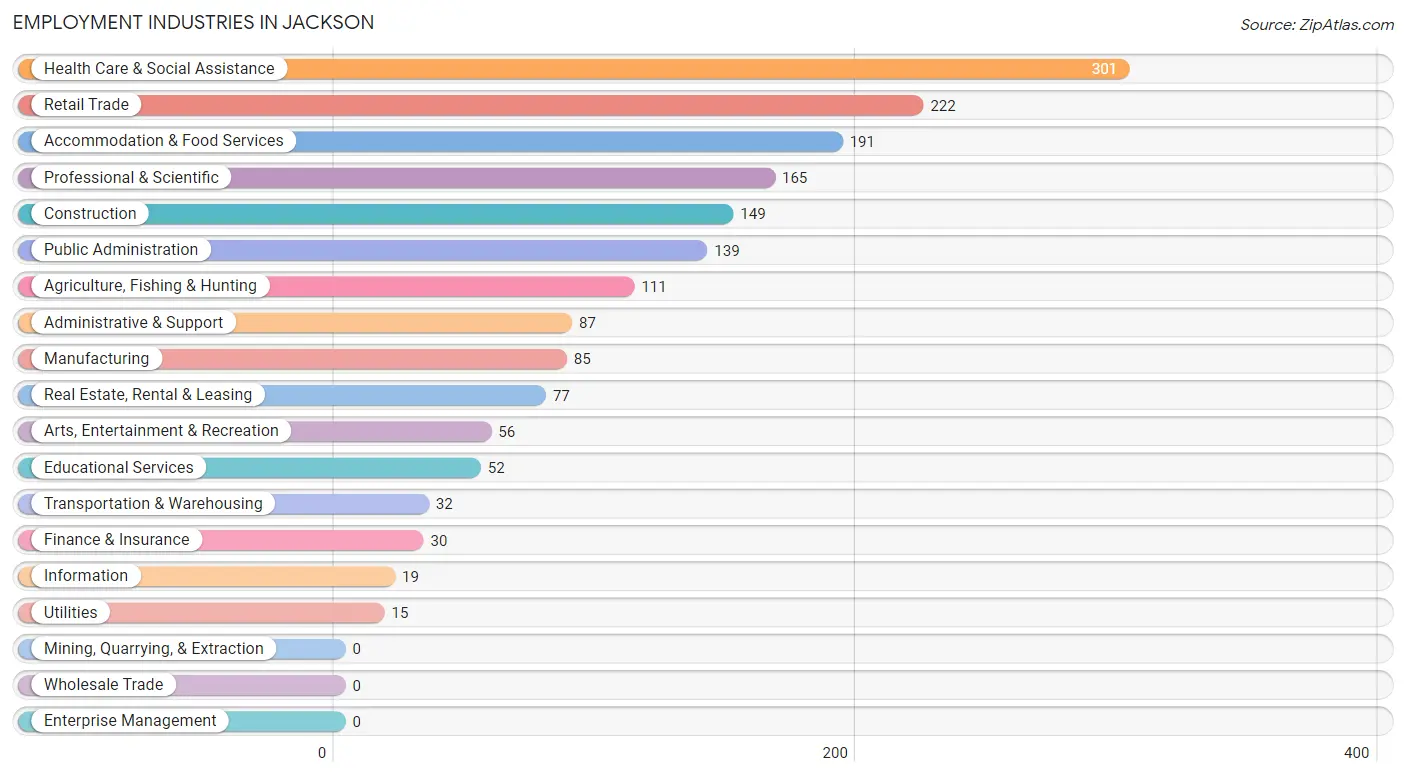
Employment Industries in Jackson
The major employment industries in Jackson include Health Care & Social Assistance (301 | 15.1%), Retail Trade (222 | 11.1%), Accommodation & Food Services (191 | 9.6%), Professional & Scientific (165 | 8.3%), and Construction (149 | 7.5%).
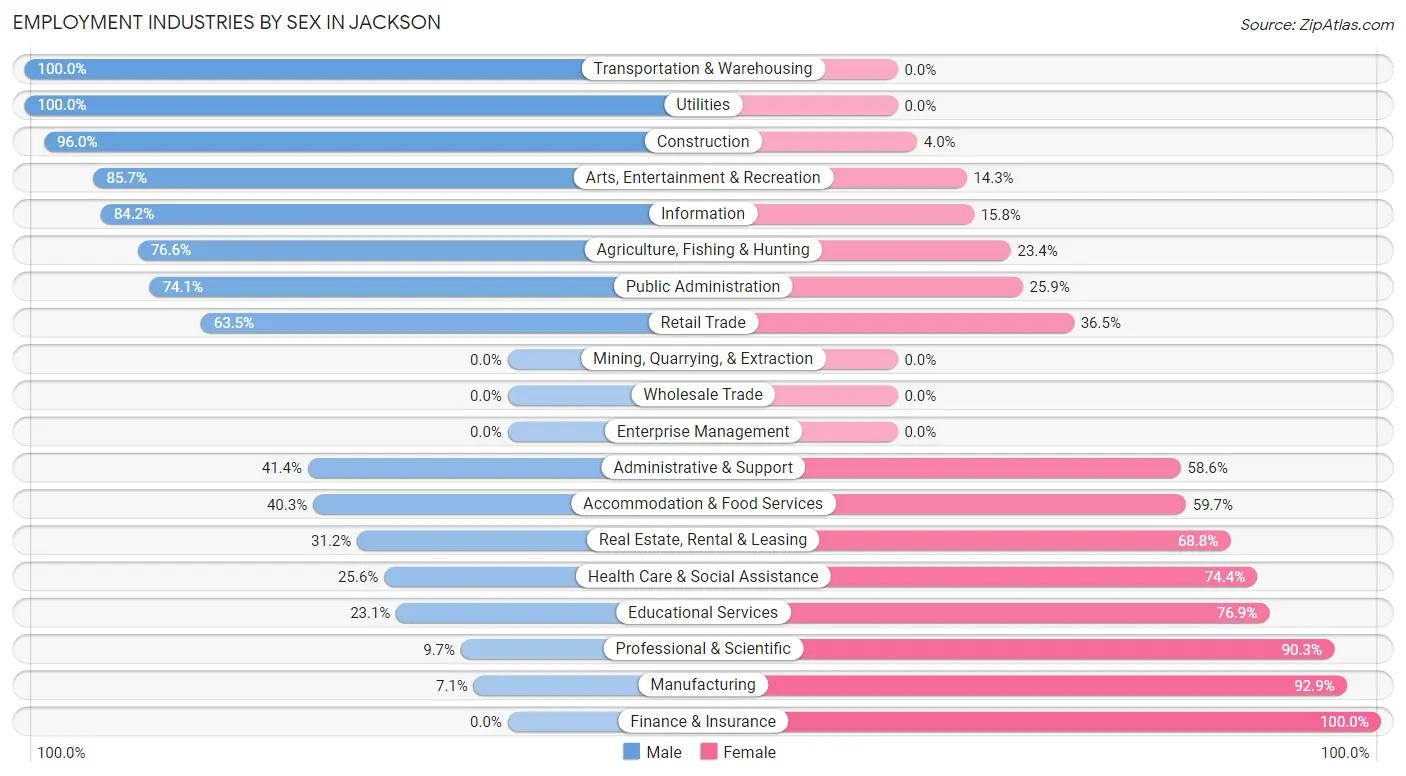
Employment Industries by Sex in Jackson
The Jackson industries that see more men than women are Transportation & Warehousing (100.0%), Utilities (100.0%), and Construction (96.0%), whereas the industries that tend to have a higher number of women are Finance & Insurance (100.0%), Manufacturing (92.9%), and Professional & Scientific (90.3%).
| Industry | Male | Female |
| Agriculture, Fishing & Hunting | 85 (76.6%) | 26 (23.4%) |
| Mining, Quarrying, & Extraction | 0 (0.0%) | 0 (0.0%) |
| Construction | 143 (96.0%) | 6 (4.0%) |
| Manufacturing | 6 (7.1%) | 79 (92.9%) |
| Wholesale Trade | 0 (0.0%) | 0 (0.0%) |
| Retail Trade | 141 (63.5%) | 81 (36.5%) |
| Transportation & Warehousing | 32 (100.0%) | 0 (0.0%) |
| Utilities | 15 (100.0%) | 0 (0.0%) |
| Information | 16 (84.2%) | 3 (15.8%) |
| Finance & Insurance | 0 (0.0%) | 30 (100.0%) |
| Real Estate, Rental & Leasing | 24 (31.2%) | 53 (68.8%) |
| Professional & Scientific | 16 (9.7%) | 149 (90.3%) |
| Enterprise Management | 0 (0.0%) | 0 (0.0%) |
| Administrative & Support | 36 (41.4%) | 51 (58.6%) |
| Educational Services | 12 (23.1%) | 40 (76.9%) |
| Health Care & Social Assistance | 77 (25.6%) | 224 (74.4%) |
| Arts, Entertainment & Recreation | 48 (85.7%) | 8 (14.3%) |
| Accommodation & Food Services | 77 (40.3%) | 114 (59.7%) |
| Public Administration | 103 (74.1%) | 36 (25.9%) |
| Total | 1,022 (51.2%) | 974 (48.8%) |
Education in Jackson
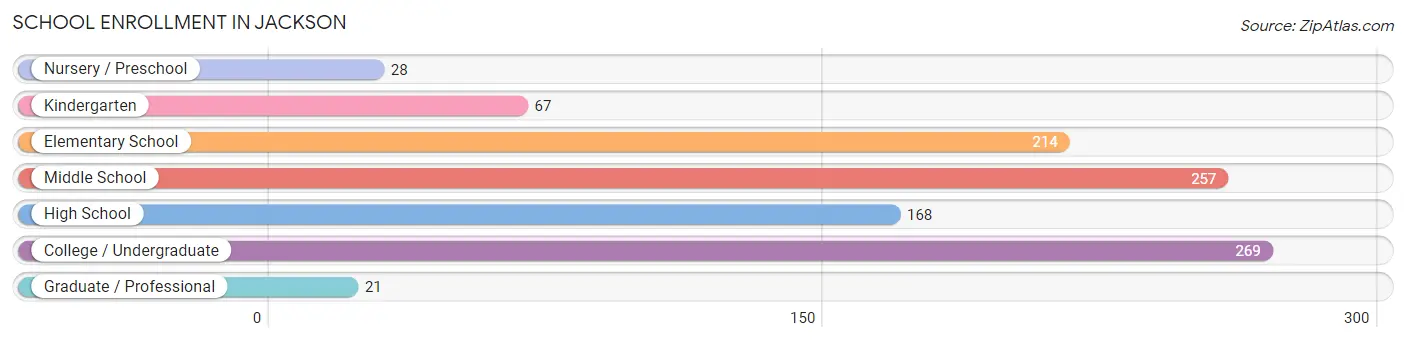
School Enrollment in Jackson
The most common levels of schooling among the 1,024 students in Jackson are college / undergraduate (269 | 26.3%), middle school (257 | 25.1%), and elementary school (214 | 20.9%).
| School Level | # Students | % Students |
| Nursery / Preschool | 28 | 2.7% |
| Kindergarten | 67 | 6.5% |
| Elementary School | 214 | 20.9% |
| Middle School | 257 | 25.1% |
| High School | 168 | 16.4% |
| College / Undergraduate | 269 | 26.3% |
| Graduate / Professional | 21 | 2.1% |
| Total | 1,024 | 100.0% |
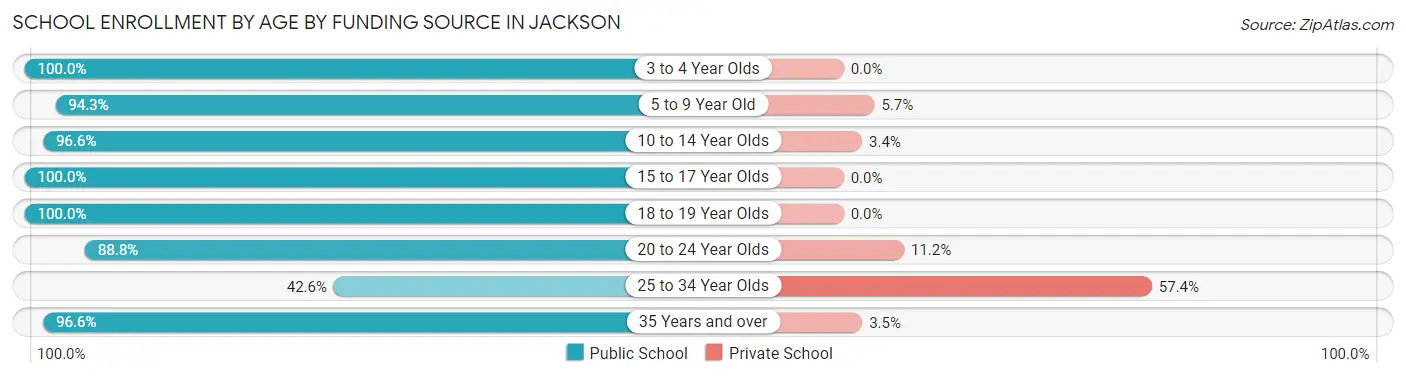
School Enrollment by Age by Funding Source in Jackson
Out of a total of 1,024 students who are enrolled in schools in Jackson, 70 (6.8%) attend a private institution, while the remaining 954 (93.2%) are enrolled in public schools. The age group of 25 to 34 year olds has the highest likelihood of being enrolled in private schools, with 31 (57.4% in the age bracket) enrolled. Conversely, the age group of 3 to 4 year olds has the lowest likelihood of being enrolled in a private school, with 28 (100.0% in the age bracket) attending a public institution.
| Age Bracket | Public School | Private School |
| 3 to 4 Year Olds | 28 (100.0%) | 0 (0.0%) |
| 5 to 9 Year Old | 197 (94.3%) | 12 (5.7%) |
| 10 to 14 Year Olds | 338 (96.6%) | 12 (3.4%) |
| 15 to 17 Year Olds | 116 (100.0%) | 0 (0.0%) |
| 18 to 19 Year Olds | 33 (100.0%) | 0 (0.0%) |
| 20 to 24 Year Olds | 79 (88.8%) | 10 (11.2%) |
| 25 to 34 Year Olds | 23 (42.6%) | 31 (57.4%) |
| 35 Years and over | 140 (96.6%) | 5 (3.5%) |
| Total | 954 (93.2%) | 70 (6.8%) |
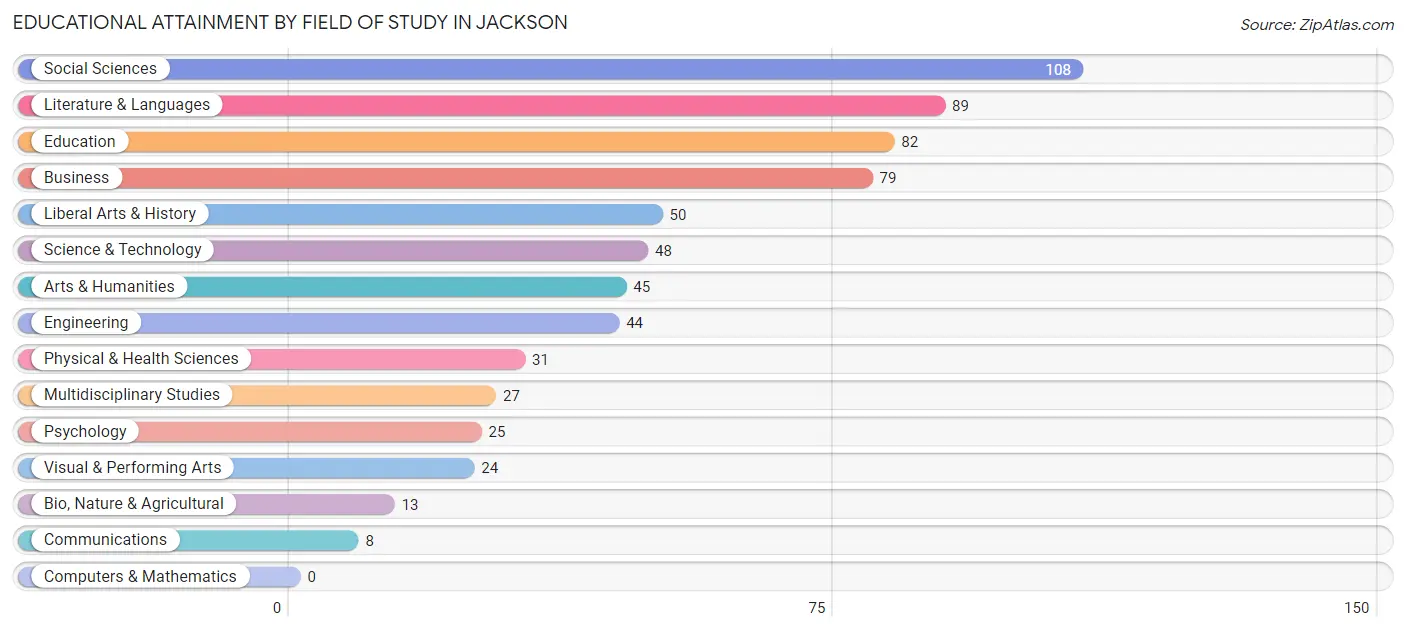
Educational Attainment by Field of Study in Jackson
Social sciences (108 | 16.1%), literature & languages (89 | 13.2%), education (82 | 12.2%), business (79 | 11.7%), and liberal arts & history (50 | 7.4%) are the most common fields of study among 673 individuals in Jackson who have obtained a bachelor's degree or higher.
| Field of Study | # Graduates | % Graduates |
| Computers & Mathematics | 0 | 0.0% |
| Bio, Nature & Agricultural | 13 | 1.9% |
| Physical & Health Sciences | 31 | 4.6% |
| Psychology | 25 | 3.7% |
| Social Sciences | 108 | 16.1% |
| Engineering | 44 | 6.5% |
| Multidisciplinary Studies | 27 | 4.0% |
| Science & Technology | 48 | 7.1% |
| Business | 79 | 11.7% |
| Education | 82 | 12.2% |
| Literature & Languages | 89 | 13.2% |
| Liberal Arts & History | 50 | 7.4% |
| Visual & Performing Arts | 24 | 3.6% |
| Communications | 8 | 1.2% |
| Arts & Humanities | 45 | 6.7% |
| Total | 673 | 100.0% |
Transportation & Commute in Jackson
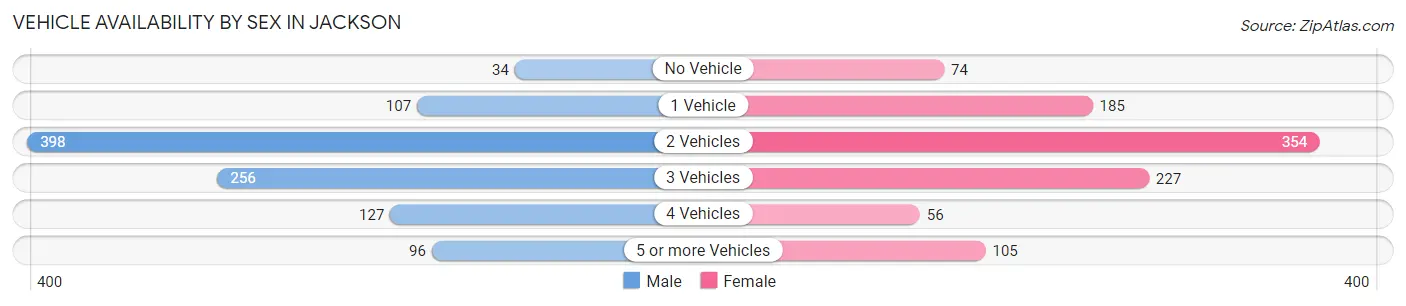
Vehicle Availability by Sex in Jackson
The most prevalent vehicle ownership categories in Jackson are males with 2 vehicles (398, accounting for 39.1%) and females with 2 vehicles (354, making up 39.8%).
| Vehicles Available | Male | Female |
| No Vehicle | 34 (3.3%) | 74 (7.4%) |
| 1 Vehicle | 107 (10.5%) | 185 (18.5%) |
| 2 Vehicles | 398 (39.1%) | 354 (35.4%) |
| 3 Vehicles | 256 (25.2%) | 227 (22.7%) |
| 4 Vehicles | 127 (12.5%) | 56 (5.6%) |
| 5 or more Vehicles | 96 (9.4%) | 105 (10.5%) |
| Total | 1,018 (100.0%) | 1,001 (100.0%) |
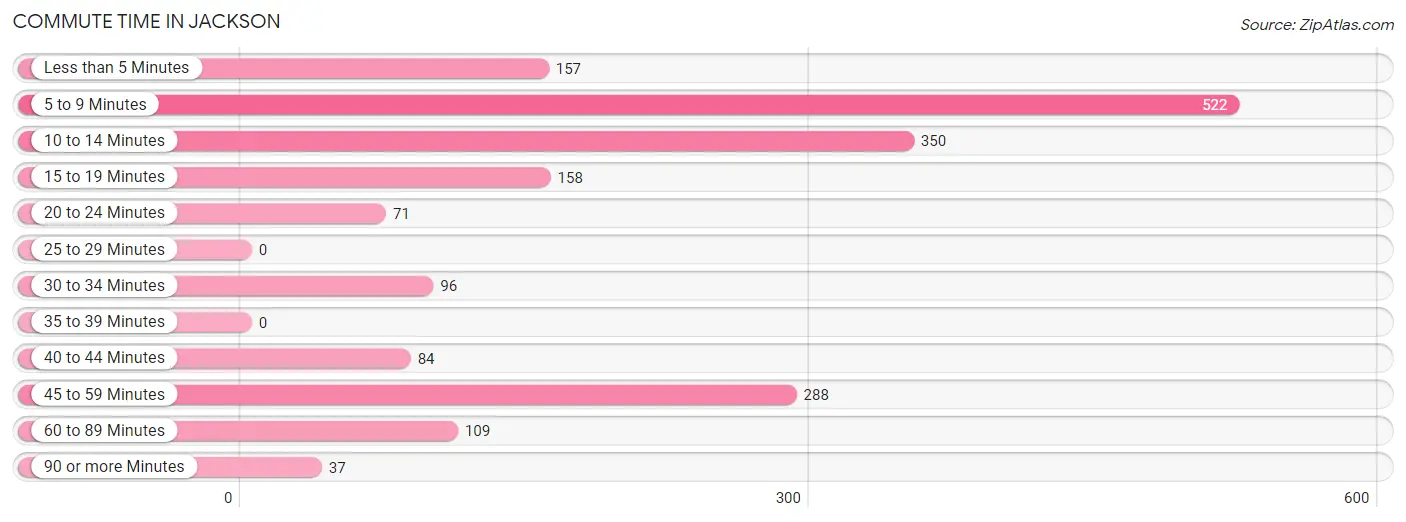
Commute Time in Jackson
The most frequently occuring commute durations in Jackson are 5 to 9 minutes (522 commuters, 27.9%), 10 to 14 minutes (350 commuters, 18.7%), and 45 to 59 minutes (288 commuters, 15.4%).
| Commute Time | # Commuters | % Commuters |
| Less than 5 Minutes | 157 | 8.4% |
| 5 to 9 Minutes | 522 | 27.9% |
| 10 to 14 Minutes | 350 | 18.7% |
| 15 to 19 Minutes | 158 | 8.4% |
| 20 to 24 Minutes | 71 | 3.8% |
| 25 to 29 Minutes | 0 | 0.0% |
| 30 to 34 Minutes | 96 | 5.1% |
| 35 to 39 Minutes | 0 | 0.0% |
| 40 to 44 Minutes | 84 | 4.5% |
| 45 to 59 Minutes | 288 | 15.4% |
| 60 to 89 Minutes | 109 | 5.8% |
| 90 or more Minutes | 37 | 2.0% |
Commute Time by Sex in Jackson
The most common commute times in Jackson are 45 to 59 minutes (241 commuters, 24.9%) for males and 5 to 9 minutes (335 commuters, 37.0%) for females.
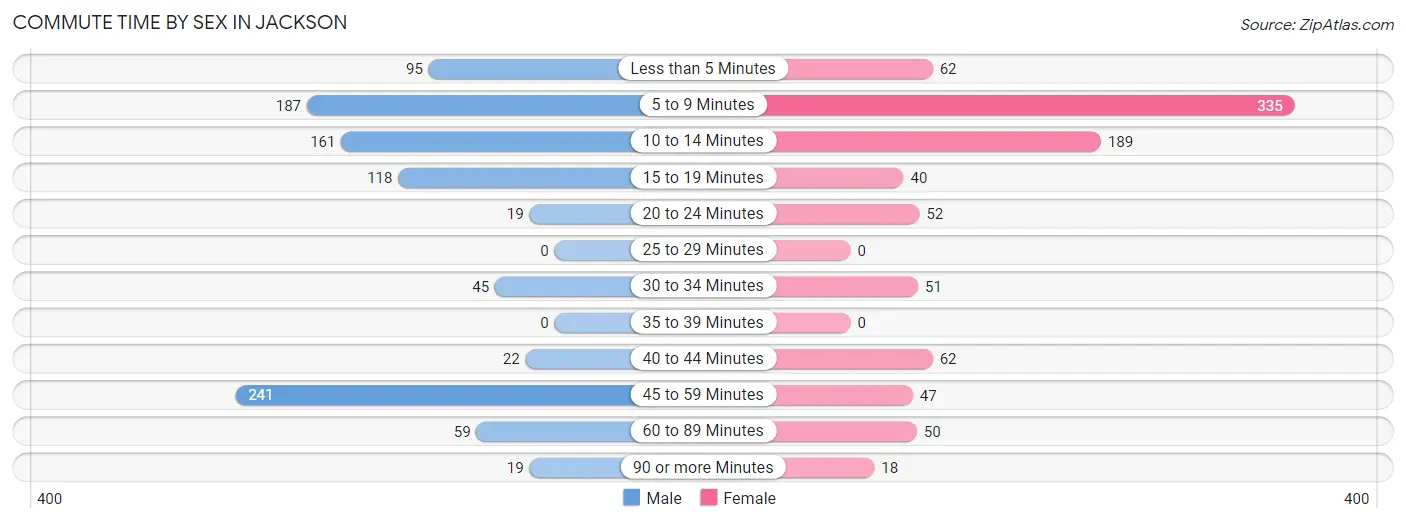
| Commute Time | Male | Female |
| Less than 5 Minutes | 95 (9.8%) | 62 (6.8%) |
| 5 to 9 Minutes | 187 (19.4%) | 335 (37.0%) |
| 10 to 14 Minutes | 161 (16.7%) | 189 (20.9%) |
| 15 to 19 Minutes | 118 (12.2%) | 40 (4.4%) |
| 20 to 24 Minutes | 19 (2.0%) | 52 (5.7%) |
| 25 to 29 Minutes | 0 (0.0%) | 0 (0.0%) |
| 30 to 34 Minutes | 45 (4.7%) | 51 (5.6%) |
| 35 to 39 Minutes | 0 (0.0%) | 0 (0.0%) |
| 40 to 44 Minutes | 22 (2.3%) | 62 (6.8%) |
| 45 to 59 Minutes | 241 (24.9%) | 47 (5.2%) |
| 60 to 89 Minutes | 59 (6.1%) | 50 (5.5%) |
| 90 or more Minutes | 19 (2.0%) | 18 (2.0%) |
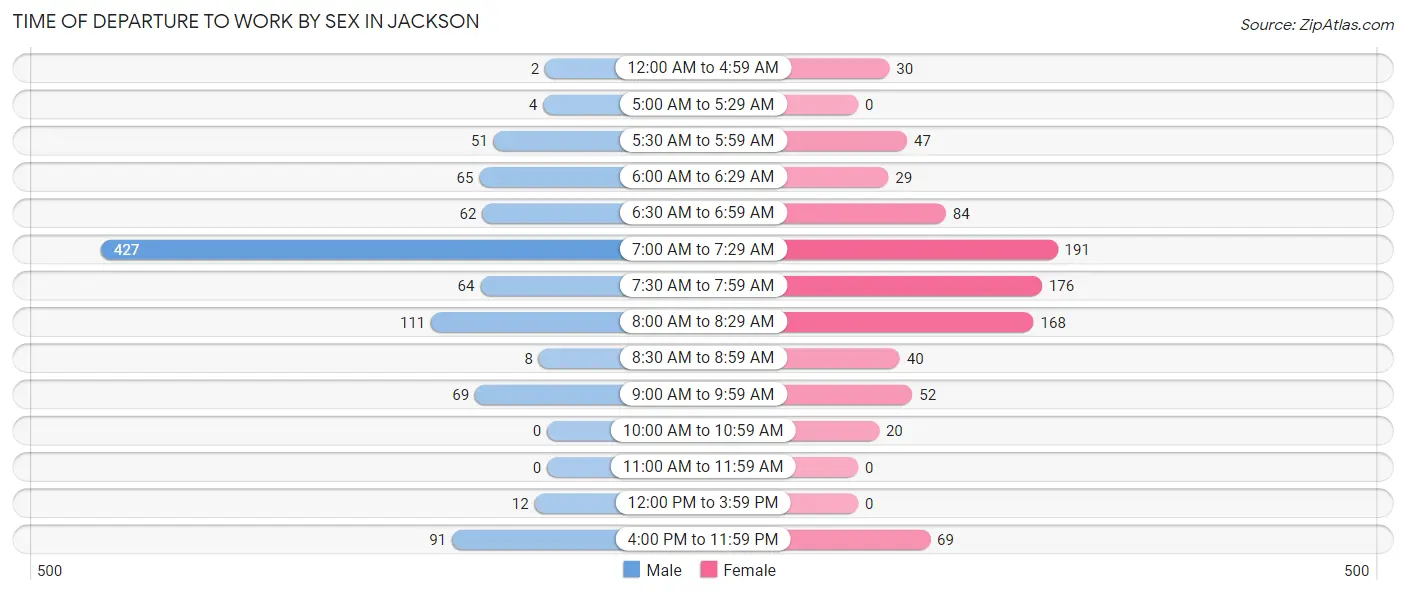
Time of Departure to Work by Sex in Jackson
The most frequent times of departure to work in Jackson are 7:00 AM to 7:29 AM (427, 44.2%) for males and 7:00 AM to 7:29 AM (191, 21.1%) for females.
| Time of Departure | Male | Female |
| 12:00 AM to 4:59 AM | 2 (0.2%) | 30 (3.3%) |
| 5:00 AM to 5:29 AM | 4 (0.4%) | 0 (0.0%) |
| 5:30 AM to 5:59 AM | 51 (5.3%) | 47 (5.2%) |
| 6:00 AM to 6:29 AM | 65 (6.7%) | 29 (3.2%) |
| 6:30 AM to 6:59 AM | 62 (6.4%) | 84 (9.3%) |
| 7:00 AM to 7:29 AM | 427 (44.2%) | 191 (21.1%) |
| 7:30 AM to 7:59 AM | 64 (6.6%) | 176 (19.4%) |
| 8:00 AM to 8:29 AM | 111 (11.5%) | 168 (18.5%) |
| 8:30 AM to 8:59 AM | 8 (0.8%) | 40 (4.4%) |
| 9:00 AM to 9:59 AM | 69 (7.1%) | 52 (5.7%) |
| 10:00 AM to 10:59 AM | 0 (0.0%) | 20 (2.2%) |
| 11:00 AM to 11:59 AM | 0 (0.0%) | 0 (0.0%) |
| 12:00 PM to 3:59 PM | 12 (1.2%) | 0 (0.0%) |
| 4:00 PM to 11:59 PM | 91 (9.4%) | 69 (7.6%) |
| Total | 966 (100.0%) | 906 (100.0%) |
Housing Occupancy in Jackson
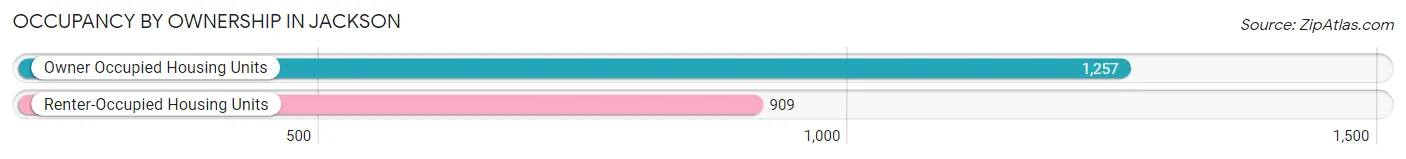
Occupancy by Ownership in Jackson
Of the total 2,166 dwellings in Jackson, owner-occupied units account for 1,257 (58.0%), while renter-occupied units make up 909 (42.0%).
| Occupancy | # Housing Units | % Housing Units |
| Owner Occupied Housing Units | 1,257 | 58.0% |
| Renter-Occupied Housing Units | 909 | 42.0% |
| Total Occupied Housing Units | 2,166 | 100.0% |
Occupancy by Household Size in Jackson
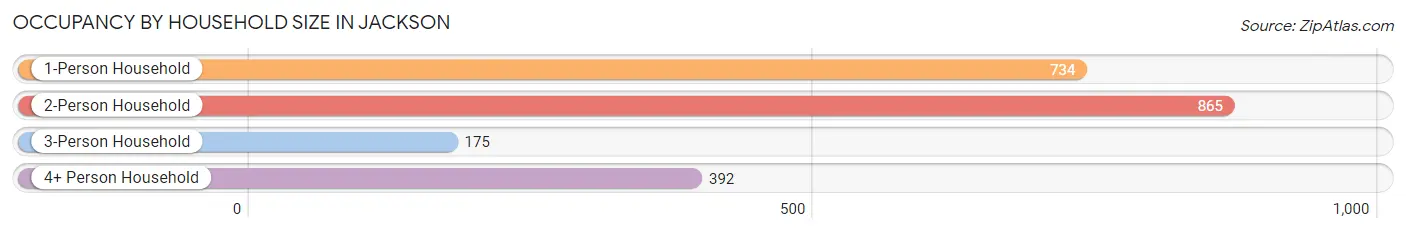
| Household Size | # Housing Units | % Housing Units |
| 1-Person Household | 734 | 33.9% |
| 2-Person Household | 865 | 39.9% |
| 3-Person Household | 175 | 8.1% |
| 4+ Person Household | 392 | 18.1% |
| Total Housing Units | 2,166 | 100.0% |
Occupancy by Ownership by Household Size in Jackson
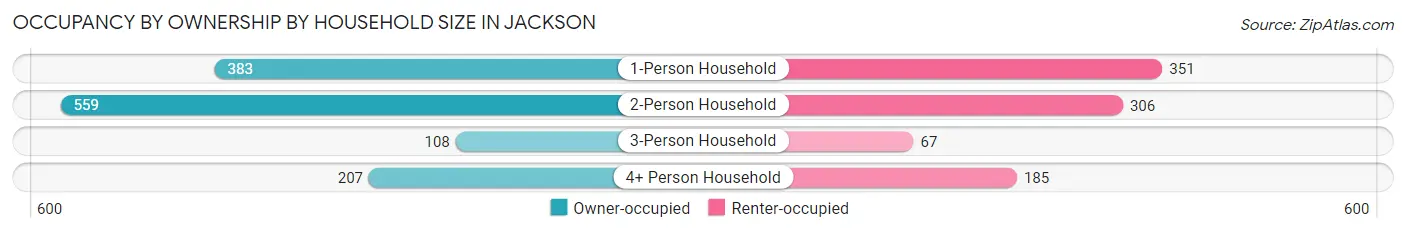
| Household Size | Owner-occupied | Renter-occupied |
| 1-Person Household | 383 (52.2%) | 351 (47.8%) |
| 2-Person Household | 559 (64.6%) | 306 (35.4%) |
| 3-Person Household | 108 (61.7%) | 67 (38.3%) |
| 4+ Person Household | 207 (52.8%) | 185 (47.2%) |
| Total Housing Units | 1,257 (58.0%) | 909 (42.0%) |
Occupancy by Educational Attainment in Jackson
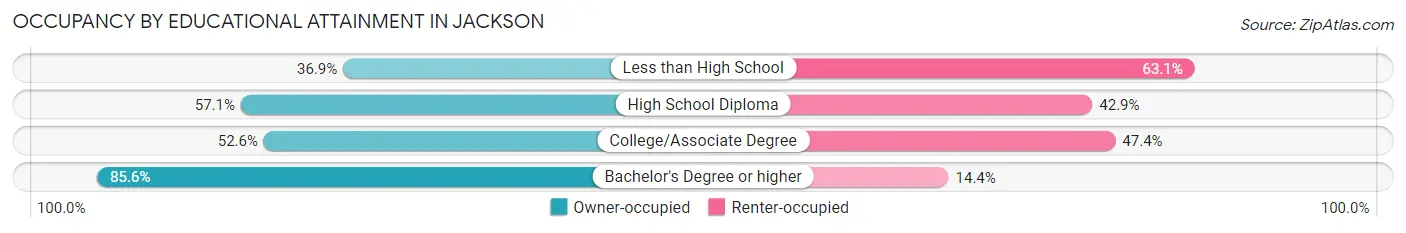
| Household Size | Owner-occupied | Renter-occupied |
| Less than High School | 80 (36.9%) | 137 (63.1%) |
| High School Diploma | 380 (57.1%) | 285 (42.9%) |
| College/Associate Degree | 481 (52.6%) | 434 (47.4%) |
| Bachelor's Degree or higher | 316 (85.6%) | 53 (14.4%) |
Occupancy by Age of Householder in Jackson
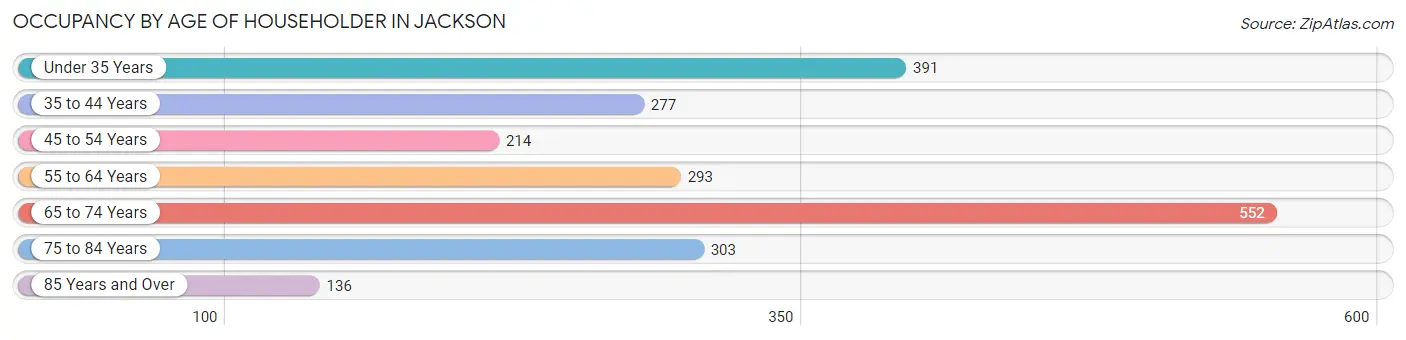
| Age Bracket | # Households | % Households |
| Under 35 Years | 391 | 18.0% |
| 35 to 44 Years | 277 | 12.8% |
| 45 to 54 Years | 214 | 9.9% |
| 55 to 64 Years | 293 | 13.5% |
| 65 to 74 Years | 552 | 25.5% |
| 75 to 84 Years | 303 | 14.0% |
| 85 Years and Over | 136 | 6.3% |
| Total | 2,166 | 100.0% |
Housing Finances in Jackson
Median Income by Occupancy in Jackson
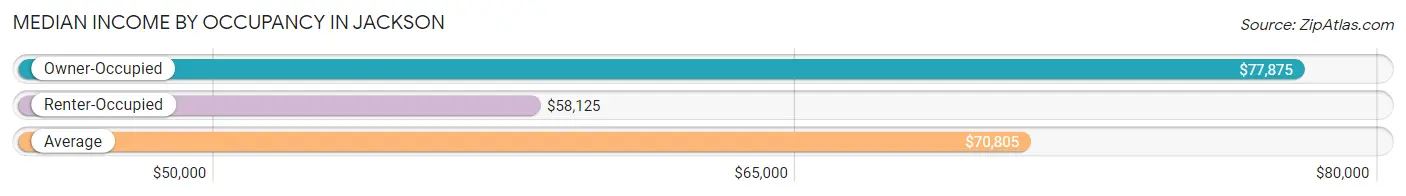
| Occupancy Type | # Households | Median Income |
| Owner-Occupied | 1,257 (58.0%) | $77,875 |
| Renter-Occupied | 909 (42.0%) | $58,125 |
| Average | 2,166 (100.0%) | $70,805 |
Occupancy by Householder Income Bracket in Jackson
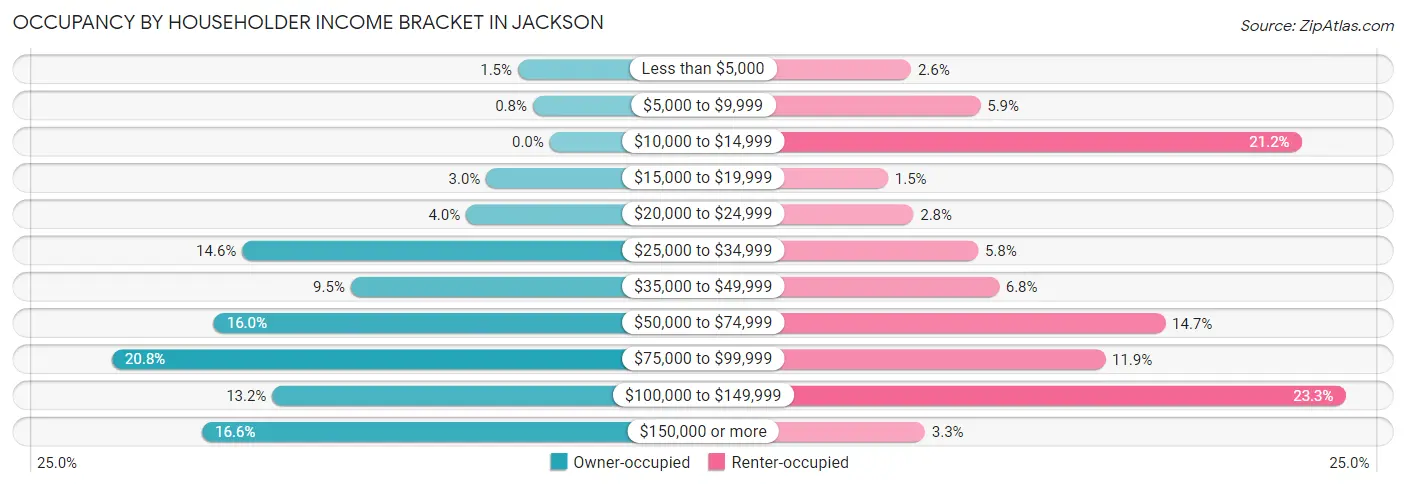
| Income Bracket | Owner-occupied | Renter-occupied |
| Less than $5,000 | 19 (1.5%) | 24 (2.6%) |
| $5,000 to $9,999 | 10 (0.8%) | 54 (5.9%) |
| $10,000 to $14,999 | 0 (0.0%) | 193 (21.2%) |
| $15,000 to $19,999 | 38 (3.0%) | 14 (1.5%) |
| $20,000 to $24,999 | 50 (4.0%) | 25 (2.8%) |
| $25,000 to $34,999 | 184 (14.6%) | 53 (5.8%) |
| $35,000 to $49,999 | 119 (9.5%) | 62 (6.8%) |
| $50,000 to $74,999 | 201 (16.0%) | 134 (14.7%) |
| $75,000 to $99,999 | 262 (20.8%) | 108 (11.9%) |
| $100,000 to $149,999 | 166 (13.2%) | 212 (23.3%) |
| $150,000 or more | 208 (16.6%) | 30 (3.3%) |
| Total | 1,257 (100.0%) | 909 (100.0%) |
Monthly Housing Cost Tiers in Jackson
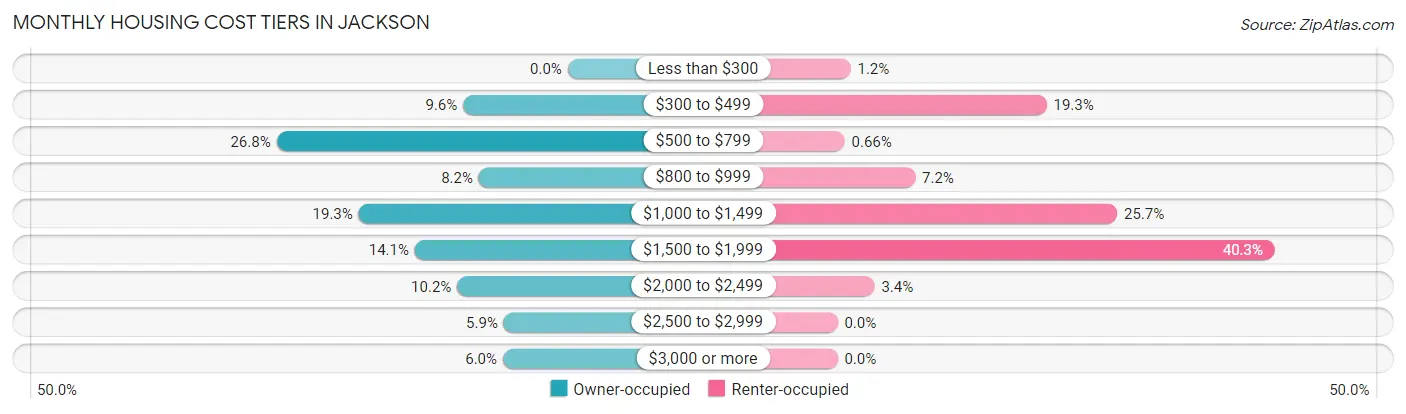
| Monthly Cost | Owner-occupied | Renter-occupied |
| Less than $300 | 0 (0.0%) | 11 (1.2%) |
| $300 to $499 | 121 (9.6%) | 175 (19.3%) |
| $500 to $799 | 337 (26.8%) | 6 (0.7%) |
| $800 to $999 | 103 (8.2%) | 65 (7.1%) |
| $1,000 to $1,499 | 242 (19.3%) | 234 (25.7%) |
| $1,500 to $1,999 | 177 (14.1%) | 366 (40.3%) |
| $2,000 to $2,499 | 128 (10.2%) | 31 (3.4%) |
| $2,500 to $2,999 | 74 (5.9%) | 0 (0.0%) |
| $3,000 or more | 75 (6.0%) | 0 (0.0%) |
| Total | 1,257 (100.0%) | 909 (100.0%) |
Physical Housing Characteristics in Jackson
Housing Structures in Jackson
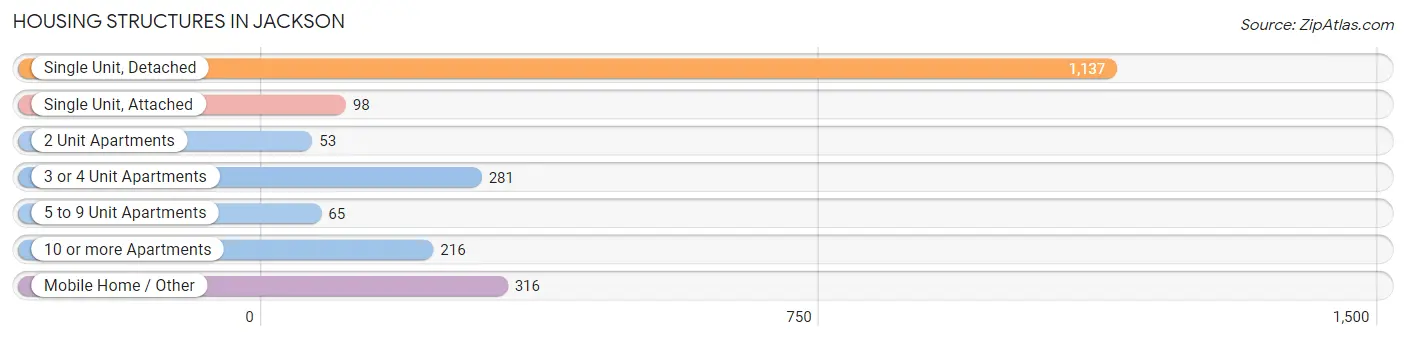
| Structure Type | # Housing Units | % Housing Units |
| Single Unit, Detached | 1,137 | 52.5% |
| Single Unit, Attached | 98 | 4.5% |
| 2 Unit Apartments | 53 | 2.5% |
| 3 or 4 Unit Apartments | 281 | 13.0% |
| 5 to 9 Unit Apartments | 65 | 3.0% |
| 10 or more Apartments | 216 | 10.0% |
| Mobile Home / Other | 316 | 14.6% |
| Total | 2,166 | 100.0% |
Housing Structures by Occupancy in Jackson
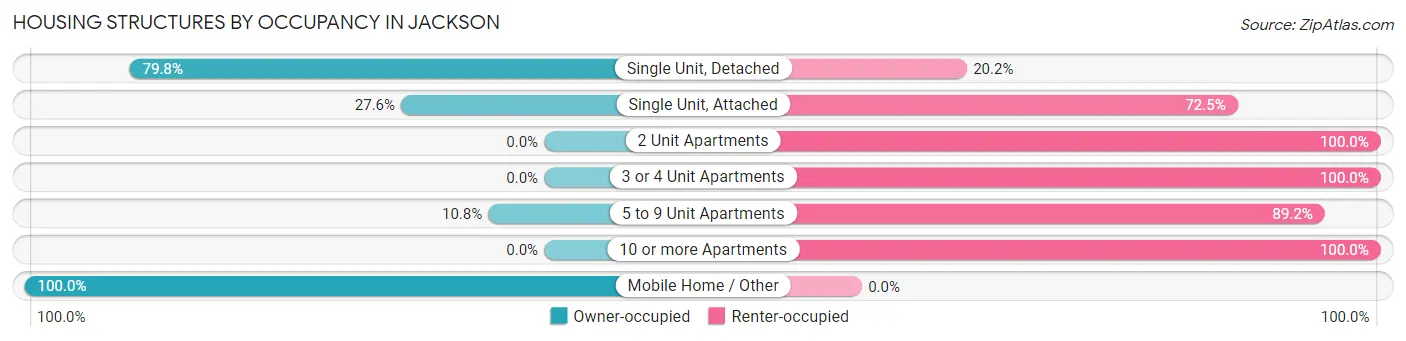
| Structure Type | Owner-occupied | Renter-occupied |
| Single Unit, Detached | 907 (79.8%) | 230 (20.2%) |
| Single Unit, Attached | 27 (27.6%) | 71 (72.5%) |
| 2 Unit Apartments | 0 (0.0%) | 53 (100.0%) |
| 3 or 4 Unit Apartments | 0 (0.0%) | 281 (100.0%) |
| 5 to 9 Unit Apartments | 7 (10.8%) | 58 (89.2%) |
| 10 or more Apartments | 0 (0.0%) | 216 (100.0%) |
| Mobile Home / Other | 316 (100.0%) | 0 (0.0%) |
| Total | 1,257 (58.0%) | 909 (42.0%) |
Housing Structures by Number of Rooms in Jackson
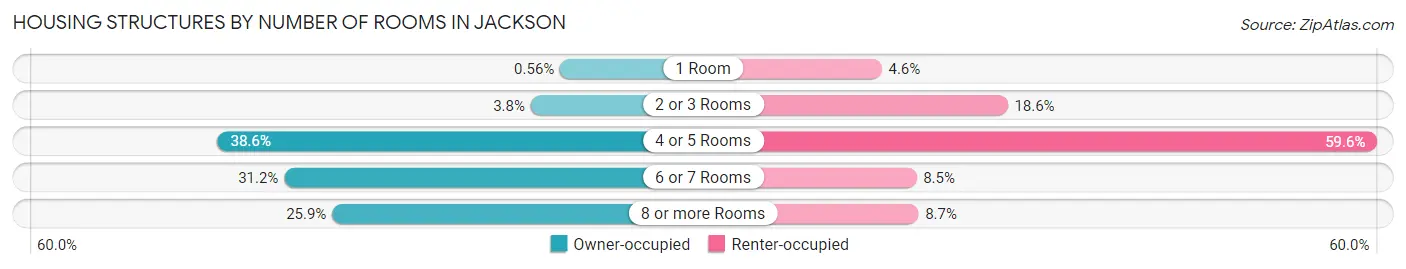
| Number of Rooms | Owner-occupied | Renter-occupied |
| 1 Room | 7 (0.6%) | 42 (4.6%) |
| 2 or 3 Rooms | 48 (3.8%) | 169 (18.6%) |
| 4 or 5 Rooms | 485 (38.6%) | 542 (59.6%) |
| 6 or 7 Rooms | 392 (31.2%) | 77 (8.5%) |
| 8 or more Rooms | 325 (25.9%) | 79 (8.7%) |
| Total | 1,257 (100.0%) | 909 (100.0%) |
Housing Structure by Heating Type in Jackson
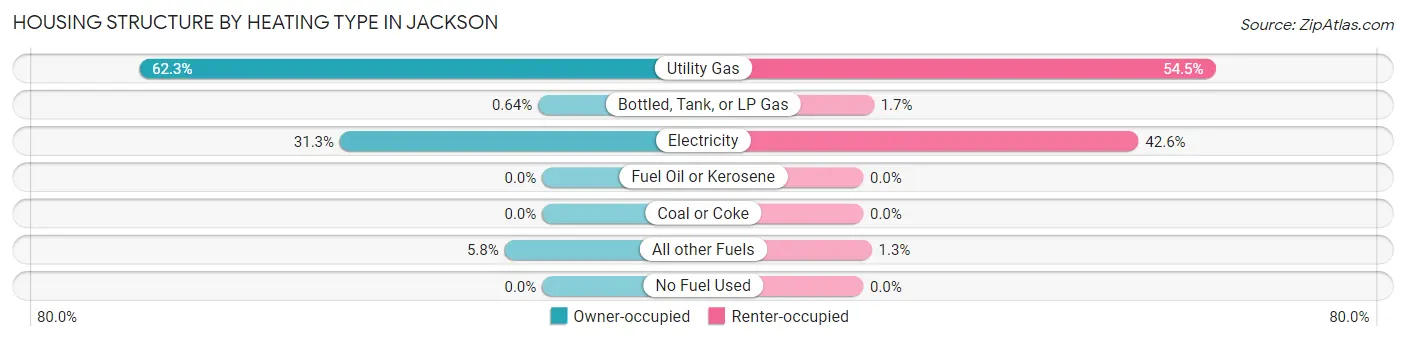
| Heating Type | Owner-occupied | Renter-occupied |
| Utility Gas | 783 (62.3%) | 495 (54.5%) |
| Bottled, Tank, or LP Gas | 8 (0.6%) | 15 (1.7%) |
| Electricity | 393 (31.3%) | 387 (42.6%) |
| Fuel Oil or Kerosene | 0 (0.0%) | 0 (0.0%) |
| Coal or Coke | 0 (0.0%) | 0 (0.0%) |
| All other Fuels | 73 (5.8%) | 12 (1.3%) |
| No Fuel Used | 0 (0.0%) | 0 (0.0%) |
| Total | 1,257 (100.0%) | 909 (100.0%) |
Household Vehicle Usage in Jackson
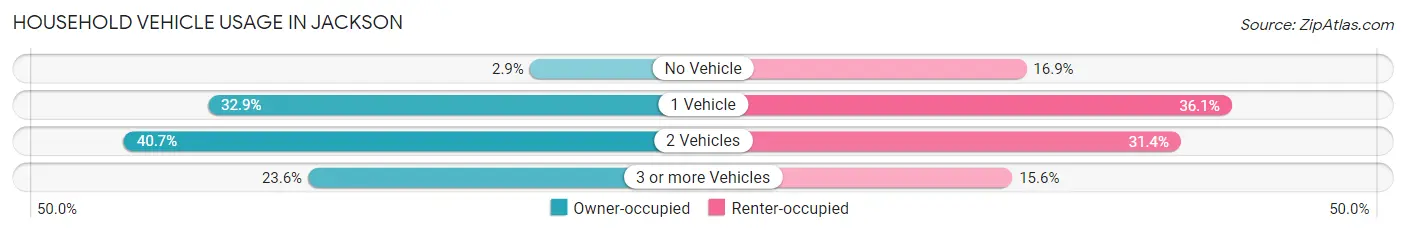
| Vehicles per Household | Owner-occupied | Renter-occupied |
| No Vehicle | 36 (2.9%) | 154 (16.9%) |
| 1 Vehicle | 413 (32.9%) | 328 (36.1%) |
| 2 Vehicles | 512 (40.7%) | 285 (31.4%) |
| 3 or more Vehicles | 296 (23.5%) | 142 (15.6%) |
| Total | 1,257 (100.0%) | 909 (100.0%) |
Real Estate & Mortgages in Jackson
Real Estate and Mortgage Overview in Jackson
| Characteristic | Without Mortgage | With Mortgage |
| Housing Units | 645 | 612 |
| Median Property Value | $334,400 | $430,800 |
| Median Household Income | $60,688 | $178 |
| Monthly Housing Costs | $671 | $68 |
| Real Estate Taxes | $1,423 | $0 |
Property Value by Mortgage Status in Jackson
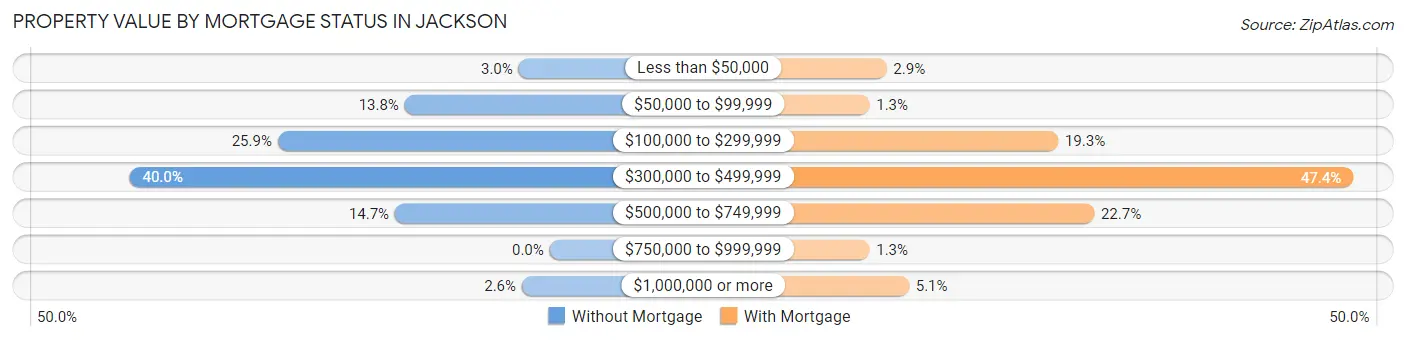
| Property Value | Without Mortgage | With Mortgage |
| Less than $50,000 | 19 (2.9%) | 18 (2.9%) |
| $50,000 to $99,999 | 89 (13.8%) | 8 (1.3%) |
| $100,000 to $299,999 | 167 (25.9%) | 118 (19.3%) |
| $300,000 to $499,999 | 258 (40.0%) | 290 (47.4%) |
| $500,000 to $749,999 | 95 (14.7%) | 139 (22.7%) |
| $750,000 to $999,999 | 0 (0.0%) | 8 (1.3%) |
| $1,000,000 or more | 17 (2.6%) | 31 (5.1%) |
| Total | 645 (100.0%) | 612 (100.0%) |
Household Income by Mortgage Status in Jackson
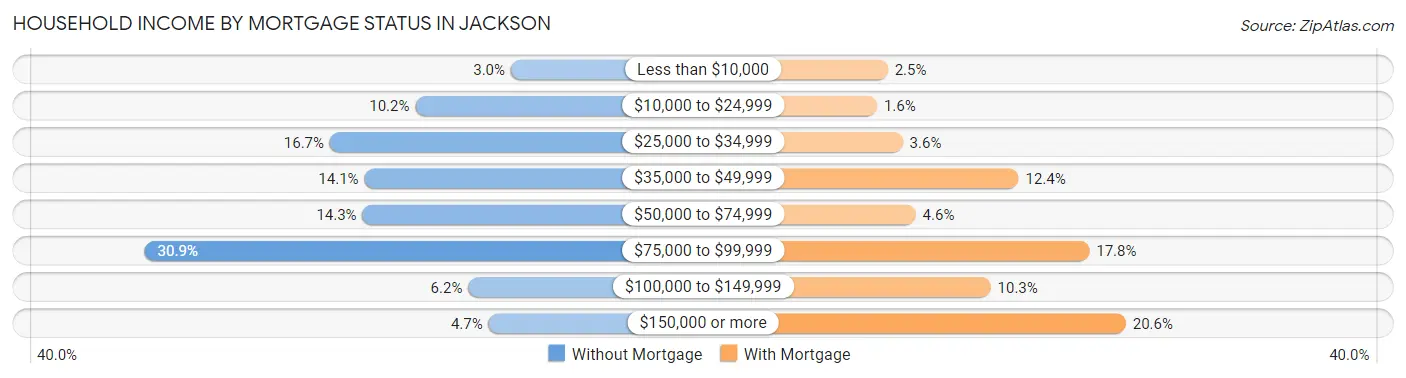
| Household Income | Without Mortgage | With Mortgage |
| Less than $10,000 | 19 (2.9%) | 15 (2.5%) |
| $10,000 to $24,999 | 66 (10.2%) | 10 (1.6%) |
| $25,000 to $34,999 | 108 (16.7%) | 22 (3.6%) |
| $35,000 to $49,999 | 91 (14.1%) | 76 (12.4%) |
| $50,000 to $74,999 | 92 (14.3%) | 28 (4.6%) |
| $75,000 to $99,999 | 199 (30.8%) | 109 (17.8%) |
| $100,000 to $149,999 | 40 (6.2%) | 63 (10.3%) |
| $150,000 or more | 30 (4.6%) | 126 (20.6%) |
| Total | 645 (100.0%) | 612 (100.0%) |
Property Value to Household Income Ratio in Jackson
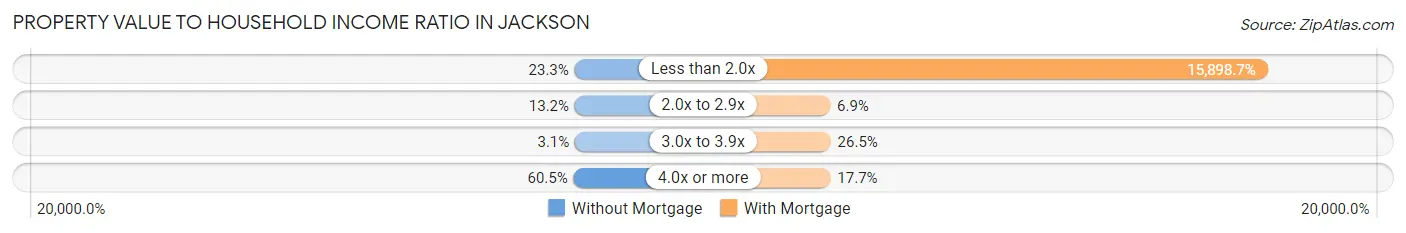
| Value-to-Income Ratio | Without Mortgage | With Mortgage |
| Less than 2.0x | 150 (23.3%) | 97,300 (15,898.7%) |
| 2.0x to 2.9x | 85 (13.2%) | 42 (6.9%) |
| 3.0x to 3.9x | 20 (3.1%) | 162 (26.5%) |
| 4.0x or more | 390 (60.5%) | 108 (17.6%) |
| Total | 645 (100.0%) | 612 (100.0%) |
Real Estate Taxes by Mortgage Status in Jackson
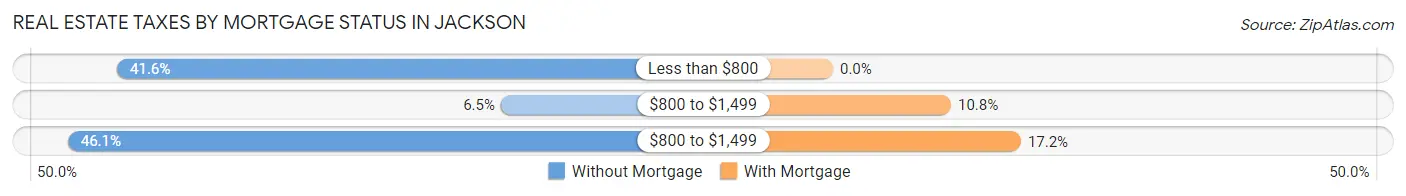
| Property Taxes | Without Mortgage | With Mortgage |
| Less than $800 | 268 (41.5%) | 0 (0.0%) |
| $800 to $1,499 | 42 (6.5%) | 66 (10.8%) |
| $800 to $1,499 | 297 (46.1%) | 105 (17.2%) |
| Total | 645 (100.0%) | 612 (100.0%) |
Health & Disability in Jackson
Health Insurance Coverage by Age in Jackson
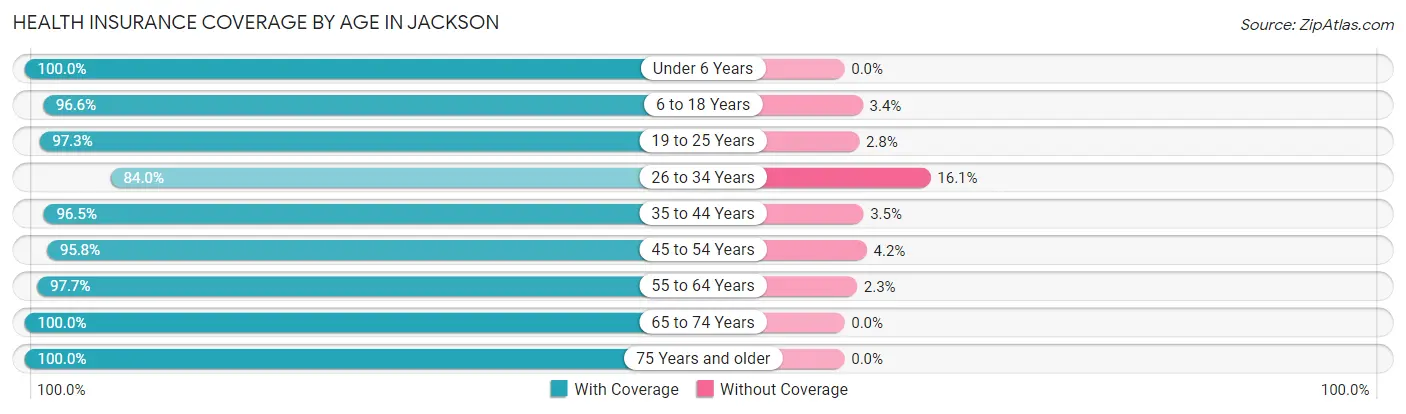
| Age Bracket | With Coverage | Without Coverage |
| Under 6 Years | 242 (100.0%) | 0 (0.0%) |
| 6 to 18 Years | 651 (96.6%) | 23 (3.4%) |
| 19 to 25 Years | 566 (97.3%) | 16 (2.8%) |
| 26 to 34 Years | 429 (84.0%) | 82 (16.1%) |
| 35 to 44 Years | 465 (96.5%) | 17 (3.5%) |
| 45 to 54 Years | 392 (95.8%) | 17 (4.2%) |
| 55 to 64 Years | 459 (97.7%) | 11 (2.3%) |
| 65 to 74 Years | 764 (100.0%) | 0 (0.0%) |
| 75 Years and older | 684 (100.0%) | 0 (0.0%) |
| Total | 4,652 (96.6%) | 166 (3.5%) |
Health Insurance Coverage by Citizenship Status in Jackson
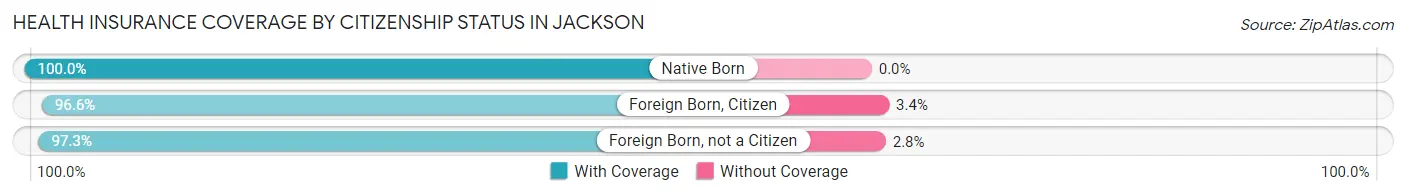
| Citizenship Status | With Coverage | Without Coverage |
| Native Born | 242 (100.0%) | 0 (0.0%) |
| Foreign Born, Citizen | 651 (96.6%) | 23 (3.4%) |
| Foreign Born, not a Citizen | 566 (97.3%) | 16 (2.8%) |
Health Insurance Coverage by Household Income in Jackson
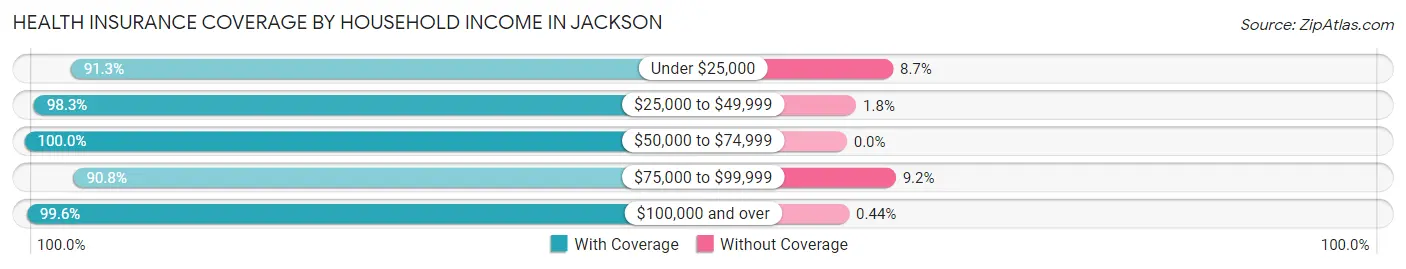
| Household Income | With Coverage | Without Coverage |
| Under $25,000 | 485 (91.3%) | 46 (8.7%) |
| $25,000 to $49,999 | 619 (98.3%) | 11 (1.8%) |
| $50,000 to $74,999 | 968 (100.0%) | 0 (0.0%) |
| $75,000 to $99,999 | 961 (90.8%) | 97 (9.2%) |
| $100,000 and over | 1,601 (99.6%) | 7 (0.4%) |
Public vs Private Health Insurance Coverage by Age in Jackson
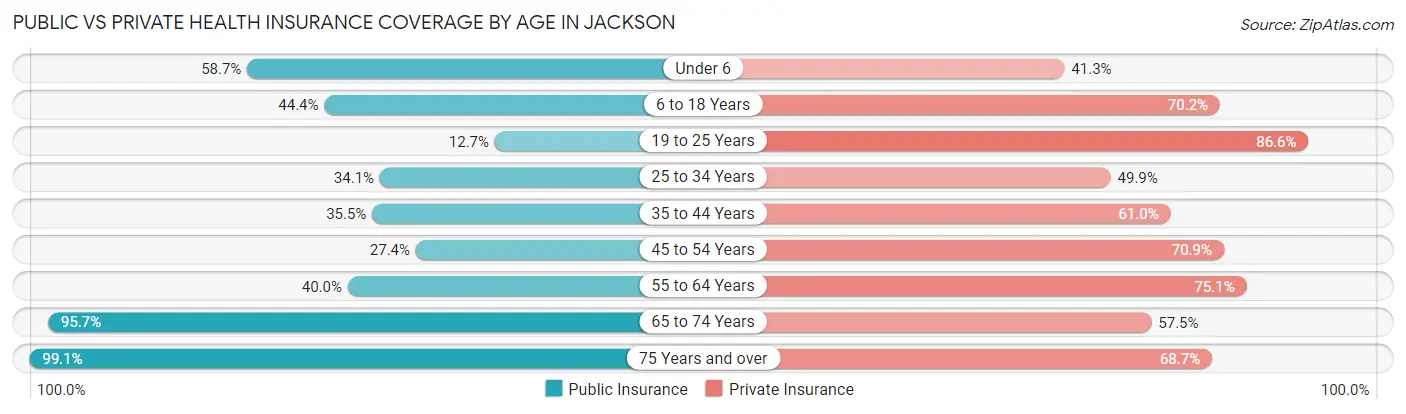
| Age Bracket | Public Insurance | Private Insurance |
| Under 6 | 142 (58.7%) | 100 (41.3%) |
| 6 to 18 Years | 299 (44.4%) | 473 (70.2%) |
| 19 to 25 Years | 74 (12.7%) | 504 (86.6%) |
| 25 to 34 Years | 174 (34.1%) | 255 (49.9%) |
| 35 to 44 Years | 171 (35.5%) | 294 (61.0%) |
| 45 to 54 Years | 112 (27.4%) | 290 (70.9%) |
| 55 to 64 Years | 188 (40.0%) | 353 (75.1%) |
| 65 to 74 Years | 731 (95.7%) | 439 (57.5%) |
| 75 Years and over | 678 (99.1%) | 470 (68.7%) |
| Total | 2,569 (53.3%) | 3,178 (66.0%) |
Disability Status by Sex by Age in Jackson
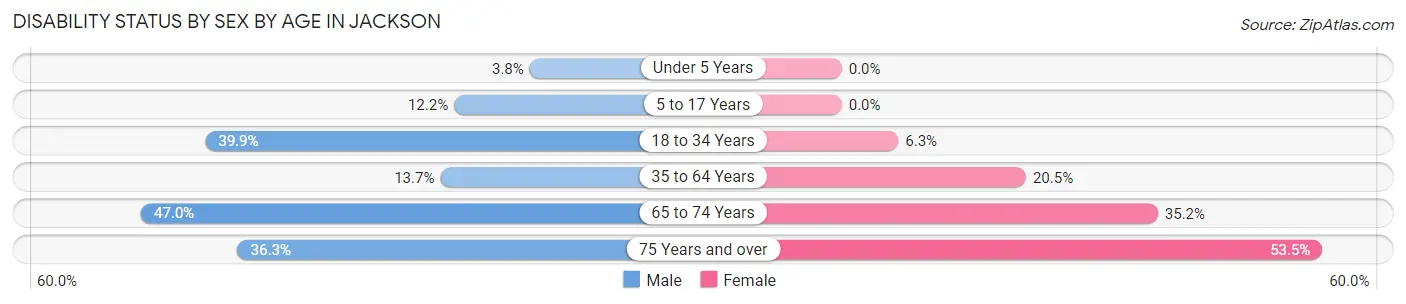
| Age Bracket | Male | Female |
| Under 5 Years | 5 (3.8%) | 0 (0.0%) |
| 5 to 17 Years | 53 (12.2%) | 0 (0.0%) |
| 18 to 34 Years | 240 (39.9%) | 33 (6.3%) |
| 35 to 64 Years | 89 (13.7%) | 146 (20.5%) |
| 65 to 74 Years | 175 (47.0%) | 138 (35.2%) |
| 75 Years and over | 103 (36.3%) | 214 (53.5%) |
Disability Class by Sex by Age in Jackson
Disability Class: Hearing Difficulty
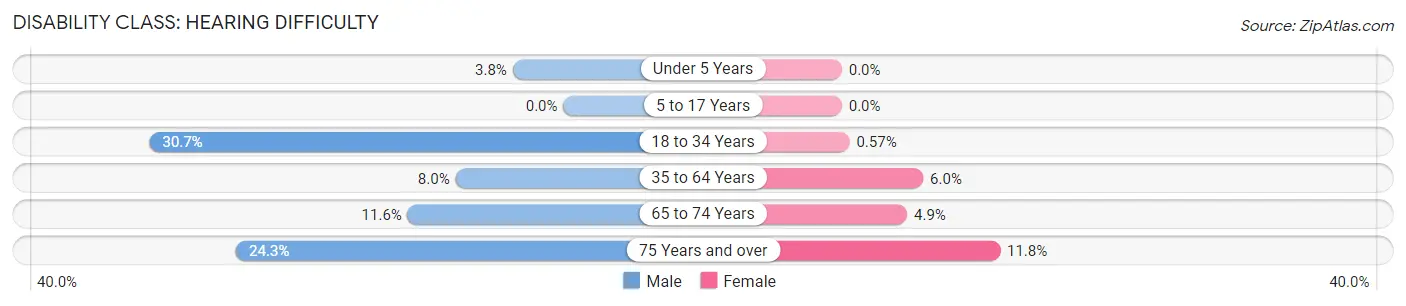
| Age Bracket | Male | Female |
| Under 5 Years | 5 (3.8%) | 0 (0.0%) |
| 5 to 17 Years | 0 (0.0%) | 0 (0.0%) |
| 18 to 34 Years | 185 (30.7%) | 3 (0.6%) |
| 35 to 64 Years | 52 (8.0%) | 43 (6.0%) |
| 65 to 74 Years | 43 (11.6%) | 19 (4.9%) |
| 75 Years and over | 69 (24.3%) | 47 (11.7%) |
Disability Class: Vision Difficulty
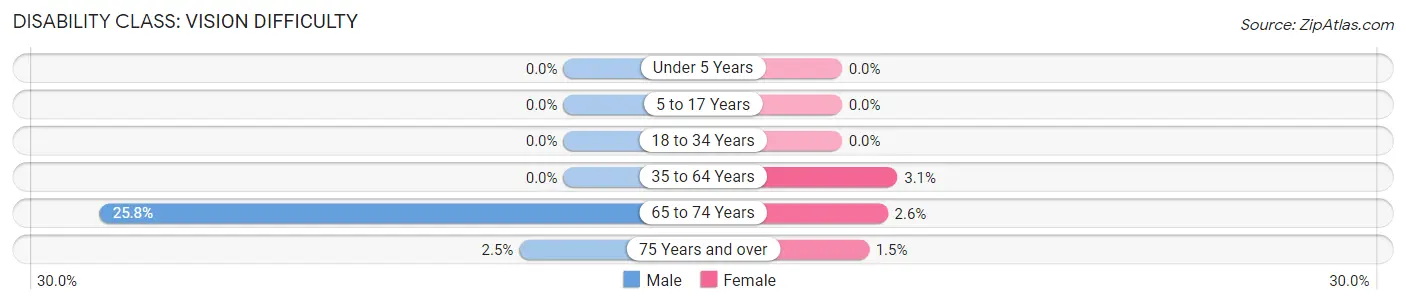
| Age Bracket | Male | Female |
| Under 5 Years | 0 (0.0%) | 0 (0.0%) |
| 5 to 17 Years | 0 (0.0%) | 0 (0.0%) |
| 18 to 34 Years | 0 (0.0%) | 0 (0.0%) |
| 35 to 64 Years | 0 (0.0%) | 22 (3.1%) |
| 65 to 74 Years | 96 (25.8%) | 10 (2.5%) |
| 75 Years and over | 7 (2.5%) | 6 (1.5%) |
Disability Class: Cognitive Difficulty
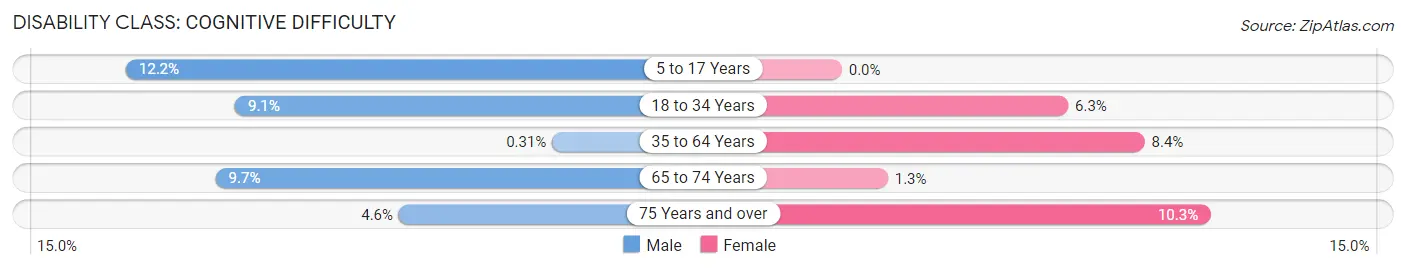
| Age Bracket | Male | Female |
| 5 to 17 Years | 53 (12.2%) | 0 (0.0%) |
| 18 to 34 Years | 55 (9.1%) | 33 (6.3%) |
| 35 to 64 Years | 2 (0.3%) | 60 (8.4%) |
| 65 to 74 Years | 36 (9.7%) | 5 (1.3%) |
| 75 Years and over | 13 (4.6%) | 41 (10.2%) |
Disability Class: Ambulatory Difficulty
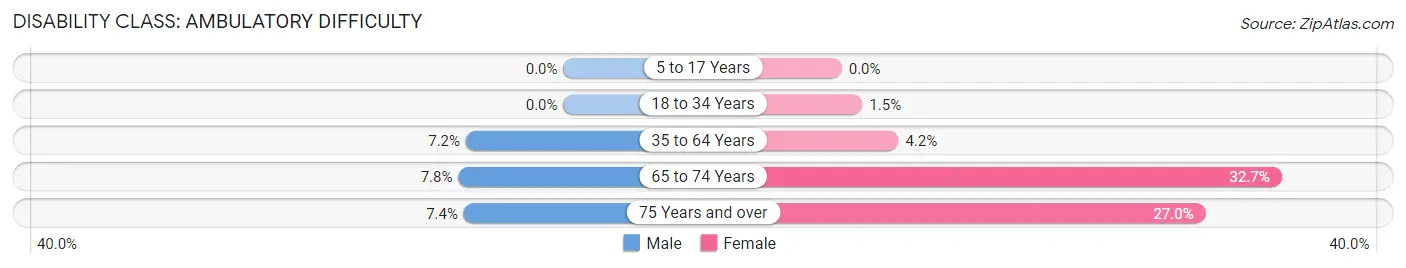
| Age Bracket | Male | Female |
| 5 to 17 Years | 0 (0.0%) | 0 (0.0%) |
| 18 to 34 Years | 0 (0.0%) | 8 (1.5%) |
| 35 to 64 Years | 47 (7.2%) | 30 (4.2%) |
| 65 to 74 Years | 29 (7.8%) | 128 (32.7%) |
| 75 Years and over | 21 (7.4%) | 108 (27.0%) |
Disability Class: Self-Care Difficulty
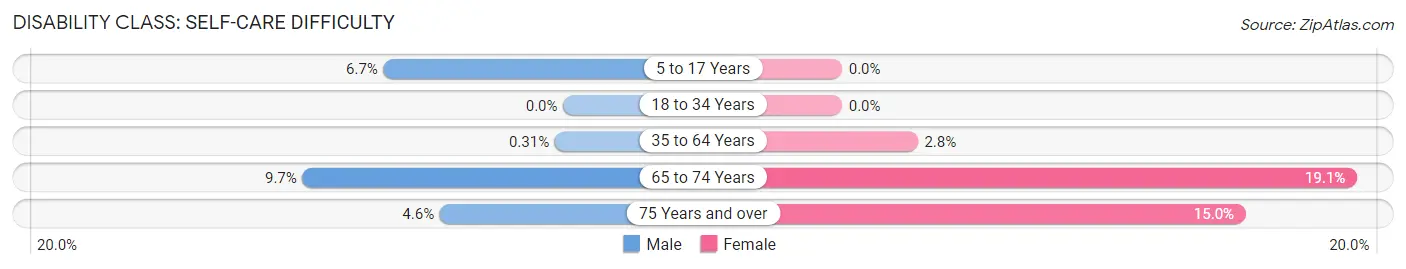
| Age Bracket | Male | Female |
| 5 to 17 Years | 29 (6.7%) | 0 (0.0%) |
| 18 to 34 Years | 0 (0.0%) | 0 (0.0%) |
| 35 to 64 Years | 2 (0.3%) | 20 (2.8%) |
| 65 to 74 Years | 36 (9.7%) | 75 (19.1%) |
| 75 Years and over | 13 (4.6%) | 60 (15.0%) |
Technology Access in Jackson
Computing Device Access in Jackson
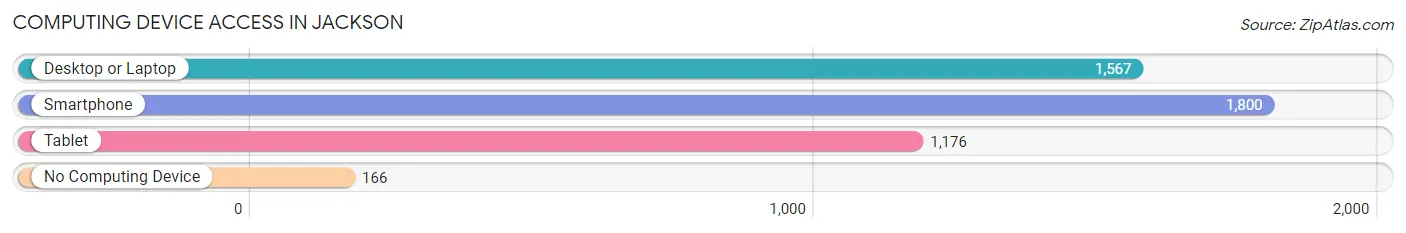
| Device Type | # Households | % Households |
| Desktop or Laptop | 1,567 | 72.4% |
| Smartphone | 1,800 | 83.1% |
| Tablet | 1,176 | 54.3% |
| No Computing Device | 166 | 7.7% |
| Total | 2,166 | 100.0% |
Internet Access in Jackson
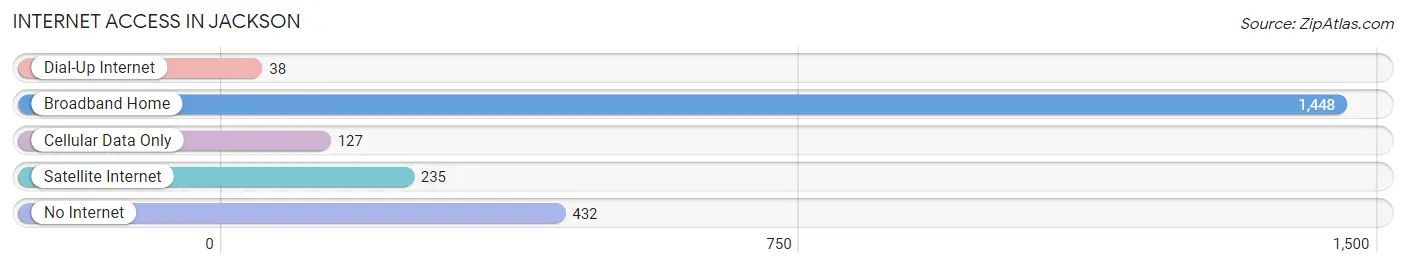
| Internet Type | # Households | % Households |
| Dial-Up Internet | 38 | 1.8% |
| Broadband Home | 1,448 | 66.8% |
| Cellular Data Only | 127 | 5.9% |
| Satellite Internet | 235 | 10.8% |
| No Internet | 432 | 19.9% |
| Total | 2,166 | 100.0% |
Jackson Summary
Jackson, California is a small city located in Amador County, in the Sierra Nevada foothills of Northern California. It is situated at an elevation of 1,890 feet, and is located about 40 miles southeast of Sacramento. The city has a population of 4,637, according to the 2010 census.
History
The area that is now Jackson was originally inhabited by the Miwok and Maidu Native American tribes. The first European settlers arrived in the area in the early 1850s, and the town was officially founded in 1851. It was named after Colonel Alden Jackson, who was a veteran of the Mexican-American War.
The town quickly grew, and by the late 1800s, it had become a major center for gold mining. The gold rush brought a large influx of people to the area, and the population of Jackson grew to over 10,000 by the early 1900s.
The town was also a major hub for the timber industry, and the lumber industry was a major employer in the area. The timber industry declined in the mid-1900s, and the population of Jackson began to decline as well.
Geography
Jackson is located in the Sierra Nevada foothills, and is surrounded by rolling hills and oak-covered mountains. The city is situated at an elevation of 1,890 feet, and is located about 40 miles southeast of Sacramento.
The city is located in Amador County, and is bordered by the cities of Sutter Creek, Ione, and Pine Grove. The city is located near the Mokelumne River, and is also close to the Amador Reservoir.
Economy
The economy of Jackson is largely based on tourism and agriculture. The city is home to several wineries, and is a popular destination for wine tasting. The city is also home to several small businesses, including restaurants, shops, and galleries.
The city is also home to several large employers, including the Amador County Sheriff’s Office, the Amador County Courthouse, and the Amador County Hospital.
Demographics
According to the 2010 census, the population of Jackson was 4,637. The racial makeup of the city was 87.3% White, 0.7% African American, 0.7% Native American, 0.9% Asian, 0.1% Pacific Islander, 8.2% from other races, and 2.2% from two or more races. Hispanic or Latino of any race were 16.2% of the population.
The median household income in Jackson was $45,938, and the median family income was $51,938. The per capita income for the city was $21,938. About 11.2% of families and 14.2% of the population were below the poverty line, including 18.2% of those under age 18 and 8.2% of those age 65 or over.
Common Questions
What is Per Capita Income in Jackson?
Per Capita income in Jackson is $36,010.
What is the Median Family Income in Jackson?
Median Family Income in Jackson is $86,094.
What is the Median Household income in Jackson?
Median Household Income in Jackson is $70,805.
What is Income or Wage Gap in Jackson?
Income or Wage Gap in Jackson is 53.9%.
Women in Jackson earn 46.1 cents for every dollar earned by a man.
What is Inequality or Gini Index in Jackson?
Inequality or Gini Index in Jackson is 0.44.
What is the Total Population of Jackson?
Total Population of Jackson is 5,004.
What is the Total Male Population of Jackson?
Total Male Population of Jackson is 2,591.
What is the Total Female Population of Jackson?
Total Female Population of Jackson is 2,413.
What is the Ratio of Males per 100 Females in Jackson?
There are 107.38 Males per 100 Females in Jackson.
What is the Ratio of Females per 100 Males in Jackson?
There are 93.13 Females per 100 Males in Jackson.
What is the Median Population Age in Jackson?
Median Population Age in Jackson is 43.7 Years.
What is the Average Family Size in Jackson
Average Family Size in Jackson is 2.8 People.
What is the Average Household Size in Jackson
Average Household Size in Jackson is 2.2 People.
How Large is the Labor Force in Jackson?
There are 2,129 People in the Labor Forcein in Jackson.
What is the Percentage of People in the Labor Force in Jackson?
50.7% of People are in the Labor Force in Jackson.
What is the Unemployment Rate in Jackson?
Unemployment Rate in Jackson is 5.0%.