Cities with the Highest Percentage of Population Employed in Real Estate, Rental & Leasing in California
RELATED REPORTS & OPTIONS
Real Estate, Rental & Leasing
California
Compare Cities
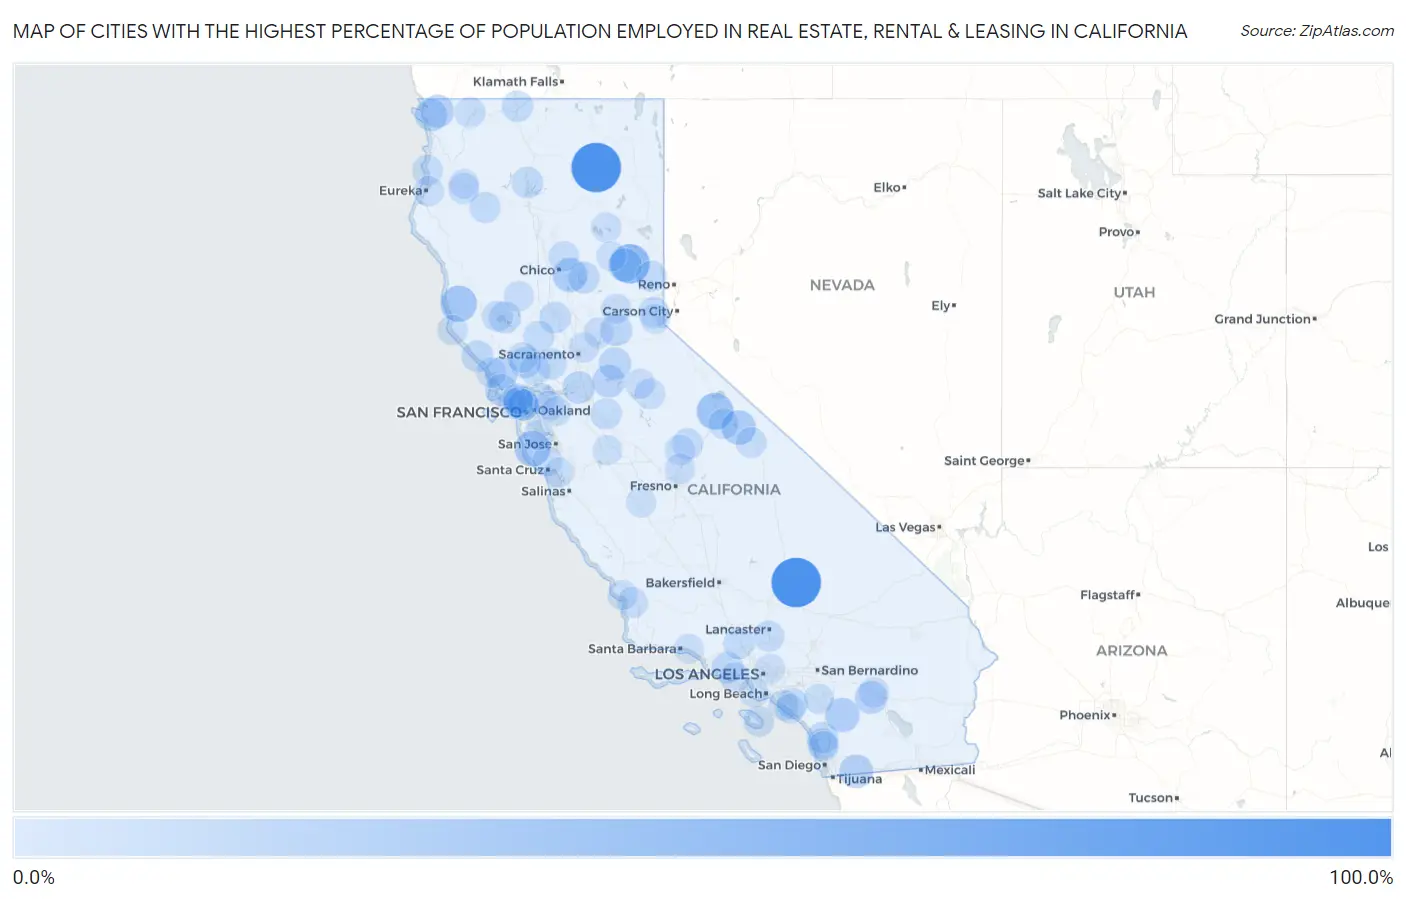
Map of Cities with the Highest Percentage of Population Employed in Real Estate, Rental & Leasing in California
0.0%
100.0%
Cities with the Highest Percentage of Population Employed in Real Estate, Rental & Leasing in California
| City | % Employed | vs State | vs National | |
| 1. | Randsburg | 100.0% | 2.1%(+97.9)#1 | 1.9%(+98.1)#3 |
| 2. | Nubieber | 100.0% | 2.1%(+97.9)#2 | 1.9%(+98.1)#5 |
| 3. | Rivergrove | 81.5% | 2.1%(+79.4)#3 | 1.9%(+79.6)#11 |
| 4. | Mohawk Vista | 50.0% | 2.1%(+47.9)#4 | 1.9%(+48.1)#23 |
| 5. | El Adobe | 38.5% | 2.1%(+36.3)#5 | 1.9%(+36.6)#42 |
| 6. | June Lake | 37.2% | 2.1%(+35.1)#6 | 1.9%(+35.3)#49 |
| 7. | Comptche | 35.0% | 2.1%(+32.9)#7 | 1.9%(+33.1)#53 |
| 8. | Loma Mar | 32.1% | 2.1%(+29.9)#8 | 1.9%(+30.2)#61 |
| 9. | Bear Valley Cdp Mariposa County | 31.1% | 2.1%(+29.0)#9 | 1.9%(+29.3)#62 |
| 10. | Butte Valley | 27.0% | 2.1%(+24.9)#10 | 1.9%(+25.1)#87 |
| 11. | Sunny Slopes | 26.7% | 2.1%(+24.5)#11 | 1.9%(+24.8)#89 |
| 12. | Aguanga | 25.8% | 2.1%(+23.7)#12 | 1.9%(+24.0)#97 |
| 13. | Potrero | 22.9% | 2.1%(+20.7)#13 | 1.9%(+21.0)#124 |
| 14. | Alto | 22.0% | 2.1%(+19.9)#14 | 1.9%(+20.1)#129 |
| 15. | Plumas Eureka | 21.7% | 2.1%(+19.6)#15 | 1.9%(+19.8)#132 |
| 16. | Cedar Flat | 21.1% | 2.1%(+19.0)#16 | 1.9%(+19.3)#141 |
| 17. | Gasquet | 20.4% | 2.1%(+18.3)#17 | 1.9%(+18.5)#150 |
| 18. | Bloomfield | 19.2% | 2.1%(+17.0)#18 | 1.9%(+17.3)#159 |
| 19. | Wallace | 18.5% | 2.1%(+16.4)#19 | 1.9%(+16.6)#170 |
| 20. | Indian Wells | 18.4% | 2.1%(+16.3)#20 | 1.9%(+16.5)#174 |
| 21. | Hiouchi | 18.4% | 2.1%(+16.2)#21 | 1.9%(+16.5)#176 |
| 22. | Drytown | 18.0% | 2.1%(+15.9)#22 | 1.9%(+16.1)#182 |
| 23. | Stones Landing | 16.9% | 2.1%(+14.8)#23 | 1.9%(+15.1)#193 |
| 24. | Terminous | 16.6% | 2.1%(+14.4)#24 | 1.9%(+14.7)#206 |
| 25. | Inverness | 15.6% | 2.1%(+13.4)#25 | 1.9%(+13.7)#232 |
| 26. | Georgetown | 15.5% | 2.1%(+13.4)#26 | 1.9%(+13.6)#234 |
| 27. | Timber Cove | 14.7% | 2.1%(+12.5)#27 | 1.9%(+12.8)#259 |
| 28. | Lucerne | 14.4% | 2.1%(+12.3)#28 | 1.9%(+12.5)#262 |
| 29. | Lake Sherwood | 14.4% | 2.1%(+12.3)#29 | 1.9%(+12.5)#263 |
| 30. | Belvedere | 14.1% | 2.1%(+12.0)#30 | 1.9%(+12.2)#274 |
| 31. | Berry Creek | 14.0% | 2.1%(+11.8)#31 | 1.9%(+12.1)#279 |
| 32. | Lakehead | 12.8% | 2.1%(+10.7)#32 | 1.9%(+11.0)#327 |
| 33. | Grimes | 12.7% | 2.1%(+10.6)#33 | 1.9%(+10.8)#332 |
| 34. | Rutherford | 12.5% | 2.1%(+10.4)#34 | 1.9%(+10.6)#345 |
| 35. | Hornbrook | 12.4% | 2.1%(+10.3)#35 | 1.9%(+10.5)#351 |
| 36. | Lake San Marcos | 12.2% | 2.1%(+10.1)#36 | 1.9%(+10.3)#366 |
| 37. | San Miguel Cdp Contra Costa County | 11.5% | 2.1%(+9.36)#37 | 1.9%(+9.59)#413 |
| 38. | Desert View Highlands | 11.3% | 2.1%(+9.21)#38 | 1.9%(+9.43)#423 |
| 39. | Hayfork | 11.3% | 2.1%(+9.19)#39 | 1.9%(+9.41)#424 |
| 40. | Sierra Brooks | 11.2% | 2.1%(+9.08)#40 | 1.9%(+9.31)#430 |
| 41. | Sunnyside Tahoe City | 11.2% | 2.1%(+9.05)#41 | 1.9%(+9.27)#431 |
| 42. | Hasley Canyon | 11.1% | 2.1%(+8.99)#42 | 1.9%(+9.22)#435 |
| 43. | Del Rio | 11.1% | 2.1%(+8.99)#43 | 1.9%(+9.22)#436 |
| 44. | Laguna Woods | 11.1% | 2.1%(+8.98)#44 | 1.9%(+9.21)#437 |
| 45. | Rancho Santa Fe | 11.0% | 2.1%(+8.88)#45 | 1.9%(+9.11)#443 |
| 46. | Guinda | 11.0% | 2.1%(+8.88)#46 | 1.9%(+9.11)#444 |
| 47. | Silverado Resort | 10.9% | 2.1%(+8.76)#47 | 1.9%(+8.98)#455 |
| 48. | Bass Lake | 10.8% | 2.1%(+8.69)#48 | 1.9%(+8.92)#464 |
| 49. | Allendale | 10.7% | 2.1%(+8.60)#49 | 1.9%(+8.82)#472 |
| 50. | Burnt Ranch | 10.4% | 2.1%(+8.27)#50 | 1.9%(+8.50)#492 |
| 51. | North Lakeport | 10.4% | 2.1%(+8.27)#51 | 1.9%(+8.49)#493 |
| 52. | Happy Camp | 10.3% | 2.1%(+8.15)#52 | 1.9%(+8.38)#506 |
| 53. | Alhambra Valley | 10.1% | 2.1%(+7.96)#53 | 1.9%(+8.19)#526 |
| 54. | West Bishop | 10.1% | 2.1%(+7.94)#54 | 1.9%(+8.17)#529 |
| 55. | Avalon | 9.9% | 2.1%(+7.80)#55 | 1.9%(+8.02)#548 |
| 56. | Tiburon | 9.9% | 2.1%(+7.75)#56 | 1.9%(+7.98)#551 |
| 57. | Trinidad | 9.7% | 2.1%(+7.60)#57 | 1.9%(+7.82)#566 |
| 58. | Rancho Mission Viejo | 9.6% | 2.1%(+7.49)#58 | 1.9%(+7.72)#577 |
| 59. | Los Berros | 9.5% | 2.1%(+7.40)#59 | 1.9%(+7.63)#588 |
| 60. | Deer Park | 9.4% | 2.1%(+7.26)#60 | 1.9%(+7.48)#598 |
| 61. | Twain Harte | 9.2% | 2.1%(+7.08)#61 | 1.9%(+7.31)#619 |
| 62. | Mammoth Lakes | 9.1% | 2.1%(+6.98)#62 | 1.9%(+7.21)#636 |
| 63. | Cohasset | 9.0% | 2.1%(+6.89)#63 | 1.9%(+7.12)#652 |
| 64. | Coarsegold | 8.9% | 2.1%(+6.80)#64 | 1.9%(+7.02)#659 |
| 65. | Desert Palms | 8.9% | 2.1%(+6.79)#65 | 1.9%(+7.01)#661 |
| 66. | Friant | 8.8% | 2.1%(+6.67)#66 | 1.9%(+6.90)#681 |
| 67. | Bodega Bay | 8.7% | 2.1%(+6.54)#67 | 1.9%(+6.76)#699 |
| 68. | Stinson Beach | 8.7% | 2.1%(+6.53)#68 | 1.9%(+6.76)#700 |
| 69. | Newcastle | 8.6% | 2.1%(+6.51)#69 | 1.9%(+6.74)#704 |
| 70. | Zayante | 8.4% | 2.1%(+6.31)#70 | 1.9%(+6.54)#740 |
| 71. | Mcclellan Park | 8.4% | 2.1%(+6.27)#71 | 1.9%(+6.50)#744 |
| 72. | Point Arena | 8.3% | 2.1%(+6.21)#72 | 1.9%(+6.44)#751 |
| 73. | Stonyford | 8.3% | 2.1%(+6.21)#73 | 1.9%(+6.44)#756 |
| 74. | Alamo | 8.2% | 2.1%(+6.09)#74 | 1.9%(+6.32)#776 |
| 75. | Myrtletown | 8.1% | 2.1%(+5.96)#75 | 1.9%(+6.19)#808 |
| 76. | Forest Meadows | 7.9% | 2.1%(+5.77)#76 | 1.9%(+5.99)#846 |
| 77. | Malibu | 7.8% | 2.1%(+5.69)#77 | 1.9%(+5.92)#857 |
| 78. | Dutch Flat | 7.7% | 2.1%(+5.57)#78 | 1.9%(+5.80)#886 |
| 79. | Westwood | 7.7% | 2.1%(+5.54)#79 | 1.9%(+5.77)#889 |
| 80. | Ross | 7.5% | 2.1%(+5.41)#80 | 1.9%(+5.64)#926 |
| 81. | Canyon Lake | 7.5% | 2.1%(+5.37)#81 | 1.9%(+5.60)#934 |
| 82. | Fairbanks Ranch | 7.5% | 2.1%(+5.37)#82 | 1.9%(+5.59)#935 |
| 83. | Green Valley Cdp Solano County | 7.4% | 2.1%(+5.27)#83 | 1.9%(+5.50)#953 |
| 84. | Newport Beach | 7.4% | 2.1%(+5.25)#84 | 1.9%(+5.48)#960 |
| 85. | Avila Beach | 7.4% | 2.1%(+5.23)#85 | 1.9%(+5.46)#962 |
| 86. | Atherton | 7.2% | 2.1%(+5.08)#86 | 1.9%(+5.30)#992 |
| 87. | Trinity Village | 7.2% | 2.1%(+5.07)#87 | 1.9%(+5.29)#997 |
| 88. | Three Rocks | 7.1% | 2.1%(+5.02)#88 | 1.9%(+5.25)#1,008 |
| 89. | Yosemite West | 7.1% | 2.1%(+5.02)#89 | 1.9%(+5.25)#1,012 |
| 90. | Gustine | 7.0% | 2.1%(+4.89)#90 | 1.9%(+5.12)#1,041 |
| 91. | San Marino | 7.0% | 2.1%(+4.85)#91 | 1.9%(+5.07)#1,054 |
| 92. | East Quincy | 6.9% | 2.1%(+4.77)#92 | 1.9%(+5.00)#1,073 |
| 93. | Camino Tassajara | 6.8% | 2.1%(+4.66)#93 | 1.9%(+4.89)#1,101 |
| 94. | Palos Verdes Estates | 6.7% | 2.1%(+4.62)#94 | 1.9%(+4.85)#1,107 |
| 95. | Tahoma | 6.7% | 2.1%(+4.60)#95 | 1.9%(+4.82)#1,112 |
| 96. | Mill Valley | 6.6% | 2.1%(+4.51)#96 | 1.9%(+4.73)#1,141 |
| 97. | Toro Canyon | 6.6% | 2.1%(+4.50)#97 | 1.9%(+4.73)#1,145 |
| 98. | La Selva Beach | 6.6% | 2.1%(+4.50)#98 | 1.9%(+4.72)#1,146 |
| 99. | Strawberry Cdp Marin County | 6.6% | 2.1%(+4.49)#99 | 1.9%(+4.72)#1,149 |
| 100. | Laguna Beach | 6.6% | 2.1%(+4.47)#100 | 1.9%(+4.70)#1,157 |
Common Questions
What are the Top 10 Cities with the Highest Percentage of Population Employed in Real Estate, Rental & Leasing in California?
Top 10 Cities with the Highest Percentage of Population Employed in Real Estate, Rental & Leasing in California are:
#1
100.0%
#2
100.0%
#3
50.0%
#4
37.2%
#5
35.0%
#6
32.1%
#7
27.0%
#8
26.7%
#9
25.8%
#10
22.9%
What city has the Highest Percentage of Population Employed in Real Estate, Rental & Leasing in California?
Randsburg has the Highest Percentage of Population Employed in Real Estate, Rental & Leasing in California with 100.0%.
What is the Percentage of Population Employed in Real Estate, Rental & Leasing in the State of California?
Percentage of Population Employed in Real Estate, Rental & Leasing in California is 2.1%.
What is the Percentage of Population Employed in Real Estate, Rental & Leasing in the United States?
Percentage of Population Employed in Real Estate, Rental & Leasing in the United States is 1.9%.