Zip Codes with the Highest Percentage of Population Employed in Installation, Maintenance & Repair in Downey, CA
RELATED REPORTS & OPTIONS
Installation, Maintenance & Repair
Downey
Compare Zip Codes
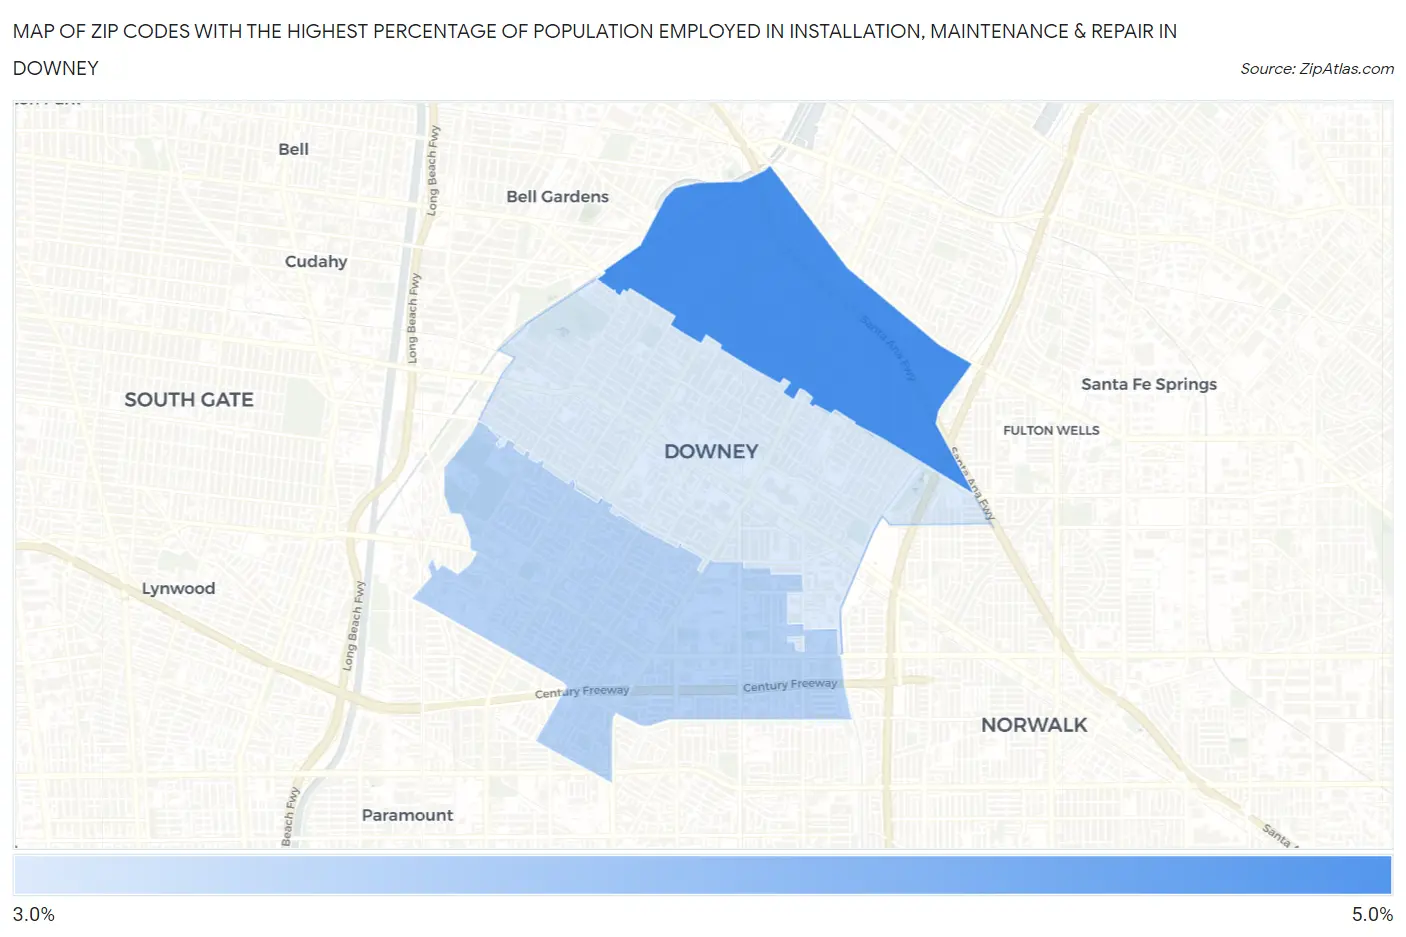
Map of Zip Codes with the Highest Percentage of Population Employed in Installation, Maintenance & Repair in Downey
3.2%
4.4%
Zip Codes with the Highest Percentage of Population Employed in Installation, Maintenance & Repair in Downey, CA
| Zip Code | % Employed | vs State | vs National | |
| 1. | 90240 | 4.4% | 2.6%(+1.89)#261 | 3.1%(+1.38)#10,607 |
| 2. | 90242 | 3.5% | 2.6%(+0.985)#450 | 3.1%(+0.473)#14,419 |
| 3. | 90241 | 3.2% | 2.6%(+0.664)#526 | 3.1%(+0.153)#15,925 |
1
Common Questions
What are the Top Zip Codes with the Highest Percentage of Population Employed in Installation, Maintenance & Repair in Downey, CA?
Top Zip Codes with the Highest Percentage of Population Employed in Installation, Maintenance & Repair in Downey, CA are:
What zip code has the Highest Percentage of Population Employed in Installation, Maintenance & Repair in Downey, CA?
90240 has the Highest Percentage of Population Employed in Installation, Maintenance & Repair in Downey, CA with 4.4%.
What is the Percentage of Population Employed in Installation, Maintenance & Repair in Downey, CA?
Percentage of Population Employed in Installation, Maintenance & Repair in Downey is 3.6%.
What is the Percentage of Population Employed in Installation, Maintenance & Repair in California?
Percentage of Population Employed in Installation, Maintenance & Repair in California is 2.6%.
What is the Percentage of Population Employed in Installation, Maintenance & Repair in the United States?
Percentage of Population Employed in Installation, Maintenance & Repair in the United States is 3.1%.