Cities with the Highest Percentage of Immigrants from Cuba in California
RELATED REPORTS & OPTIONS
Cuba
California
Compare Cities
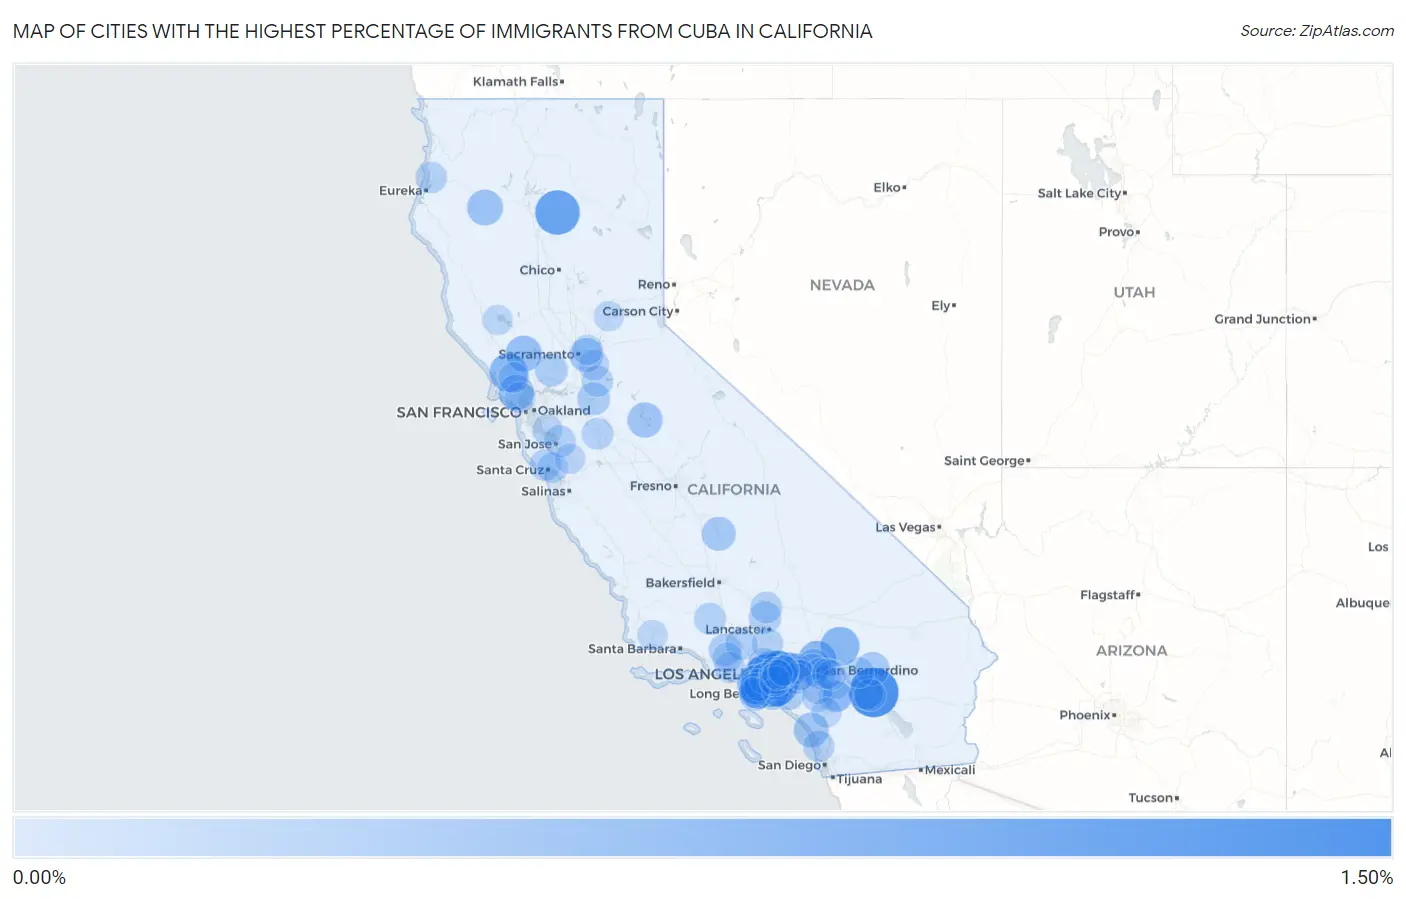
Map of Cities with the Highest Percentage of Immigrants from Cuba in California
0.00%
1.50%
Cities with the Highest Percentage of Immigrants from Cuba in California
| City | Cuba | vs State | vs National | |
| 1. | Desert Palms | 1.45% | 0.077%(+1.37)#-1 | 0.40%(+1.05)#0 |
| 2. | Bell | 1.42% | 0.077%(+1.34)#0 | 0.40%(+1.02)#1 |
| 3. | Santa Fe Springs | 1.40% | 0.077%(+1.32)#1 | 0.40%(+0.996)#2 |
| 4. | Benton Park | 1.23% | 0.077%(+1.16)#2 | 0.40%(+0.833)#3 |
| 5. | Shingletown | 1.11% | 0.077%(+1.03)#3 | 0.40%(+0.712)#4 |
| 6. | Downey | 0.88% | 0.077%(+0.798)#4 | 0.40%(+0.475)#5 |
| 7. | Lucerne Valley | 0.74% | 0.077%(+0.663)#5 | 0.40%(+0.340)#6 |
| 8. | Cotati | 0.72% | 0.077%(+0.638)#6 | 0.40%(+0.315)#7 |
| 9. | Hawthorne | 0.71% | 0.077%(+0.631)#125 | 0.40%(+0.308)#196 |
| 10. | Del Aire | 0.70% | 0.077%(+0.620)#126 | 0.40%(+0.297)#197 |
| 11. | Crestline | 0.70% | 0.077%(+0.619)#127 | 0.40%(+0.296)#198 |
| 12. | Vincent | 0.61% | 0.077%(+0.532)#128 | 0.40%(+0.209)#199 |
| 13. | Walnut Park | 0.59% | 0.077%(+0.509)#129 | 0.40%(+0.186)#200 |
| 14. | Mayflower Village | 0.58% | 0.077%(+0.499)#130 | 0.40%(+0.176)#201 |
| 15. | Angwin | 0.55% | 0.077%(+0.472)#131 | 0.40%(+0.149)#202 |
| 16. | Hayfork | 0.53% | 0.077%(+0.449)#132 | 0.40%(+0.127)#203 |
| 17. | Lucas Valley Marinwood | 0.51% | 0.077%(+0.428)#133 | 0.40%(+0.105)#204 |
| 18. | Lake Don Pedro | 0.49% | 0.077%(+0.416)#134 | 0.40%(+0.094)#205 |
| 19. | East Whittier | 0.48% | 0.077%(+0.401)#135 | 0.40%(+0.078)#206 |
| 20. | Redondo Beach | 0.48% | 0.077%(+0.398)#136 | 0.40%(+0.076)#207 |
| 21. | Camp Pendleton South | 0.47% | 0.077%(+0.396)#137 | 0.40%(+0.073)#208 |
| 22. | Lomita | 0.45% | 0.077%(+0.378)#138 | 0.40%(+0.055)#209 |
| 23. | Cudahy | 0.45% | 0.077%(+0.373)#139 | 0.40%(+0.050)#210 |
| 24. | Muscoy | 0.44% | 0.077%(+0.363)#140 | 0.40%(+0.040)#211 |
| 25. | San Dimas | 0.44% | 0.077%(+0.358)#141 | 0.40%(+0.035)#212 |
| 26. | Rancho Mirage | 0.42% | 0.077%(+0.340)#142 | 0.40%(+0.017)#213 |
| 27. | San Pasqual | 0.41% | 0.077%(+0.336)#143 | 0.40%(+0.013)#214 |
| 28. | Porterville | 0.41% | 0.077%(+0.336)#144 | 0.40%(+0.013)#215 |
| 29. | La Riviera | 0.40% | 0.077%(+0.326)#145 | 0.40%(+0.003)#216 |
| 30. | Joshua Tree | 0.39% | 0.077%(+0.308)#146 | 0.40%(-0.015)#217 |
| 31. | East Rancho Dominguez | 0.37% | 0.077%(+0.291)#147 | 0.40%(-0.032)#218 |
| 32. | Vacaville | 0.34% | 0.077%(+0.267)#148 | 0.40%(-0.056)#219 |
| 33. | Monrovia | 0.34% | 0.077%(+0.260)#184 | 0.40%(-0.063)#305 |
| 34. | Garden Acres | 0.34% | 0.077%(+0.258)#185 | 0.40%(-0.064)#306 |
| 35. | South Gate | 0.32% | 0.077%(+0.246)#189 | 0.40%(-0.077)#313 |
| 36. | La Verne | 0.32% | 0.077%(+0.246)#190 | 0.40%(-0.077)#314 |
| 37. | Fillmore | 0.32% | 0.077%(+0.245)#191 | 0.40%(-0.078)#315 |
| 38. | Rolling Hills Estates | 0.32% | 0.077%(+0.239)#192 | 0.40%(-0.084)#316 |
| 39. | Rialto | 0.31% | 0.077%(+0.235)#193 | 0.40%(-0.088)#317 |
| 40. | Maywood | 0.31% | 0.077%(+0.235)#194 | 0.40%(-0.088)#318 |
| 41. | Lawndale | 0.31% | 0.077%(+0.233)#195 | 0.40%(-0.090)#319 |
| 42. | North Tustin | 0.31% | 0.077%(+0.233)#196 | 0.40%(-0.090)#320 |
| 43. | Rosamond | 0.31% | 0.077%(+0.228)#197 | 0.40%(-0.095)#321 |
| 44. | Seal Beach | 0.29% | 0.077%(+0.214)#198 | 0.40%(-0.109)#322 |
| 45. | Castaic | 0.29% | 0.077%(+0.212)#199 | 0.40%(-0.111)#323 |
| 46. | Hemet | 0.29% | 0.077%(+0.210)#200 | 0.40%(-0.112)#324 |
| 47. | Lennox | 0.29% | 0.077%(+0.208)#201 | 0.40%(-0.115)#325 |
| 48. | Rancho Palos Verdes | 0.28% | 0.077%(+0.200)#202 | 0.40%(-0.123)#326 |
| 49. | Glendale | 0.28% | 0.077%(+0.200)#203 | 0.40%(-0.123)#327 |
| 50. | Pine Mountain Club | 0.27% | 0.077%(+0.196)#204 | 0.40%(-0.127)#328 |
| 51. | Felton | 0.27% | 0.077%(+0.193)#205 | 0.40%(-0.130)#329 |
| 52. | Gardena | 0.27% | 0.077%(+0.191)#206 | 0.40%(-0.132)#330 |
| 53. | Palm Desert | 0.27% | 0.077%(+0.190)#207 | 0.40%(-0.133)#331 |
| 54. | Alum Rock | 0.26% | 0.077%(+0.185)#208 | 0.40%(-0.138)#332 |
| 55. | Patterson | 0.26% | 0.077%(+0.184)#209 | 0.40%(-0.138)#333 |
| 56. | Bradbury | 0.26% | 0.077%(+0.183)#210 | 0.40%(-0.140)#334 |
| 57. | Mojave | 0.26% | 0.077%(+0.181)#211 | 0.40%(-0.142)#335 |
| 58. | Whittier | 0.25% | 0.077%(+0.176)#212 | 0.40%(-0.147)#336 |
| 59. | Norwalk | 0.25% | 0.077%(+0.173)#213 | 0.40%(-0.150)#337 |
| 60. | Mckinleyville | 0.25% | 0.077%(+0.171)#214 | 0.40%(-0.152)#338 |
| 61. | Acton | 0.25% | 0.077%(+0.170)#215 | 0.40%(-0.153)#339 |
| 62. | Huntington Park | 0.24% | 0.077%(+0.165)#216 | 0.40%(-0.158)#340 |
| 63. | Dogtown | 0.24% | 0.077%(+0.163)#217 | 0.40%(-0.160)#341 |
| 64. | Solana Beach | 0.24% | 0.077%(+0.162)#218 | 0.40%(-0.161)#342 |
| 65. | Meadowbrook | 0.23% | 0.077%(+0.157)#219 | 0.40%(-0.166)#343 |
| 66. | Loma Linda | 0.23% | 0.077%(+0.156)#220 | 0.40%(-0.167)#344 |
| 67. | Torrance | 0.23% | 0.077%(+0.151)#221 | 0.40%(-0.172)#345 |
| 68. | El Monte | 0.22% | 0.077%(+0.139)#222 | 0.40%(-0.184)#346 |
| 69. | Westlake Village | 0.21% | 0.077%(+0.137)#223 | 0.40%(-0.186)#347 |
| 70. | San Rafael | 0.21% | 0.077%(+0.136)#224 | 0.40%(-0.187)#348 |
| 71. | Upland | 0.21% | 0.077%(+0.136)#225 | 0.40%(-0.187)#368 |
| 72. | Beaumont | 0.21% | 0.077%(+0.134)#226 | 0.40%(-0.189)#369 |
| 73. | Chino | 0.21% | 0.077%(+0.134)#227 | 0.40%(-0.189)#370 |
| 74. | Wilton | 0.21% | 0.077%(+0.133)#228 | 0.40%(-0.190)#371 |
| 75. | Soquel | 0.21% | 0.077%(+0.132)#229 | 0.40%(-0.191)#372 |
| 76. | Petaluma | 0.21% | 0.077%(+0.130)#230 | 0.40%(-0.192)#373 |
| 77. | Morongo Valley | 0.21% | 0.077%(+0.129)#231 | 0.40%(-0.194)#374 |
| 78. | Mead Valley | 0.20% | 0.077%(+0.122)#232 | 0.40%(-0.201)#375 |
| 79. | Newark | 0.20% | 0.077%(+0.121)#233 | 0.40%(-0.202)#376 |
| 80. | Carmichael | 0.20% | 0.077%(+0.120)#234 | 0.40%(-0.203)#377 |
| 81. | West Whittier Los Nietos | 0.20% | 0.077%(+0.119)#235 | 0.40%(-0.204)#378 |
| 82. | Rancho Mission Viejo | 0.20% | 0.077%(+0.119)#236 | 0.40%(-0.204)#379 |
| 83. | Stanton | 0.20% | 0.077%(+0.119)#237 | 0.40%(-0.204)#380 |
| 84. | Ontario | 0.19% | 0.077%(+0.116)#238 | 0.40%(-0.207)#381 |
| 85. | East Hemet | 0.19% | 0.077%(+0.115)#239 | 0.40%(-0.208)#382 |
| 86. | La Canada Flintridge | 0.19% | 0.077%(+0.109)#240 | 0.40%(-0.214)#383 |
| 87. | Morgan Hill | 0.18% | 0.077%(+0.106)#241 | 0.40%(-0.217)#384 |
| 88. | West Covina | 0.18% | 0.077%(+0.106)#242 | 0.40%(-0.217)#385 |
| 89. | Citrus | 0.18% | 0.077%(+0.105)#243 | 0.40%(-0.218)#386 |
| 90. | Palos Verdes Estates | 0.18% | 0.077%(+0.104)#244 | 0.40%(-0.219)#387 |
| 91. | Lakeport | 0.18% | 0.077%(+0.102)#245 | 0.40%(-0.221)#388 |
| 92. | Colfax | 0.18% | 0.077%(+0.102)#246 | 0.40%(-0.221)#389 |
| 93. | Yucaipa | 0.18% | 0.077%(+0.101)#247 | 0.40%(-0.222)#390 |
| 94. | Mentone | 0.18% | 0.077%(+0.098)#248 | 0.40%(-0.225)#391 |
| 95. | Buellton | 0.17% | 0.077%(+0.097)#249 | 0.40%(-0.226)#392 |
| 96. | Moorpark | 0.17% | 0.077%(+0.097)#250 | 0.40%(-0.226)#393 |
| 97. | South Whittier | 0.17% | 0.077%(+0.097)#251 | 0.40%(-0.226)#394 |
| 98. | Covina | 0.17% | 0.077%(+0.096)#252 | 0.40%(-0.227)#395 |
| 99. | Temecula | 0.17% | 0.077%(+0.095)#253 | 0.40%(-0.228)#396 |
| 100. | Avocado Heights | 0.17% | 0.077%(+0.093)#254 | 0.40%(-0.230)#397 |
Common Questions
What are the Top 10 Cities with the Highest Percentage of Immigrants from Cuba in California?
Top 10 Cities with the Highest Percentage of Immigrants from Cuba in California are:
#1
1.45%
#2
1.42%
#3
1.40%
#4
1.11%
#5
0.88%
#6
0.74%
#7
0.72%
#8
0.71%
#9
0.70%
#10
0.70%
What city has the Highest Percentage of Immigrants from Cuba in California?
Desert Palms has the Highest Percentage of Immigrants from Cuba in California with 1.45%.
What is the Percentage of Immigrants from Cuba in the State of California?
Percentage of Immigrants from Cuba in California is 0.077%.
What is the Percentage of Immigrants from Cuba in the United States?
Percentage of Immigrants from Cuba in the United States is 0.40%.