Cities with the Highest Percentage of Population Employed in Installation, Maintenance & Repair in South Dakota
RELATED REPORTS & OPTIONS
Installation, Maintenance & Repair
South Dakota
Compare Cities
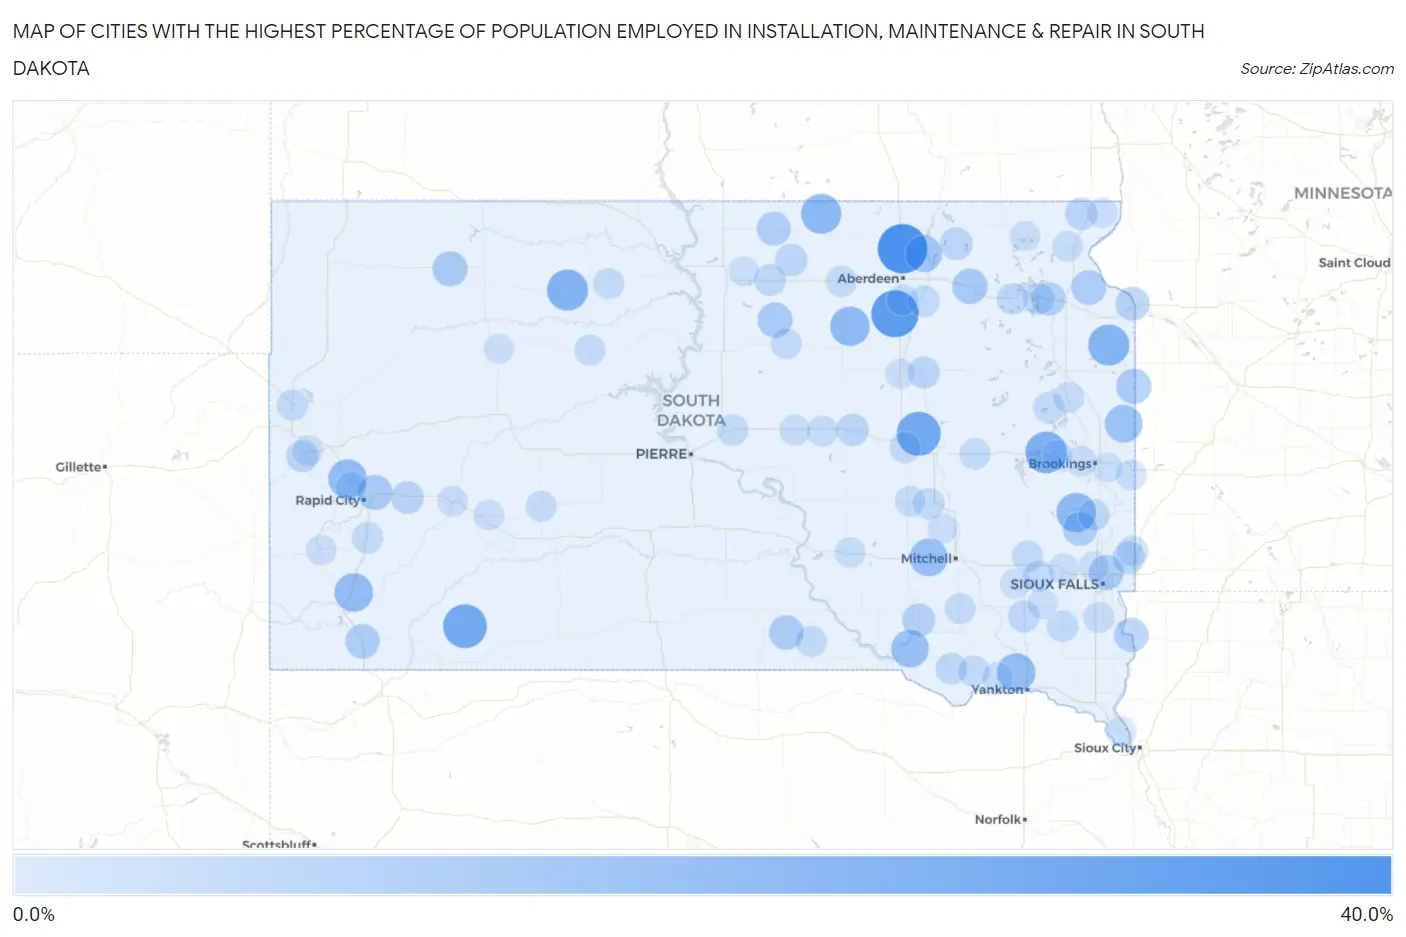
Map of Cities with the Highest Percentage of Population Employed in Installation, Maintenance & Repair in South Dakota
0.0%
40.0%
Cities with the Highest Percentage of Population Employed in Installation, Maintenance & Repair in South Dakota
| City | % Employed | vs State | vs National | |
| 1. | Westport | 38.2% | 3.7%(+34.5)#1 | 3.1%(+35.2)#165 |
| 2. | Mansfield | 34.1% | 3.7%(+30.4)#2 | 3.1%(+31.1)#211 |
| 3. | Orland Colony | 33.3% | 3.7%(+29.6)#3 | 3.1%(+30.3)#228 |
| 4. | Grassland Colony | 33.3% | 3.7%(+29.6)#4 | 3.1%(+30.3)#230 |
| 5. | Kenel | 30.6% | 3.7%(+26.9)#5 | 3.1%(+27.6)#274 |
| 6. | Broadland | 28.6% | 3.7%(+24.9)#6 | 3.1%(+25.5)#322 |
| 7. | Porcupine | 28.4% | 3.7%(+24.7)#7 | 3.1%(+25.3)#323 |
| 8. | Hetland | 25.0% | 3.7%(+21.3)#8 | 3.1%(+21.9)#428 |
| 9. | Isabel | 23.9% | 3.7%(+20.2)#9 | 3.1%(+20.8)#463 |
| 10. | La Bolt | 23.8% | 3.7%(+20.1)#10 | 3.1%(+20.7)#468 |
| 11. | Long Lake | 22.2% | 3.7%(+18.5)#11 | 3.1%(+19.2)#534 |
| 12. | Wentworth | 21.0% | 3.7%(+17.3)#12 | 3.1%(+17.9)#605 |
| 13. | Cresbard | 20.9% | 3.7%(+17.2)#13 | 3.1%(+17.9)#609 |
| 14. | Piedmont | 19.7% | 3.7%(+16.0)#14 | 3.1%(+16.6)#693 |
| 15. | Buffalo Gap | 19.6% | 3.7%(+15.9)#15 | 3.1%(+16.5)#698 |
| 16. | Utica | 19.4% | 3.7%(+15.7)#16 | 3.1%(+16.3)#712 |
| 17. | Mount Vernon | 18.5% | 3.7%(+14.8)#17 | 3.1%(+15.4)#772 |
| 18. | Ravinia | 18.2% | 3.7%(+14.5)#18 | 3.1%(+15.1)#802 |
| 19. | Astoria | 17.8% | 3.7%(+14.1)#19 | 3.1%(+14.7)#841 |
| 20. | Columbia | 16.5% | 3.7%(+12.8)#20 | 3.1%(+13.4)#967 |
| 21. | Crook | 15.1% | 3.7%(+11.4)#21 | 3.1%(+12.0)#1,137 |
| 22. | Andover | 14.3% | 3.7%(+10.6)#22 | 3.1%(+11.2)#1,280 |
| 23. | Gary | 14.0% | 3.7%(+10.3)#23 | 3.1%(+10.9)#1,339 |
| 24. | Ashland Heights | 13.9% | 3.7%(+10.2)#24 | 3.1%(+10.8)#1,358 |
| 25. | Bison | 13.9% | 3.7%(+10.2)#25 | 3.1%(+10.8)#1,359 |
| 26. | Tolstoy | 13.8% | 3.7%(+10.1)#26 | 3.1%(+10.7)#1,381 |
| 27. | Meadow View Addition | 13.5% | 3.7%(+9.78)#27 | 3.1%(+10.4)#1,440 |
| 28. | Wilmot | 13.3% | 3.7%(+9.56)#28 | 3.1%(+10.2)#1,502 |
| 29. | Dallas | 13.1% | 3.7%(+9.41)#29 | 3.1%(+10.0)#1,539 |
| 30. | Oelrichs | 12.7% | 3.7%(+9.04)#30 | 3.1%(+9.68)#1,644 |
| 31. | Chester | 12.7% | 3.7%(+8.99)#31 | 3.1%(+9.63)#1,647 |
| 32. | Fairview | 12.5% | 3.7%(+8.80)#32 | 3.1%(+9.43)#1,703 |
| 33. | Eureka | 12.1% | 3.7%(+8.37)#33 | 3.1%(+9.01)#1,800 |
| 34. | Ortley | 11.8% | 3.7%(+8.06)#34 | 3.1%(+8.70)#1,902 |
| 35. | Big Stone City | 11.7% | 3.7%(+8.04)#35 | 3.1%(+8.68)#1,907 |
| 36. | Armour | 11.0% | 3.7%(+7.30)#36 | 3.1%(+7.93)#2,142 |
| 37. | New Underwood | 9.9% | 3.7%(+6.20)#37 | 3.1%(+6.84)#2,608 |
| 38. | Claremont | 9.8% | 3.7%(+6.10)#38 | 3.1%(+6.74)#2,671 |
| 39. | Hosmer | 9.7% | 3.7%(+5.97)#39 | 3.1%(+6.61)#2,745 |
| 40. | St Lawrence | 9.6% | 3.7%(+5.94)#40 | 3.1%(+6.58)#2,768 |
| 41. | Garretson | 9.5% | 3.7%(+5.80)#41 | 3.1%(+6.43)#2,840 |
| 42. | New Effington | 9.4% | 3.7%(+5.71)#42 | 3.1%(+6.34)#2,889 |
| 43. | Lead | 8.8% | 3.7%(+5.12)#43 | 3.1%(+5.76)#3,234 |
| 44. | Frankfort | 8.8% | 3.7%(+5.07)#44 | 3.1%(+5.70)#3,281 |
| 45. | Bowdle | 8.6% | 3.7%(+4.88)#45 | 3.1%(+5.52)#3,430 |
| 46. | Freeman | 8.6% | 3.7%(+4.88)#46 | 3.1%(+5.51)#3,433 |
| 47. | Avon | 8.4% | 3.7%(+4.72)#47 | 3.1%(+5.36)#3,566 |
| 48. | Waubay | 8.4% | 3.7%(+4.69)#48 | 3.1%(+5.32)#3,593 |
| 49. | Colman | 8.4% | 3.7%(+4.65)#49 | 3.1%(+5.29)#3,613 |
| 50. | Webster | 8.3% | 3.7%(+4.63)#50 | 3.1%(+5.27)#3,624 |
| 51. | Woonsocket | 8.2% | 3.7%(+4.45)#51 | 3.1%(+5.09)#3,801 |
| 52. | Stratford | 8.1% | 3.7%(+4.40)#52 | 3.1%(+5.04)#3,850 |
| 53. | Wolsey | 8.0% | 3.7%(+4.32)#53 | 3.1%(+4.96)#3,917 |
| 54. | Hermosa | 8.0% | 3.7%(+4.27)#54 | 3.1%(+4.91)#3,954 |
| 55. | Belle Fourche | 7.9% | 3.7%(+4.22)#55 | 3.1%(+4.86)#3,994 |
| 56. | Salem | 7.9% | 3.7%(+4.22)#56 | 3.1%(+4.85)#4,000 |
| 57. | Tyndall | 7.8% | 3.7%(+4.11)#57 | 3.1%(+4.75)#4,092 |
| 58. | Hayti | 7.8% | 3.7%(+4.09)#58 | 3.1%(+4.72)#4,108 |
| 59. | Burke | 7.7% | 3.7%(+4.04)#59 | 3.1%(+4.68)#4,146 |
| 60. | Hurley | 7.7% | 3.7%(+4.03)#60 | 3.1%(+4.67)#4,156 |
| 61. | Canistota | 7.7% | 3.7%(+4.03)#61 | 3.1%(+4.67)#4,158 |
| 62. | Blackhawk | 7.7% | 3.7%(+4.00)#62 | 3.1%(+4.64)#4,181 |
| 63. | Blunt | 7.7% | 3.7%(+3.99)#63 | 3.1%(+4.62)#4,208 |
| 64. | Iroquois | 7.5% | 3.7%(+3.84)#64 | 3.1%(+4.48)#4,372 |
| 65. | Warner | 7.5% | 3.7%(+3.79)#65 | 3.1%(+4.42)#4,444 |
| 66. | Ree Heights | 7.4% | 3.7%(+3.70)#66 | 3.1%(+4.34)#4,526 |
| 67. | Timber Lake | 7.3% | 3.7%(+3.61)#67 | 3.1%(+4.25)#4,621 |
| 68. | Parkston | 7.2% | 3.7%(+3.50)#68 | 3.1%(+4.14)#4,767 |
| 69. | North Eagle Butte | 7.1% | 3.7%(+3.44)#69 | 3.1%(+4.08)#4,808 |
| 70. | Ipswich | 7.1% | 3.7%(+3.44)#70 | 3.1%(+4.08)#4,811 |
| 71. | Sherman | 7.1% | 3.7%(+3.44)#71 | 3.1%(+4.08)#4,839 |
| 72. | Seneca | 7.1% | 3.7%(+3.44)#72 | 3.1%(+4.08)#4,840 |
| 73. | Castlewood | 7.1% | 3.7%(+3.42)#73 | 3.1%(+4.06)#4,857 |
| 74. | Volga | 7.1% | 3.7%(+3.37)#74 | 3.1%(+4.01)#4,925 |
| 75. | Worthing | 7.1% | 3.7%(+3.37)#75 | 3.1%(+4.01)#4,927 |
| 76. | Highmore | 7.0% | 3.7%(+3.31)#76 | 3.1%(+3.95)#4,981 |
| 77. | Philip | 7.0% | 3.7%(+3.28)#77 | 3.1%(+3.92)#5,017 |
| 78. | Kimball | 6.8% | 3.7%(+3.14)#78 | 3.1%(+3.77)#5,192 |
| 79. | Tabor | 6.7% | 3.7%(+2.99)#79 | 3.1%(+3.63)#5,393 |
| 80. | Elkton | 6.7% | 3.7%(+2.96)#80 | 3.1%(+3.60)#5,434 |
| 81. | Boulder Canyon | 6.7% | 3.7%(+2.96)#81 | 3.1%(+3.60)#5,438 |
| 82. | Lane | 6.7% | 3.7%(+2.96)#82 | 3.1%(+3.60)#5,464 |
| 83. | Sisseton | 6.6% | 3.7%(+2.94)#83 | 3.1%(+3.58)#5,479 |
| 84. | Humboldt | 6.6% | 3.7%(+2.87)#84 | 3.1%(+3.50)#5,588 |
| 85. | Custer | 6.5% | 3.7%(+2.81)#85 | 3.1%(+3.44)#5,677 |
| 86. | Quinn | 6.5% | 3.7%(+2.75)#86 | 3.1%(+3.38)#5,768 |
| 87. | Wasta | 6.5% | 3.7%(+2.75)#87 | 3.1%(+3.38)#5,771 |
| 88. | Deadwood | 6.3% | 3.7%(+2.56)#88 | 3.1%(+3.20)#6,024 |
| 89. | Arlington | 6.1% | 3.7%(+2.40)#89 | 3.1%(+3.04)#6,292 |
| 90. | Lake City | 6.1% | 3.7%(+2.36)#90 | 3.1%(+2.99)#6,377 |
| 91. | Marion | 6.0% | 3.7%(+2.33)#91 | 3.1%(+2.97)#6,403 |
| 92. | Rosholt | 6.0% | 3.7%(+2.32)#92 | 3.1%(+2.96)#6,424 |
| 93. | Java | 6.0% | 3.7%(+2.25)#93 | 3.1%(+2.88)#6,534 |
| 94. | Bridgewater | 5.9% | 3.7%(+2.21)#94 | 3.1%(+2.85)#6,600 |
| 95. | Jefferson | 5.9% | 3.7%(+2.18)#95 | 3.1%(+2.81)#6,654 |
| 96. | Crooks | 5.9% | 3.7%(+2.17)#96 | 3.1%(+2.80)#6,696 |
| 97. | Redfield | 5.9% | 3.7%(+2.16)#97 | 3.1%(+2.80)#6,701 |
| 98. | Letcher | 5.8% | 3.7%(+2.11)#98 | 3.1%(+2.75)#6,789 |
| 99. | Faith | 5.8% | 3.7%(+2.10)#99 | 3.1%(+2.74)#6,798 |
| 100. | Aurora | 5.8% | 3.7%(+2.08)#100 | 3.1%(+2.72)#6,834 |
Common Questions
What are the Top 10 Cities with the Highest Percentage of Population Employed in Installation, Maintenance & Repair in South Dakota?
Top 10 Cities with the Highest Percentage of Population Employed in Installation, Maintenance & Repair in South Dakota are:
What city has the Highest Percentage of Population Employed in Installation, Maintenance & Repair in South Dakota?
Westport has the Highest Percentage of Population Employed in Installation, Maintenance & Repair in South Dakota with 38.2%.
What is the Percentage of Population Employed in Installation, Maintenance & Repair in the State of South Dakota?
Percentage of Population Employed in Installation, Maintenance & Repair in South Dakota is 3.7%.
What is the Percentage of Population Employed in Installation, Maintenance & Repair in the United States?
Percentage of Population Employed in Installation, Maintenance & Repair in the United States is 3.1%.