Zip Codes with the Highest Percentage of Population Employed in Installation, Maintenance & Repair in Rocklin, CA
RELATED REPORTS & OPTIONS
Installation, Maintenance & Repair
Rocklin
Compare Zip Codes
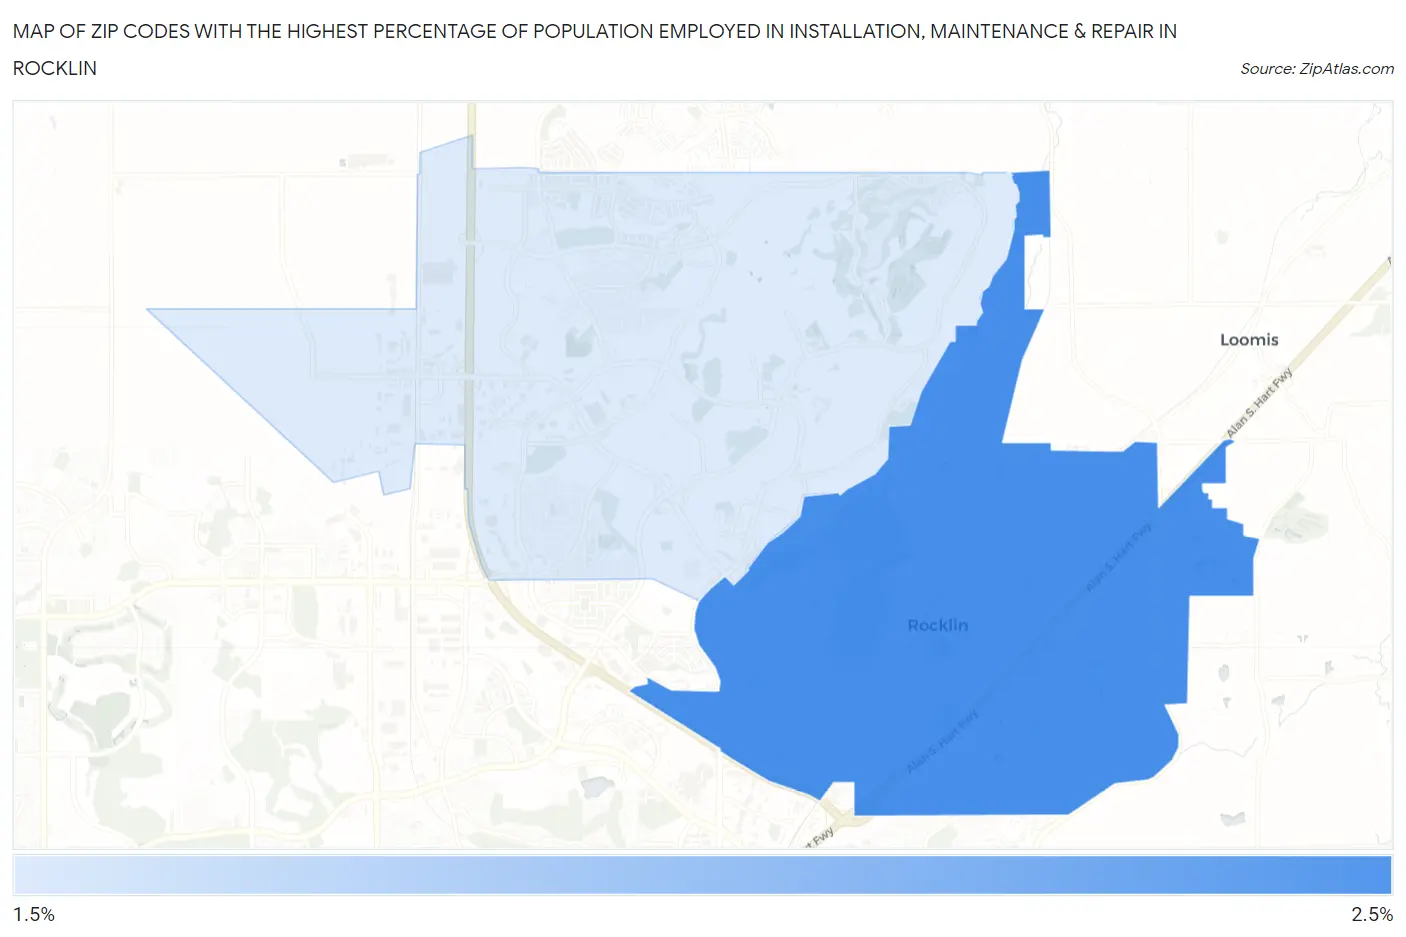
Map of Zip Codes with the Highest Percentage of Population Employed in Installation, Maintenance & Repair in Rocklin
1.7%
2.1%
Zip Codes with the Highest Percentage of Population Employed in Installation, Maintenance & Repair in Rocklin, CA
| Zip Code | % Employed | vs State | vs National | |
| 1. | 95677 | 2.1% | 2.6%(-0.444)#932 | 3.1%(-0.955)#21,490 |
| 2. | 95765 | 1.7% | 2.6%(-0.818)#1,045 | 3.1%(-1.33)#23,174 |
1
Common Questions
What are the Top Zip Codes with the Highest Percentage of Population Employed in Installation, Maintenance & Repair in Rocklin, CA?
Top Zip Codes with the Highest Percentage of Population Employed in Installation, Maintenance & Repair in Rocklin, CA are:
What zip code has the Highest Percentage of Population Employed in Installation, Maintenance & Repair in Rocklin, CA?
95677 has the Highest Percentage of Population Employed in Installation, Maintenance & Repair in Rocklin, CA with 2.1%.
What is the Percentage of Population Employed in Installation, Maintenance & Repair in Rocklin, CA?
Percentage of Population Employed in Installation, Maintenance & Repair in Rocklin is 1.9%.
What is the Percentage of Population Employed in Installation, Maintenance & Repair in California?
Percentage of Population Employed in Installation, Maintenance & Repair in California is 2.6%.
What is the Percentage of Population Employed in Installation, Maintenance & Repair in the United States?
Percentage of Population Employed in Installation, Maintenance & Repair in the United States is 3.1%.