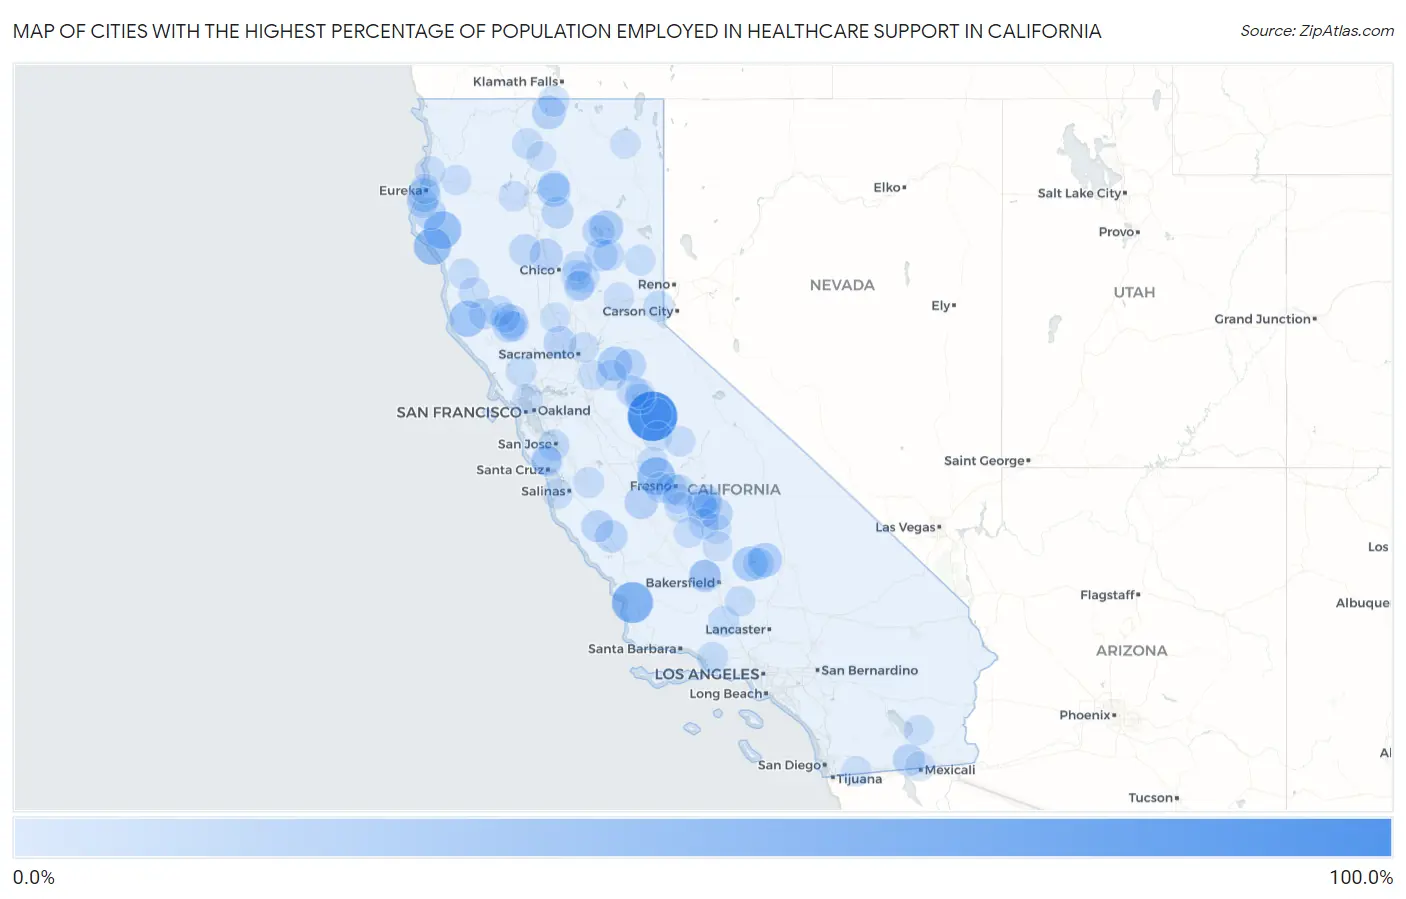
Cities with the Highest Percentage of Population Employed in Healthcare Support in California
RELATED REPORTS & OPTIONS
Healthcare Support
California
Compare Cities
Map of Cities with the Highest Percentage of Population Employed in Healthcare Support in California
0.0%
100.0%
Cities with the Highest Percentage of Population Employed in Healthcare Support in California
| City | % Employed | vs State | vs National | |
| 1. | Coulterville | 100.0% | 3.7%(+96.3)#1 | 3.3%(+96.7)#21 |
| 2. | Los Berros | 59.5% | 3.7%(+55.8)#2 | 3.3%(+56.2)#51 |
| 3. | Ono | 50.0% | 3.7%(+46.3)#3 | 3.3%(+46.7)#89 |
| 4. | La Vina | 44.7% | 3.7%(+41.0)#4 | 3.3%(+41.4)#113 |
| 5. | Myers Flat | 44.0% | 3.7%(+40.4)#5 | 3.3%(+40.8)#116 |
| 6. | Shelter Cove | 42.8% | 3.7%(+39.1)#6 | 3.3%(+39.5)#123 |
| 7. | Philo | 37.9% | 3.7%(+34.3)#7 | 3.3%(+34.7)#148 |
| 8. | Lake Isabella | 31.3% | 3.7%(+27.7)#8 | 3.3%(+28.1)#233 |
| 9. | Drytown | 30.0% | 3.7%(+26.3)#9 | 3.3%(+26.7)#256 |
| 10. | Onyx | 28.7% | 3.7%(+25.0)#10 | 3.3%(+25.4)#273 |
| 11. | Westwood | 28.1% | 3.7%(+24.4)#11 | 3.3%(+24.8)#292 |
| 12. | Round Mountain | 26.7% | 3.7%(+23.0)#12 | 3.3%(+23.4)#320 |
| 13. | Macdoel | 26.0% | 3.7%(+22.3)#13 | 3.3%(+22.7)#333 |
| 14. | Fields Landing | 25.8% | 3.7%(+22.1)#14 | 3.3%(+22.5)#336 |
| 15. | Clearlake Oaks | 24.6% | 3.7%(+21.0)#15 | 3.3%(+21.4)#363 |
| 16. | Three Rocks | 24.3% | 3.7%(+20.6)#16 | 3.3%(+21.0)#372 |
| 17. | Vina | 23.4% | 3.7%(+19.7)#17 | 3.3%(+20.1)#396 |
| 18. | Yolo | 22.2% | 3.7%(+18.5)#18 | 3.3%(+18.9)#441 |
| 19. | Lindcove | 22.2% | 3.7%(+18.5)#19 | 3.3%(+18.9)#442 |
| 20. | Meadow Valley | 21.7% | 3.7%(+18.1)#20 | 3.3%(+18.5)#456 |
| 21. | Clearlake Riviera | 21.7% | 3.7%(+18.0)#21 | 3.3%(+18.4)#459 |
| 22. | San Ardo | 21.5% | 3.7%(+17.8)#22 | 3.3%(+18.2)#468 |
| 23. | Scotia | 21.4% | 3.7%(+17.8)#23 | 3.3%(+18.1)#471 |
| 24. | Lake Almanor Country Club | 21.4% | 3.7%(+17.7)#24 | 3.3%(+18.1)#479 |
| 25. | Weitchpec | 20.8% | 3.7%(+17.2)#25 | 3.3%(+17.6)#506 |
| 26. | Mexican Colony | 20.2% | 3.7%(+16.6)#26 | 3.3%(+17.0)#529 |
| 27. | Patterson Tract | 20.1% | 3.7%(+16.4)#27 | 3.3%(+16.8)#535 |
| 28. | Pine Canyon | 20.0% | 3.7%(+16.3)#28 | 3.3%(+16.7)#536 |
| 29. | Seeley | 19.8% | 3.7%(+16.1)#29 | 3.3%(+16.5)#560 |
| 30. | Pioneer | 19.6% | 3.7%(+15.9)#30 | 3.3%(+16.3)#571 |
| 31. | Shingletown | 19.3% | 3.7%(+15.6)#31 | 3.3%(+16.0)#594 |
| 32. | East Orosi | 18.9% | 3.7%(+15.3)#32 | 3.3%(+15.7)#611 |
| 33. | Rancho Tehama Reserve | 18.8% | 3.7%(+15.1)#33 | 3.3%(+15.5)#618 |
| 34. | Angels | 18.6% | 3.7%(+15.0)#34 | 3.3%(+15.4)#627 |
| 35. | Knights Ferry | 18.2% | 3.7%(+14.5)#35 | 3.3%(+14.9)#650 |
| 36. | Weldon | 18.1% | 3.7%(+14.4)#36 | 3.3%(+14.8)#661 |
| 37. | Montgomery Creek | 17.0% | 3.7%(+13.4)#37 | 3.3%(+13.8)#738 |
| 38. | Greeley Hill | 16.0% | 3.7%(+12.4)#38 | 3.3%(+12.8)#818 |
| 39. | Fruitdale | 16.0% | 3.7%(+12.3)#39 | 3.3%(+12.7)#820 |
| 40. | West Park | 16.0% | 3.7%(+12.3)#40 | 3.3%(+12.7)#824 |
| 41. | Dorris | 15.9% | 3.7%(+12.2)#41 | 3.3%(+12.6)#829 |
| 42. | Loleta | 15.7% | 3.7%(+12.1)#42 | 3.3%(+12.5)#851 |
| 43. | Oak Run | 15.5% | 3.7%(+11.8)#43 | 3.3%(+12.2)#886 |
| 44. | Malaga | 15.4% | 3.7%(+11.7)#44 | 3.3%(+12.1)#893 |
| 45. | Upper Lake | 15.4% | 3.7%(+11.7)#45 | 3.3%(+12.1)#894 |
| 46. | Berry Creek | 15.3% | 3.7%(+11.6)#46 | 3.3%(+12.0)#909 |
| 47. | Saticoy | 15.2% | 3.7%(+11.5)#47 | 3.3%(+11.9)#927 |
| 48. | Quincy | 15.0% | 3.7%(+11.4)#48 | 3.3%(+11.8)#945 |
| 49. | Weed | 15.0% | 3.7%(+11.3)#49 | 3.3%(+11.7)#955 |
| 50. | Carnelian Bay | 14.9% | 3.7%(+11.2)#50 | 3.3%(+11.6)#963 |
| 51. | Zayante | 14.6% | 3.7%(+10.9)#51 | 3.3%(+11.3)#1,013 |
| 52. | Frazier Park | 14.5% | 3.7%(+10.8)#52 | 3.3%(+11.2)#1,025 |
| 53. | Buena Vista | 14.4% | 3.7%(+10.7)#53 | 3.3%(+11.1)#1,040 |
| 54. | Beckwourth | 14.3% | 3.7%(+10.6)#54 | 3.3%(+11.0)#1,055 |
| 55. | Monson | 14.3% | 3.7%(+10.6)#55 | 3.3%(+11.0)#1,060 |
| 56. | Tres Pinos | 14.2% | 3.7%(+10.5)#56 | 3.3%(+10.9)#1,083 |
| 57. | Fairmead | 14.0% | 3.7%(+10.3)#57 | 3.3%(+10.7)#1,119 |
| 58. | Johnson Park | 13.9% | 3.7%(+10.3)#58 | 3.3%(+10.7)#1,126 |
| 59. | Talmage | 13.7% | 3.7%(+10.0)#59 | 3.3%(+10.4)#1,169 |
| 60. | Laytonville | 13.6% | 3.7%(+9.94)#60 | 3.3%(+10.3)#1,197 |
| 61. | Cherokee | 13.6% | 3.7%(+9.88)#61 | 3.3%(+10.3)#1,204 |
| 62. | Willits | 13.6% | 3.7%(+9.88)#62 | 3.3%(+10.3)#1,207 |
| 63. | Smith Corner | 13.4% | 3.7%(+9.77)#63 | 3.3%(+10.2)#1,225 |
| 64. | Jamestown | 13.4% | 3.7%(+9.73)#64 | 3.3%(+10.1)#1,234 |
| 65. | Eldridge | 13.3% | 3.7%(+9.61)#65 | 3.3%(+10.0)#1,260 |
| 66. | East Tulare Villa | 13.2% | 3.7%(+9.56)#66 | 3.3%(+9.96)#1,272 |
| 67. | Stallion Springs | 13.0% | 3.7%(+9.35)#67 | 3.3%(+9.75)#1,320 |
| 68. | Ahwahnee | 13.0% | 3.7%(+9.34)#68 | 3.3%(+9.74)#1,321 |
| 69. | Seville | 12.9% | 3.7%(+9.23)#69 | 3.3%(+9.62)#1,343 |
| 70. | North Richmond | 12.8% | 3.7%(+9.08)#70 | 3.3%(+9.48)#1,377 |
| 71. | French Gulch | 12.6% | 3.7%(+8.94)#71 | 3.3%(+9.34)#1,410 |
| 72. | Willow Creek | 12.6% | 3.7%(+8.89)#72 | 3.3%(+9.29)#1,425 |
| 73. | Kerman | 12.4% | 3.7%(+8.73)#73 | 3.3%(+9.12)#1,477 |
| 74. | Columbia | 12.4% | 3.7%(+8.68)#74 | 3.3%(+9.08)#1,487 |
| 75. | Laton | 12.2% | 3.7%(+8.57)#75 | 3.3%(+8.97)#1,514 |
| 76. | Lompico | 12.2% | 3.7%(+8.55)#76 | 3.3%(+8.94)#1,524 |
| 77. | Corcoran | 12.2% | 3.7%(+8.48)#77 | 3.3%(+8.88)#1,537 |
| 78. | Strathmore | 12.1% | 3.7%(+8.45)#78 | 3.3%(+8.85)#1,546 |
| 79. | Westhaven Moonstone | 12.1% | 3.7%(+8.43)#79 | 3.3%(+8.83)#1,556 |
| 80. | Oroville East | 12.1% | 3.7%(+8.39)#80 | 3.3%(+8.79)#1,562 |
| 81. | Concow | 12.0% | 3.7%(+8.36)#81 | 3.3%(+8.76)#1,574 |
| 82. | Spring Valley Cdp Lake County | 12.0% | 3.7%(+8.27)#82 | 3.3%(+8.67)#1,594 |
| 83. | Ridgecrest Heights | 11.9% | 3.7%(+8.23)#83 | 3.3%(+8.62)#1,605 |
| 84. | Clearlake | 11.9% | 3.7%(+8.22)#84 | 3.3%(+8.61)#1,613 |
| 85. | Washington | 11.8% | 3.7%(+8.16)#85 | 3.3%(+8.56)#1,624 |
| 86. | Niland | 11.7% | 3.7%(+8.06)#86 | 3.3%(+8.46)#1,657 |
| 87. | Lucerne | 11.6% | 3.7%(+7.91)#87 | 3.3%(+8.30)#1,701 |
| 88. | Herald | 11.6% | 3.7%(+7.90)#88 | 3.3%(+8.29)#1,703 |
| 89. | Mcclellan Park | 11.6% | 3.7%(+7.89)#89 | 3.3%(+8.28)#1,710 |
| 90. | California Pines | 11.5% | 3.7%(+7.80)#90 | 3.3%(+8.20)#1,746 |
| 91. | Potrero | 11.4% | 3.7%(+7.75)#91 | 3.3%(+8.15)#1,759 |
| 92. | Samoa | 11.4% | 3.7%(+7.71)#92 | 3.3%(+8.11)#1,768 |
| 93. | Monmouth | 11.3% | 3.7%(+7.61)#93 | 3.3%(+8.01)#1,797 |
| 94. | Calexico | 11.3% | 3.7%(+7.61)#94 | 3.3%(+8.00)#1,800 |
| 95. | Catheys Valley | 11.3% | 3.7%(+7.58)#95 | 3.3%(+7.98)#1,808 |
| 96. | Mccloud | 11.2% | 3.7%(+7.57)#96 | 3.3%(+7.97)#1,813 |
| 97. | Sand City | 11.2% | 3.7%(+7.49)#97 | 3.3%(+7.89)#1,837 |
| 98. | Ducor | 11.1% | 3.7%(+7.39)#98 | 3.3%(+7.78)#1,885 |
| 99. | Grimes | 10.8% | 3.7%(+7.15)#99 | 3.3%(+7.55)#1,960 |
| 100. | Kelly Ridge | 10.7% | 3.7%(+7.07)#100 | 3.3%(+7.47)#1,992 |
Common Questions
What are the Top 10 Cities with the Highest Percentage of Population Employed in Healthcare Support in California?
Top 10 Cities with the Highest Percentage of Population Employed in Healthcare Support in California are:
#1
100.0%
#2
59.5%
#3
44.7%
#4
44.0%
#5
42.8%
#6
37.9%
#7
31.3%
#8
30.0%
#9
28.7%
#10
28.1%
What city has the Highest Percentage of Population Employed in Healthcare Support in California?
Coulterville has the Highest Percentage of Population Employed in Healthcare Support in California with 100.0%.
What is the Percentage of Population Employed in Healthcare Support in the State of California?
Percentage of Population Employed in Healthcare Support in California is 3.7%.
What is the Percentage of Population Employed in Healthcare Support in the United States?
Percentage of Population Employed in Healthcare Support in the United States is 3.3%.